ISSN(Online): 2319-8753 ISSN (Print): 2347-6710
I
nternational
J
ournal of
I
nnovative
R
esearch in
S
cience,
E
ngineering and
T
echnology
(A High Impact Factor, Monthly, Peer Reviewed Journal)
Visit: www.ijirset.com
Vol. 7, Issue 11, November 2018
Mathematical Approaches with Least Square
Method Suitability in Circularity
Swathi1, Chandrppa C N2
Assistant Professor, Department of Mechanical Engineering, Christ Deemed to be University, Bengaluru, India1 Professor and Head, Department of Automobile Engineering, Acharya Institute of Technology, Bengaluru, India 2
ABSTRACT: Evaluation of form error is a critical aspect of many manufacturing process because this tolerance requires verification in all three dimensions.Many methods have been proposed in efforts to improve upon the results obtained from co –ordinate measuring machine. In this work, a least square technique is introduced for use in evaluating the forms of circularity. The part considered for the work is torque shaft. The shaft is divided into circular segments at different heights (z levels) for the evaluation. The circularity is calculated by considering the two aspects, mean radius and also the centre of the circle. The mathematical evaluation code is generated for Least Square (L2) Method on different approaches and then solved using software program in C language.The input data is taken by inspecting the torque shaft by advanced measuring instrument, co-ordinate measuring machine. For all the forms considered the proposed new formulations are proved to be equal or better than the co ordinate measuring machine (CMM) values. The results obtained from the developed code are in good agreement as compared with the values of CMM.
KEYWORDS: Form tolerance, Circularity, Least Square Method.
I. INTRODUCTION
Tolerance is defined as the magnitude of permissible variation of a dimension or other measured or control criterion from specified value. Tolerances have to be allowed because of the inevitable human failings and machine limitations which prevent ideal achievement during fabrication. The primary purpose of tolerance is to permit variation in dimension without degradation of the performance is the criterion; there the functional requirements will be the dominating factor in setting tolerances.Evaluation of form tolerance plays a very important role in many manufacturing industries for the specified tolerance verification. In many manufacturing industries in-spite of using high range technologies there are more chances that the manufactured part may reach to its final required shape but with some deviation.
Advanced manufacturing processes are induced in the manufacturing domain to achieve precision and exact parts meeting the requirements with application. Tolerance is a feature to accommodate the variations subject to the optimization of exactness against variables. Form tolerance helps to monitor the parts, exactness to the design and model. The form tolerance absolves the geometries like flatness, straightness, circularity, circularity.Evaluation of form tolerance is a critical aspect of many manufacturing process. Form tolerance is defined as a group of geometric tolerances that limit the amount of error in the shape of a feature. A great majority of mechanical parts comprise of cicular features are considered for circularity such as push pull tube, inner and outer cylinder, wheel axle, cylindrical crankpin, piston which are used in aircraft. The component considered in this study is torque shaft of an aerospace application. The component is measured using the CMM.
ISSN(Online): 2319-8753 ISSN (Print): 2347-6710
I
nternational
J
ournal of
I
nnovative
R
esearch in
S
cience,
E
ngineering and
T
echnology
(A High Impact Factor, Monthly, Peer Reviewed Journal)
Visit: www.ijirset.com
Vol. 7, Issue 11, November 2018
surface must lie. In Geometric Dimensioning and Tolerancing, circularity tolerance is used when circular part features must have good circularitylike pins or camshafts. While circularity applies only to cross sections, circularity applies simultaneously to the entire surface.
A common reason for circularity control to be used on a drawing is to limit the surface conditions (out of round, straightness and taper) of a shaft diameter. The circularity control limits the maximum allowable circularity
error. Conditions for circularity control are:The circularity control must be within its size tolerance, the circularity
control tolerance must be less than the total size tolerance, and thecircularity control does not affect the outer boundary of the feature of size.
In the area of form tolerance measurement many techniques have been suggested and implemented over the years [1-12]. Normal Least Square method is one among them and used in present study which minimizes the sum of the squares of the perpendicular distances to the axis of the component from different points.
Specifications Test for Circularity control as per ANSI Y 14.5 M are:
For circularitycontrol to be a legal specification [15], it must satisfy the following conditions: 1. No datum can be specified in feature control frame.
2. No modifiers can be specified in the feature control surface. 3. The control must be applied to a cylindrical feature.
4. The circularity control tolerance value must be less than any geometric control that limits the circularity of the feature.
II. PROBLEM DEFINITION
A shaft is an element used to transmit power and torque, and it can allow reverse bending. Most shafts have circular cross sections, either solid or tubular.
Least square approximation is the mathematical procedure for finding the best-fitting curve to a given set of points by minimizing the sum of the squares of the offsets ("the residuals") of the points from the curve. The method of least squares is a standard approach to the approximate solution of over determined systems [4], i.e., sets of equations in which there are more equations than unknowns. "Least squares" means that the overall solution minimizes the sum of the squares of the errors made in solving every single equation. The sum of the squares of the offsets is used instead of the offset absolute values because this allows the residuals to be treated as a continuous differentiable quantity. The goal of Least-Squares Method is to find a good estimation of parameters that fit a function, f(x), of a set of data, x1...xn.
The Least-Squares Method requires that the estimated function has to deviate as little as possible from f(x) in the sense of L2-norm.
Circularityone among the form tolerances has an important role in industries because of the central role of bearings and shafts in machines. Circularity is more complex than straightness, flatness, and circularity; not only because it is three-dimensional, but also for its measure in Cartesian and Polar coordinate systems. Circularity is a condition on a surface of revolution in which all points of the surface are equidistant from a common axis. Significant error associated with this characteristic may result in the failure or inadequate functioning of the corresponding part. Accurate measurement of this error is not a trivial task due to the 3D nature of the characteristic
III. METHODOLOGY
Experimental Details:
A huge number of mechanical parts embrace of cylindrical features such as shafts and revolving devices. A vital geometric characteristic that is used to control form and function of cylindrical features is circularity. The part
ISSN(Online): 2319-8753 ISSN (Print): 2347-6710
I
nternational
J
ournal of
I
nnovative
R
esearch in
S
cience,
E
ngineering and
T
echnology
(A High Impact Factor, Monthly, Peer Reviewed Journal)
Visit: www.ijirset.com
Vol. 7, Issue 11, November 2018
(CMM). The diameter of the probe used for the measurement of the torque shaft is 5 mm. The total length of the part is 83 mm with the diameters 47 mm, 40mm and 39mm for the height of 13mm, 30mm, and 40mm respectively. The part is placed vertically as shown in figure 1. To fix the datum along the z axis of the cylinder the flatness for the plane at the top and bottom of cylinder is measured and the planes have a flatness of 63 microns. The shaft is measured at different z levels (6mm, 12mm, 20mm, 30mm, 40mm, 50mm, 60mm, 70mm) levels for circularity along the circumference. For circularity measurement the centre of the circle (x, y) is at a distance of 41.5mm (half the length). This is measured by measuring the co ordinates along the circumference of the circle at minimum of six points and then the center is set as zero. With the reference of this point the co ordinates along the circumference is measured for circles at different z levels.
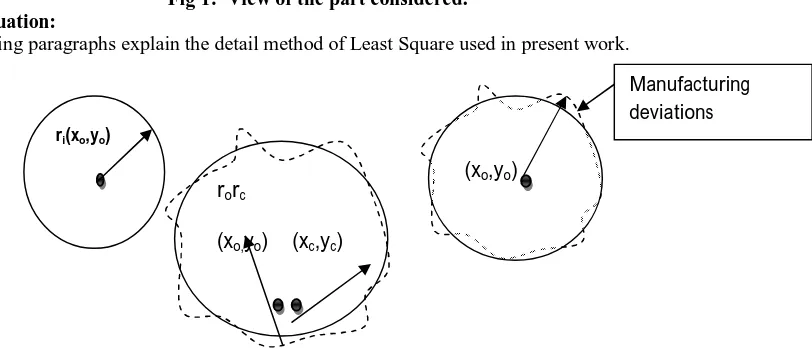
Fig 1: View of the part considered. Mathematical evaluation:
The following paragraphs explain the detail method of Least Square used in present work.
Circularity:
The possible deviations for the circularity occur in two ways:
With the centre being the ideal point (xo=0, yo=0), the difference of radii (ri-ro) i.e., nominal distanceri
represented in figure 2 and manufactured radius rorepresented infigure 3 is the actual deviation of the part with
known co ordinatesfrom the centre (reference point).
Cylinders are manufactured in the focus of maintaining the circularity and its envelop all along the datum. Datum of reference centre is usually located and aligned during manufacturing (like in lathe chuck centre alignment is referenced to zero before metal cutting). Inspection of these surfaces for circularity is an added task: to manipulate a centre and calculate the equidistant value from the manipulated centre.
Plane considered
Plane considered
ri(xo,yo)
(xo,yo)
Manufacturing deviations
rorc
(xo,yo) (xc,yc)
ISSN(Online): 2319-8753 ISSN (Print): 2347-6710
I
nternational
J
ournal of
I
nnovative
R
esearch in
S
cience,
E
ngineering and
T
echnology
(A High Impact Factor, Monthly, Peer Reviewed Journal)
Visit: www.ijirset.com
Vol. 7, Issue 11, November 2018
The deviation of radius (rc-ro) presents the deviation in circularity with respect to manipulated centre, rc is the distance
between manipulated centre and the manufactured circumference, rois the distance between ideal centre and the
manufactured circumference.
The measure of deviation on error band is attempted to minimize by standard deviation procedure by considering the mean of the radius calculated for actual deviation (ro-avgro) and the manufactured centre (rc-avgrc).
The deviation of radius (rc-ri) evaluated by manipulated centre (xc,yc) and the ideal reference centre (xo,yo) gives the
cumulative variation because of mathematically evaluated centre and the manufactured circumference.
The changes in circumference only because the centre is shifted, figure 4. Best fit of this is attempted by fitting the circle by Least Square Method (LSM) [9].
rc=
2 2
(
x
x
c)
(
y
y
c)
(1)ro=
2 2
(
x
x
o)
(
y
y
o)
(2) L1 and Least square function is given by,L2= (ro-rc)2
IV. RESULTS AND DISCUSSIONS
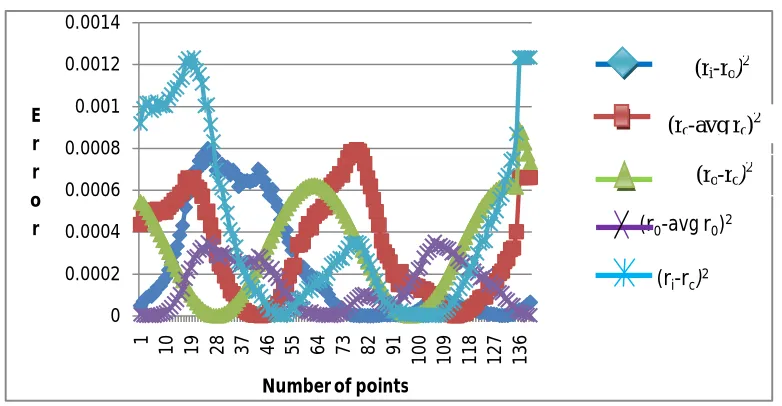
The results obtained with and Least Square method (LS) for circularity at each z level is tabulated table1 and the values are compared with the values obtained with power inspect software. The graph for L1 norm and the Least Square method are plotted at z levels of 20mm, 40mm, 50mm and the normal distribution curve for the Least Square method at same z levels is plotted. The straightness of the centers of the circle at all z levels is calculated. Circularity at different diameters are calculated using the Least Square method are tabulated table 2 and the values are compared with the Power Inspect software values also.
Table 1: Calculated circularity at different z levels with L1, L2 norm compared with Power inspect software values.
Figures from 5 to 11 represent the circularity for L2 considering the centers and the radius for the cylinder points for cylinder points at different z levels.
Circularity
Z levels (mm)
L1 (mm) PI (mm) LS (mm)
(ro-rc) (ro-avg ro) (rc-avg rc) (ro-rc)2 (ro-avg ro)2 (rc-avg rc)2
ISSN(Online): 2319-8753 ISSN (Print): 2347-6710
I
nternational
J
ournal of
I
nnovative
R
esearch in
S
cience,
E
ngineering and
T
echnology
(A High Impact Factor, Monthly, Peer Reviewed Journal)
Visit: www.ijirset.com
Vol. 7, Issue 11, November 2018
Fig 5: z=20mm.
Fig 6: z=6mm. Fig 7: z=12 mm.
0 0.0002 0.0004 0.0006 0.0008 0.001 0.0012 0.0014
1 10 19 28 37 64 55 64 73 82 91
1 0 0 1 0 9 1 1 8 1 2 7 1 3 6 E r r o r
Number of points
(r0-avg r0)2
(ri-rc)2
0 0.0005 0.001 0.0015 0.002 0.0025 0.003
1 16 31 46 61 76 91
1 0 6 1 2 1 1 3 6 1 5 1 E r r o r
Number of points
0 0.0005 0.001 0.0015 0.002 0.0025
1 15 29 43 57 71 85 99
1 1 3 1 2 7 1 4 1 1 5 5 E r r o r
Number of points (ro-rc)
2 (ri-ro)
2
ISSN(Online): 2319-8753 ISSN (Print): 2347-6710
I
nternational
J
ournal of
I
nnovative
R
esearch in
S
cience,
E
ngineering and
T
echnology
(A High Impact Factor, Monthly, Peer Reviewed Journal)
Visit: www.ijirset.com
Vol. 7, Issue 11, November 2018
Fig 8: z=40mm. Fig 9: z=50 mm.
Fig 10: z=60mm. Fig 11: z=70 mm.
The standard deviation curve is plotted for circularity error at all the considered z levels.
Z= (10)
f (X)= √
( )
(11) where, x is the Least square values of the error.
is the mean of the x values.
is the standard deviation of x values. Z(x) is standard normal deviate. F(x) is frequency of occurrence.
Figures from 12 to 18 represent Normal Distribution curve of L2 norm for circularity at different z levels.
0 0.0002 0.0004 0.0006 0.0008 0.001 0.0012
1 13 25 37 49 61 73 85 97
10 9 12 1 13 3 E r r o r
Number of points
0 0.0002 0.0004 0.0006 0.0008 0.001 0.0012
1 13 25 37 49 61 73 85 97
10 9 12 1 13 3 E r r o r
Number of points
0 0.01 0.02 0.03 0.04
1 13 25 37 94 61 73 85 97
1 0 9 1 2 1 1 3 3 E r r o r
Number f points
0 0.0002 0.0004 0.0006 0.0008 0.001 0.0012
1 13 25 37 94 61 73 85 97
1 0 9 1 2 1 1 3 3 E r r o r
ISSN(Online): 2319-8753 ISSN (Print): 2347-6710
I
nternational
J
ournal of
I
nnovative
R
esearch in
S
cience,
E
ngineering and
T
echnology
(A High Impact Factor, Monthly, Peer Reviewed Journal)
Visit: www.ijirset.com
Vol. 7, Issue 11, November 2018
Fig 12: Z=20mm.
Fig 13: z= 6mm. Fig 14:z=12 mm.
Fig 15: z=40 mm. Fig 16: z=50mm.
0 500 1000 1500 2000 2500 3000 3500 4000
-2 -1 0 1 2 3
(r0-avg r0)2 (ri-ro)2
(rc-avg rc)2
(ro-rc)2
(ri-rc)2
Z f(x)
0 500 1000 1500 2000 2500 3000 3500
-2 -1 0 1 2 3
f(x)
z -2000
0 2000 4000 6000 8000
-4 -2 0 2 4
f(X)
z
-500 0 500 1000 1500 2000 2500
-2 0 2 4
f(x)
z
0 1000 2000 3000 4000 5000 6000 7000 8000 9000 10000
-2 0 2 4
f(x)
ISSN(Online): 2319-8753 ISSN (Print): 2347-6710
I
nternational
J
ournal of
I
nnovative
R
esearch in
S
cience,
E
ngineering and
T
echnology
(A High Impact Factor, Monthly, Peer Reviewed Journal)
Visit: www.ijirset.com
Vol. 7, Issue 11, November 2018
Fig 17: z= 60mm. Fig 18: z=70mm.
V. CONCLUSIONS
. The circularity is calculated using five methods as mentioned in the methodology, among which the (ro-
avgro) is suggested to be the better method for the evaluation of circularity. The next substitute method can be (rc-avgrc)
which gives the minimum error when compared with rest of the three methods. The method (ri-ro) can also be adopted
in calculation of the error whose error values are acceptable. The (ro-rc) and (ri-ro) are not viable as the errors obtained
are more as compared with three other methods which are discussed above. The reliability of the method is presented with Normal Distribution curves.
From this study, it is evident that the Least Square (with known and calculated centre) approximation technique is a viable method for form tolerance evaluation. The graphs plotted for Least square and L1 approximation over the suggested (with known and calculated centre) method have a smooth curve when compared to other methods of evaluation which shows that the error is uniformly distributed along the circumference of the cylinder. Hence the method suggested is best suited for the evaluation of form tolerance.
REFERENCES
1. T. S. R. Murthy and G. C. Reddy, 1982, “Evaluation of the Form Errors of Axis Symmetric Components, Wear, Volume – 83, pp 143 – 150. 2. M.S. Shanmugam, 1987, “New Approach for Evaluating Form Errors of Engineering Surfaces”, Computer Aided Design, pp 368 – 374.
3. Kirsten Carr and placid Ferreria, 1995 “Verification of Form Tolerances Part II: Cylindricity and Straightness of a Median Line, Precision Engineering, Volume – 17, pp 144-156.
4. Hong Tzong and Chia Hsiang Menq, 1996, “A Unified Least Square Approach To The Evaluation of Geometric Errors Using Discrete Measurement Data”, International Journal of Machine Tools and Design, Volume – 36, pp 1269 – 1290
5. V.N. Narayanan Namboothiri, M.S Shunmugam, 1998, “Form Error Evaluation Using L 1 –approximation”, Comput. Methods Appl. Mech. Engrg, Volume - 162, pp 133-149.
6. Olivier Dovillers and Franco P. Preparata, 2000, “Evaluating theCylindricity of a Nominally Cylindrical Point Set”, 11th ACM-SIAM Sympos Discrete Algorithms, pp - 518 – 527.
7. Timothy Weber, SaeidMotavalli, BehroozFallahi and S. Hossein Cheraghi, 2002, “A Unified Approach To Form Error Evaluation”, Journal of the International Societies for Precision Engineering and Nanotechnology, Volume – 26, pp 269–278.`
8. Y.Z. Lao, H.W. Leong, F.P. Preparataand G. Singh, 2003, “Accurate Cylindricity Evaluation with Axis-Estimation Pre processing”, Precision Engineering, Volume – 27, pp 429–437.
9. R. Bullock, Oct 24- 2006, “Least Square Circle Fit”, pp 1-3.
10. Ye Ding, LiMin Zhu, Han Ding, 2007, “Semidefinite Programming for Chebyshev Fitting of Spatial Straight Line With Applications to Cutter Location Planning and Tolerance Evaluation”, Precision Engineering, Volume – 31, pp 364–368.
11. N. Venkaiah and M.S Shanmugam, 2007, “Evaluation of Form Data Using Computational Geometric Techniques—Part I: Circularity error”, International Journal of Machine Tools & Manufacture, Volume – 47, pp 1229–1236.
12. J.A. Ezquerro and M.A. Hernández, 2009, “An Optimization of Chebyshev's Method”, Journal of Complexity, Volume - 25 pp 343-36. 13. Alex Krulikowski, “Engineering Design and Tolerancing”, Cengage Learning, Second Edition, 1997.
14. Richard. A. Johonson, “Probability and Statistics for Engineers”, Pearson Education, sixth edition.
0 500 1000 1500 2000 2500
-2 -1 0 1 2 3
f(x)
z
0 500 1000 1500 2000 2500
-2 0 2 4
f(x)