| INVESTIGATION
Resolving the Complex Genetic Basis of Phenotypic
Variation and Variability of Cellular Growth
Naomi Ziv,*,†,‡Bentley M. Shuster,*,†Mark L. Siegal,*,†,1and David Gresham*,†,1
*Center for Genomics and Systems Biology and†Department of Biology, New York University, New York 10003 and‡Department of Microbiology and Immunology, University of California, San Francisco, California 94158 ORCID IDs: 0000-0003-1299-5335 (N.Z.); 0000-0001-6930-2988 (M.L.S.); 0000-0002-4028-0364 (D.G.)
ABSTRACTIn all organisms, the majority of traits vary continuously between individuals. Explaining the genetic basis of quantitative trait variation requires comprehensively accounting for genetic and nongenetic factors as well as their interactions. The growth of microbial cells can be characterized by a lag duration, an exponential growth phase, and a stationary phase. Parameters that characterize these growth phases can vary among genotypes (phenotypic variation), environmental conditions (phenotypic plasticity), and among isogenic cells in a given environment (phenotypic variability). We used a high-throughput microscopy assay to map genetic loci determining variation in lag duration and exponential growth rate in growth rate-limiting and nonlimiting glucose concentrations, using segregants from a cross of two natural isolates of the budding yeast,Saccharomyces cerevisiae. Wefind that some quantitative trait loci (QTL) are common between traits and environments whereas some are unique, exhibiting gene-by-environment interactions. Furthermore, whereas variation in the central tendency of growth rate or lag duration is explained by many additive loci, differences in phenotypic variability are primarily the result of genetic interactions. We used bulk segregant mapping to increase QTL resolution by performing whole-genome sequencing of complex mixtures of an advanced intercross mapping population grown in selective con-ditions using glucose-limited chemostats. Wefind that sequence variation in the high-affinity glucose transporterHXT7contributes to variation in growth rate and lag duration. Allele replacements of the entire locus, as well as of a single polymorphic amino acid, reveal that the effect of variation inHXT7depends on genetic, and allelic, background. Amplifications ofHXT7are frequently selected in experimental evolution in glucose-limited environments, but wefind thatHXT7amplifications result in antagonistic pleiotropy that is absent in naturally occurring variants ofHXT7. Our study highlights the complex nature of the genotype-to-phenotype map within and between environments.
KEYWORDSHXT7; bulk segregant mapping; microcolony; quantitative trait locus; yeast
H
ERITABLE traits that vary quantitatively are the most pervasive class of phenotypic variation. Resolving the genotype–phenotype relationship for quantitative traits re-mains the central challenge for genetics in the genomic era. The trait value of any given individual can be considered as the result of three distinct sets of factors: (1) genetic factors that confer heritable differences within an environment, (2) environmental factors that modulate the effects of genotypes, and (3) the inherent variability of the trait given that geneticand environmental factors are identical. Our ability to predict phenotypes from genotypes requires a detailed understand-ing of how each of these factors contributes to quantitative trait variation.
A variety of genetic mapping techniques have been de-veloped for identifying loci underlying quantitative trait var-iation in diverse organisms. Most studies focus solely on the additive effects of loci, but accurately mapping genotype-to-phenotype requires incorporation of both additive and epi-static effects and an understanding of how these vary with environment. Indeed, as the number of identified causative loci grows, it is becoming increasingly apparent that many genetic effects are conditionally dependent on variation at other loci or in the environment (Mackayet al.2009; Liti and Louis 2012). More precise definition of phenotypes and in-corporation of additional information about environmental Copyright © 2017 by the Genetics Society of America
doi:https://doi.org/10.1534/genetics.116.195180
Manuscript received August 25, 2016; accepted for publication May 2, 2017; published Early Online May 8, 2017.
Supplemental material is available online atwww.genetics.org/lookup/suppl/doi:10. 1534/genetics.116.195180/-/DC1.
conditions might reveal additional genetic determinants and enable more accurate estimation of effect size (Robinson et al.2014). Unbiased genome-wide scans for epistatic effects on trait variation must overcome the limits on statistical power imposed by testing the many possible combinations of loci (Carlborg and Haley 2004). However, technological and analytical advances are making studies of epistasis in-creasingly feasible.
Individuals of identical genotypes can exhibit differences in trait values within the same environment. Although these differences are not genetically encoded, the extent to which genetically identical individuals differ in a given environment is influenced by genetic factors (Geiler-Samerotteet al.2013). Hence, predicting phenotypic values on the basis of genotype (and quantifying the confidence in that prediction) depends not only on the genetic architecture that underlies average differences between genotypes, but also on the genetic factors that influence the phenotypic variability of a trait. Despite an increasing appreciation of the importance of phenotypic vari-ability (Pelkmans 2012; Yvert 2014), many questions remain regarding its genetic and molecular basis (Geiler-Samerotte et al.2013). Specifically, the extent to which the loci that de-termine phenotypic variability and those that dede-termine phe-notypic variation (i.e., differences in average trait values) overlap remains poorly understood (Hallet al.2007; Yanget al.2012; Ayroleset al.2015).
Complex networks of interacting genetic and environmen-tal factors regulate cell growth in microbes and multicellular organisms, making cell growth an ideal system to dissect the genetic basis of complex traits. Moreover, variation in cell growth is important from an evolutionary perspective as it is a major component of fitness in microbes (Blomberg 2011). Therefore, dissecting the genetic basis of cell growth varia-tion in ecologically relevant environments may also illumi-nate adaptive variation in natural populations. The rate at which a cell grows is the result of myriad cellular processes including nutrient sensing and transport, signal transduction, macromolecular synthesis, and metabolism. In microbes, cul-ture growth can be separated into three distinct phases: (1) a lag phase, which is a period of physiological adaptation during which cells do not grow; (2) an exponential growth phase, in which cells grow at a constant rate; and (3) a sta-tionary phase, in which cell growth stops due to exhaustion of an essential nutrient from the environment (Monod 1949). These growth phases vary independently in natural popula-tions in different condipopula-tions (Cubillos et al.2011; Zivet al. 2013b). Recently, we have developed a high-throughput micro-colony growth rate assay (Levyet al.2012; Zivet al.2013b) that accurately quantifies each of these phases in thousands of individuals and different environmental conditions, facili-tating high-resolution dissection of cell growth phenotypes.
Budding yeast is an ideal model for the analysis of complex traits through genetic analysis (Liti and Louis 2012). Quan-titative trait loci (QTL) underlying variation in complex traits can be mapped by analyzing genotype–phenotype relationships in segregants of crosses. The detection of QTL depends on the
effect sizes and frequencies of alleles whereas resolving causa-tive variants to individual genes depends on the frequency of recombination (Mackayet al.2009). Individual segregant anal-ysis involves genotyping and phenotyping individual segregants and testing for associations (Steinmetzet al.2002; Gerkeet al. 2009; Cubillos et al.2011; Bloomet al.2013). Alternatively, bulk segregant analysis involves selecting a subset of the pop-ulation of segregants based on extreme trait values and looking for a deviation in allele frequency from that of the entire population (Michelmoreet al.1991; Ehrenreichet al. 2010; Swinnenet al.2012). The advantage of bulk segregant mapping is that the increased sample size increases the power to detect loci with small effects (Ehrenreichet al.2010). However, analysis of individual genotypes is required to identify genetic interactions (Wilkeninget al.2014). Resolving QTL to causative variants using bulk segregant mapping can be improved by using an advanced intercross population, as in-creased recombination decreases linkage between adjacent sites (Darvasi and Soller 1995; Parts et al. 2011; Cubillos et al.2013; Illingworthet al.2013).
In this study, we dissected the genetic architecture of cell growth using a combination of classical interval mapping (a form of individual segregant analysis) and sequencing under selection (a form of bulk segregant analysis) to identify QTL. We defined the genetic architecture of cell growth in two related environments: minimal chemically defined carbon-limiting media containing growth rate-carbon-limiting (0.22 mM) and growth rate-nonlimiting (4.44 mM) glucose concentra-tions. The latter concentration of glucose supports maximal growth rates, despite being more than an order of magnitude lower than that contained in standard lab media (111 mM) (Zivet al.2013b). These environments are ecologically rele-vant, as growth differences in low-glucose conditions distin-guish sympatric Saccharomyces cerevisiae strains isolated from different niches within the same local area (Clowers et al.2015). We decomposed cell growth by quantifying ex-ponential growth rate and lag duration distributions, and mapped loci determining both the phenotypic variation and phenotypic variability of the traits using interval mapping in individual F2 segregants. We then used an advanced inter-cross population and bulk segregant analysis to increase the mapping resolution for QTL.
genetic loci underlying both variation and variability, and how the environment modulates their effects, for accurate phenotypic prediction.
Materials and Methods
Yeast strains and growth analysis
Parental oak (BC248) and vineyard (BC241) strains and the panel of segregants (Gerkeet al.2006) were obtained from the lab of Barak Cohen (Washington University). There are a total of 480 segregants arrayed in six 96-well plates, of which 374 were previously genotyped (Gerkeet al.2009). All seg-regants were phenotyped using the microcolony assay; only genotyped strains were used for interval mapping. The F2 pool used in chemostat experiments consisted of all segre-gants. NCYC3606 and NCYC3591 (Cubilloset al.2009) were used during allele replacements. Strains shown in Supple-mental Material, Figure S9 in File S2 are from Gresham et al.(2008); the evolved clone withHXT6/HXT7amplification is from population G2. All media were minimal chemically defined carbon-limiting media (Saldanha et al. 2004; Braueret al.2005) without amino acid or nucleotide sup-plements. Growth conditions, microscopy, and analysis of growth profiles were performed as described (Ziv et al. 2013b).
Data normalization
For interval mapping, growth rate assays were performed in 96-well plates with each parental strain present in four wells per plate. We found that, although the difference between the parents was clear on each plate, the absolute growth values and the magnitude of the difference changed slightly between plates (between 0.11 and 0.13 for growth rate in limiting glucose, 0.04–0.05 for growth rate in nonlimiting glucose, and 1.25–3.7 for lag duration in limiting glucose). Estimates for mean growth rate and median lag duration within each well on a plate were corrected for plate effects by subtracting the mean phenotype of the two parents and dividing by the difference between parent phenotypes for each plate. This has the effect of scaling segregants across plates, where 0.5 and 20.5 are the values of the vineyard and oak parents (Figure S1 inFile S2). Parental phenotypes were calculated as the mean of all well estimates for a given parent on a given plate. Plate corrected values gave similar LOD profiles to unnormalized data (Pearson correlation.0.98), only with sharper peaks. For variability traits, residuals of a loess re-gression (SD regressed against mean growth rate or median absolute deviation (MAD) regressed against median lag du-ration) were used. For a discussion on the use of loess resid-uals for variability estimation, see Geiler-Samerotte et al. (2013). Residuals were calculated using the“loess”function in R (R Development Core Team 2012), with default param-eters. For regression analyses, we used unscaled values for each segregant. All segregants, including those that were not genotyped, were included in regression analyses for each environment. Use of different measures of central tendency
and variability had little effect on the results. For example, we used within-plate ranks of dispersion to confirm that plate effects do not bias the results for variability traits. We calcu-lated genetic variance proportions by subtracting from one, the ratio of the average parental replicate variance (calcu-lated for each parental strain across 24 wells) to the F2 phe-notypic variance (calculated for all segregants, including those that were not genotyped).
QTL mapping using R/qtl
We used the R package R/qtl for interval mapping (Broman et al.2003). To identify individual additive QTL, we performed genome scans with a single-QTL model (“scanone”function), using a normal phenotype model, a 1-cM step size, and the Haley-Knott (HK) algorithm for all traits. To determine exper-imentwise significance thresholds for each QTL scan, we employed the method of Churchill and Doerge (1994) as implemented in R/qtl (Bromanet al.2003). Briefly, for each QTL scan we performed 10,000 permutations of the trait-specific data. From each permutation, the genome-wide max-imum LOD score was retained and the resulting 10,000 values used to define the experimentwise null distribution. This ap-proach has the effect of creating an empirical null distribution for a particular trait while controlling the overall type I error to beaor less across the multiple hypotheses tested in a genome-wide screen. Only one QTL per chromosome can be identified using the single-QTL scan, corresponding to the position with the maximum LOD score. Empirical null distributions gener-ated from extreme values were used to compute theP-value of the maximum LOD score for each chromosome (Figure S10 in
File S2). QTL were identified using significance thresholds, based on anaof 0.05 or 0.1, in an attempt to balance type I and type II errors. Because LOD profiles showed evidence for more than one QTL on some chromosomes, we also performed genome scans with a two-QTL model (“scantwo” function) using a 5-cM step size. The presence of a second additive QTL on the same chromosome was identified from the two-dimensional scan by considering both the additive and the difference between additive and single-QTL LOD scores (con-sidering only self–self pairs of chromosomes), and comparison with an empirical null distribution generated using 1000 two-dimensional permutations at anaof 0.05 or 0.1 (Figure S11 in
File S2). To identify significant interactions between pairs of loci, we used the scantwo function to compute the LOD scores for a pairwise interaction model (the difference between an additive and full model per pair of loci) (Bromanet al.2003), and determined threshold LOD values at an a of 0.05 or 0.1 based on an empirical null distribution generated using 1000 two-dimensional permutations (Figure S12 inFile S2).
Creation of an advanced intercross population
We created an advanced intercross population by 11 rounds of sporulation and mating starting with a hybrid (F1) of the oak and vineyard strains. As both parental strains are homothallic, we sought to maximize intertetrad mating as follows. Typi-cally, 2.53108cells were sporulated for an average of 9 days.
Cells were sporulated at room temperature in 1% potassium acetate at a density of 53107cell/ml. For mating, the
spor-ulated culture was resuspended in equal amounts of water and ether, and vortexed for 10 min to kill unsporulated cells. Spores were separated using centrifugation, washed with water, and incubated in 1 mg/ml Zymolyase for 10 min at 30°. Spores were resuspended in a large volume of 0.01% Triton and vortexed to increase separation of spores. Spores were subsequently concentrated and plated at high density on multiple YPD plates (1.53108spores per plate). After
19 hr of growth, cells were scraped off the plates and resus-pended in 1% potassium acetate to begin a new round of sporulation. Following thefinal round of sporulation, spores were resuspended in liquid YPD and incubated overnight to facilitate selfing via mating type switching and subsequent mating between mother and daughter cells, resulting in a mapping population comprising homozygous diploids.
Whole-genome sequencing and analysis
Libraries for DNA sequencing were prepared and multiplexed using standard protocols and sequenced using an Illumina HiSeq to an average depth of 40–1753. Reads were aligned to the reference genome (genome version R64-1-1 released 2/3/2011, also known as sacCer3) using BWA (Li and Durbin 2009) and single-nucleotide polymorphisms (SNPs) were identified using SAMtools (Liet al.2009). SNP alleles, position, quality, and the number of high-quality reads mapping to the reference or alternate alleles were extracted from VCFfiles and analyzed in R. Oak- and vineyard-specific alleles were identified in each sample by comparing to SNPs found by sequencing the oak and vineyard strains. The read depth at each locus was calculated as the sum of reads mapping to reference and alter-nate alleles. The number of crossover events was identified in the advanced intercross F12 clones by identifying transitions between oak and vineyard SNPs. We required at least two ad-jacent SNPs from the same parent to define a crossover. For the panel of F2 segregants, numbers of crossovers were based on single transitions in marker genotypes.
QTL mapping using MULTIPOOL
To analyze sequencing under selection data we used MULTIPOOL, which performs genetic mapping from pooled sequencing experiments using a discrete dynamic Bayesian network (Edwards and Gifford 2012). The software takes SNP posi-tions per chromosome as input and the read counts of each allele. MULTIPOOL analysis was performed onfiltered data. SNPs with minor allele frequency , 10% were excluded. Samples used for comparative analysis of SNP frequencies were separated by 12–14 generations (low dilution rate chemostat) or 20–26 generations (high dilution rate chemostat). Replicate
chemostats were analyzed separately and by combining reads at each SNP. Analyses were run in‘contrast’mode, with the ex-ception of the advanced intercross results shown in Figure S5 in
File S2.“Contrast”mode identifies significant differences be-tween two experiments based on the null hypothesis that the underlying allele frequencies across the genome are the same between the two experiments. Each comparison was run with parametersn= 1000 orn= 200 (number of individuals) and r= 1000 orr= 2500 (length of centimorgan in bases). We found that different parameter combinations did not change the overall shape of the LOD profile; however, the n parameter has a large effect on the magnitude of LOD scores. To assess statistical significance, we performed null comparisons between replicate chemostats assayed prior to selection in the chemostat. The null comparisons had LOD scores ranges of20.3 to 0.74 forn= 200 and 0.4–3.03 forn= 1000.
Analysis of variation in HXT6 and HXT7
TheHXT6andHXT7genes were amplified individually using locus-specific PCR primers from the oak and vineyard strains and cloned in plasmids. Plasmid inserts were Sanger se-quenced to catalog genetic variation between the oak and vineyard genes and used as templates for generating allele replacements. For the structure homology model, the vine-yard HXT7was modeled from PDB entry 4GBZ (Sunet al. 2012) using ModPipe (in ModBase) (Pieperet al.2014). Re-ciprocal hemizygote strains were created by first replacing the HXT6 or HXT7 locus with a construct containing the G418 resistance marker (kanMX) in the homozygous oak and vineyard parental strains (BC248 and BC241). These strains were then mated to the opposite parental strain to create heterozygous gene deletions in the hybrid back-ground. Allele replacements were created in haploid strains of the oak and vineyard genetic backgrounds [NCYC3606 and NCYC3591 (Cubilloset al.2009)]. Overlapping PCR was used to create alleles containing single-amino acid modifications. For each allele replacement,HXT6orHXT7wasfirst replaced by theURA3gene and subsequently replaced by the modified allele. These strains were then crossed to the original oak and vineyard strain (BC248 and BC241) of the same background. The mated strains were sporulated and tetrads were screened to identify diploid homothallic prototrophs (i.e., containing functional HO and URA3 genes) exhibiting sensitivity to G418 and resistance to hygromycin, indicating inheritance of the sporulation marker from the original parental strains. The genotype at the HXT7 locus was determined by Sanger se-quencing. Final allele replacement strains were also crossed to the opposite parental background to create homozygous allele replacements in the hybrid background.
Data availability
Results
Distinct genetic architectures determine growth rate and lag duration distributions between environments
We have previously shown that two wild yeast isolates, iso-lated from an oak tree (BC248, hereafter“oak”) and from a vineyard (BC241, hereafter“vineyard”) differ in exponential growth rate (hereafter“growth rate”) and lag duration (here-after“lag”) in media containing different glucose concentra-tions (Zivet al.2013b). On average, oak cells grow faster and lag for shorter amounts of time than vineyard cells, consistent with the general pattern that oak-associated strains grow better than vineyard strains in low-glucose conditions (Clowers et al.2015). The difference in the response to increasing nutri-ent concnutri-entration can be characterized by growth in two differ-ent glucose environmdiffer-ents: 0.22-mM (“growth rate-limiting”or “limiting”) and 4.44-mM (“growth rate-nonlimiting”or“ non-limiting”) glucose. To identify QTL that underlie variation in growth rate and lag, we used a panel of 374 recombinant seg-regants (Gerkeet al.2006) genotyped at 225 loci throughout the genome (Gerke et al.2009). Each segregant was pheno-typed in both growth rate-limiting and growth rate-nonlimiting glucose environments using a high-throughput microscopy-based microcolony assay (Levyet al.2012; Zivet al.2013b).
The microcolony assay enables estimation of both the central tendency and dispersion of growth rate and lag for each genotype by measuring the growth of hundreds to thousands of genetically identical microcolonies within a single well of a microtiter plate. Growth rate distributions for wild isolates in both glucose environments are approxi-mately normal and the central tendency, and dispersion, are characterized by the mean and SD, respectively. By compar-ison, lag distributions tend to be asymmetric and therefore the central tendency and dispersion are characterized by their median and MAD. Cell growth commences in,1 hr of in-oculation in nonlimiting glucose, so microcolonies do not have measurable lag times in that medium using our assay (Zivet al.2013b). As microcolonies collide prior to running out of glucose, our assay does not enable quantification of the stationary phase. Therefore, our phenotypic analysis resulted in three traits defined by central tendency and three traits defined by dispersion that are amenable to genetic mapping (Figure S1 inFile S2).
Phenotypic analysis of recombinant segregants recapitu-lated three known correlations between phenotypes (Zivet al. 2013b): (1) a strong positive correlation between median lag and lag MAD; (2) weak correlations between mean growth rate and growth rate SD; and (3) a negative correlation be-tween mean growth rate and median lag (Figure S2 inFile S2). There is also a positive correlation for mean growth rate in the limiting and nonlimiting glucose concentrations. As there are frequently relationships between the central ten-dency and dispersion of trait values, quantifying phenotypic variability requires estimates that are independent of the central tendency (Geiler-Samerotteet al.2013). Therefore, we performed loess regression of estimates of dispersion (i.e.,
SD or MAD) as a function of estimates of central tendency (i.e., mean or median) and defined the residuals of the re-gression as phenotypic variability values used for mapping purposes (Figure S1 inFile S2,Materials and Methods).
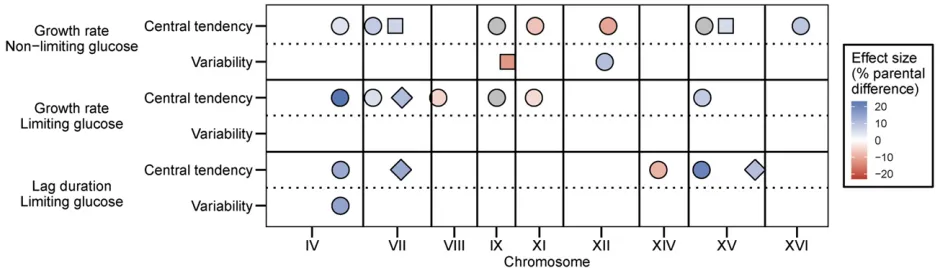
We identified QTL, defined as statistically significant as-sociations between genotypes and traits, using the R package R/qtl (Bromanet al.2003) (Materials and Methods). Wefirst searched for additive QTL and identified multiple such QTL for most traits (Figure 1 and Figure S3 inFile S2). Genotype probabilities and LOD scores were calculated at each cM po-sition (total map length is 4076 cM) and the average distance between genotyped markers is 19.4 cM (Materials and Meth-ods). Both within and between traits, QTL were considered the same locus if they were within 30 cM of one another. We determined genome-wide significance levels for each QTL scan by determining the distribution of maximum LOD scores from 10,000 permutations of the data (Churchill and Doerge 1994; Broman et al. 2003). For mean growth rate in non-limiting glucose, mean growth rate in non-limiting glucose, and median lag in limiting glucose, we found (using a genome-wide significance threshold ofa= 0.05) seven, six, andfive QTL, respectively (Figure 1). As expected based on trait cor-relations, some QTL are common between traits, but we also identified unique QTL for each trait (Figure 1 and Figure S3 and Table S1 in File S2). The amount of overlap between traits may be underestimated by eliminating loci that are close to significance. Increasing the significance threshold to 0.1 resulted in the identification of three additional loci. Although the new QTL were shared between phenotypes, each trait still retained unique loci (Figure 1). It should be noted that the overlap between correlated traits might also be overestimated due to correlated errors. The estimated effect of each QTL ranged from 4 to 23% of the difference in parental phenotypes (Figure S4 inFile S2). Alleles at QTL that increase the trait value are found in both parents for each trait (Figure 1 and Figure S4 inFile S2). We identified fewer QTL with additive effects for phenotypic variability traits: two for growth rate in nonlimiting glucose, none for growth rate in limiting glucose, and one for lag in limiting glucose (Figure 1). No additional QTL for variability traits were iden-tified when the significance threshold was increased to 0.1 (Figure 1). Two of the three additive QTL contributing to phenotypic variability were also found to underlie pheno-typic variation (Figure 1 and Table S1 in File S2). One of these two, a locus on chromosome IV, had an additive effect on four traits: mean growth rate in both glucose environ-ments as well as median lag and lag variability in limiting glucose.
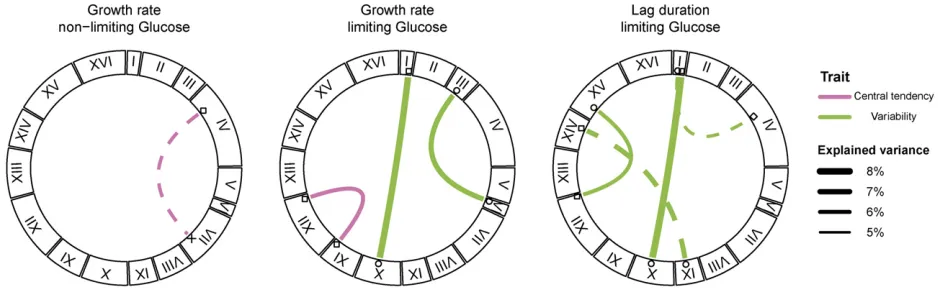
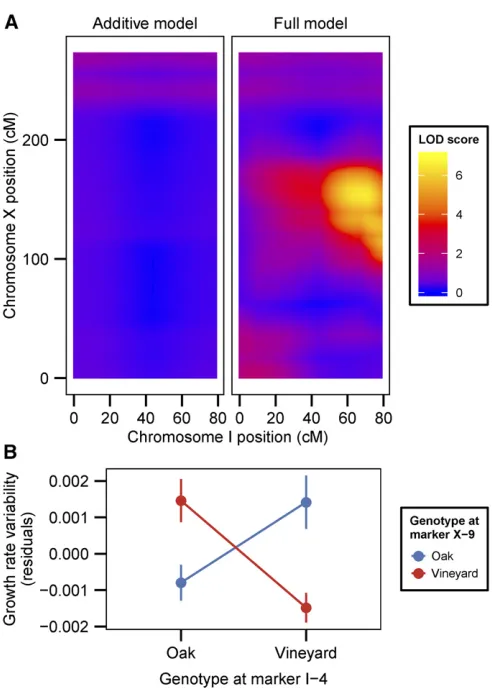
interactions for variability traits). We identified a case of sign epistasis, between a locus on chromosome I and a locus on chromosome X, that was common to two phenotypic vari-ability traits: growth rate varivari-ability and lag varivari-ability in limiting glucose (Figure 3A). In this case, oak–oak and vineyard– vineyard combinations of the two QTL result in low variabil-ity whereas both combinations of oak–vineyard QTL result in high variability (Figure 3B). This symmetrical relationship means that the QTL exhibit no additive effects across the panel of segregants. Additionally, three loci that interact to contribute to lag variability, on chromosomes IX, XII, and XV, have interactive and additive effects on other traits. The chro-mosome XII locus interacts to affect mean growth rate in the limiting glucose concentration, whereas the loci on chromo-somes IX and XV have additive effects on mean growth rate and median lag (Figure 1 and Figure 2). The effect sizes of interacting loci (given the genotype of the interaction part-ner) are comparable to the effect sizes of additive loci (Figure S4 inFile S2).
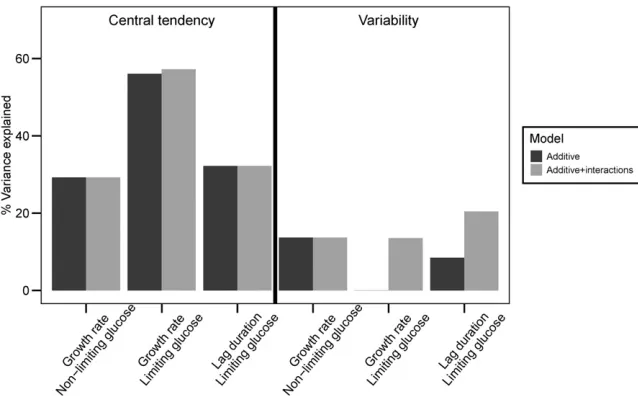
Central tendency traits differ from variability traits in the proportion of total trait variance explained by additive QTL compared with interactions. For central tendency traits, ad-ditive effects account for 29–56% of the total variance and genetic interactions only account for an additional 0–1.2% of the variance. By contrast, additive QTL effects only account for 0–14% of the variance in variability traits whereas inter-actions explain an additional 12–14% of the variance (Figure 4). It is not surprising that we explain less of the variance for variability traits overall as measuring variability is inherently noisier than measuring central tendency. Using estimates of variance between replicate wells of the parental strains, we estimated the proportion of phenotypic variance between the F2s that is genetic (Figure S1 inFile S2,Materials and Meth-ods). For central tendency traits, wefind 83, 94, and 94% of the variance for growth rate in nonlimiting glucose, growth rate in limiting glucose, and lag duration in limiting glucose is genetic. As expected, the proportions for variability traits are lower; 14, 24, and 44% of the variance is genetic for the respective conditions.
Sequencing an advanced intercross population under selection increases mapping resolution
One of the challenges of QTL mapping is resolving loci to the causative gene and variant. We sought to improve the reso-lution of QTL mapping by using a method of bulk segregant mapping in which a pooled advanced intercross population is subjected to selection for the trait of interest and sequenced to identify changes in allele frequencies (Partset al.2011). We created an advanced intercross population starting from an oak/vineyard F1 using 11 rounds of meiosis and random mating (Materials and Methods). Allele frequencies and link-age in the advanced intercross population were determined by sequencing thefinal (F12) population and isolated clones. Allele frequencies in the F12 population deviated from the expectation of 0.5 at a number of loci (Figure S5 inFile S2). A possible cause of this deviation is inadvertent selection dur-ing creation of the population. Indeed, two of the three major sporulation efficiency QTL known to segregate in this cross (Gerkeet al.2009) show strong nonrandom deviations in the F12 population (Figure S5 inFile S2). Despite inadvertent selection during generation of the advanced intercross population,.85% of SNPs still segregated with minor allele frequencies.10% throughout the genome. Linkage in the intercrossed population was decreased compared with the F2 segregants as an average of 79.6619 crossover events were identified in three F12 clones (Figure S5 inFile S2,Materials and Methods), compared to an average of 31.965.6 in the 374 F2 segregants (Materials and Methods). The increase in recombination frequency is consistent with the genetic map expansion observed in previous studies (Partset al.2011).
a low (D= 0.18 hr21) or high (D= 0.35 hr21) dilution rate. A
lower dilution rate results in a lower steady-state glucose concentration in the chemostat (Zivet al.2013a). Therefore, the high dilution rate serves as a proxy for the nonlimiting glucose environment and the low dilution rate serves as a proxy for the limiting glucose environment. To directly assess the contribution of the advanced intercross population to QTL mapping resolution, we also pooled the panel of F2 segregants and grew them in the same chemostat conditions (Materials and Methods). We collected and sequenced multi-ple sammulti-ples from each chemostat over 20–40 generations to minimize the chance of de novo mutations contributing to the selection. We determined allele frequencies using whole-genome population sequencing and identified QTL by comparing the allele frequencies between early and late time points using MULTIPOOL (Edwards and Gifford 2012) (Materials and Methods) (Figure S6 inFile S2).
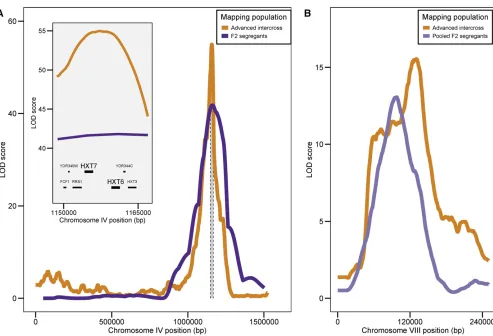
To directly compare results from the advanced intercross population with the genetic map used for interval mapping, we computed the maximal LOD score for each genomic in-terval flanked by markers used for interval mapping. We defined 209 intervals, with a median physical distance of 50 kb (range: 14–139 kb). A number of intervals with high LOD scores are common to all three QTL analyses (interval mapping of F2s, bulk segregant mapping of F2s, and bulk segregant mapping of the F12 intercross) (Figure S3 and Figure S6 and Table S3 in File S2). Among these intervals are those that contain the shared or environment-specific additive QTL for mean growth rate on chromosomes IV, VIII, and XVI. Additionally, the growth rate QTL at the left tip of chromosome VII, originally identified in both glucose concen-trations, was also found using bulk segregant approaches, but only in the low-dilution condition. A failure to identify a QTL using the advanced intercross can be explained by inadver-tent selection in the same region during creation of the ad-vanced intercross, for example, the middle of chromosome VII (Figure S5 inFile S2). However, additional regions were also missing from the analysis of the advanced intercross (but
common for the bulk segregant and interval mapping of the F2s), specifically, regions of chromosomes VII, XI, XII, and XV (Table S3 inFile S2). The small sample size for F2 segregants used for sequencing under selection could potentially con-found the analysis as nonrandom associations between true QTL and unlinked loci may result in spurious linkage signals. This is supported by the observation of regions with high LOD scores for the F2 pool not shared by the advanced intercross or the interval mapping of the F2 segregants (Table S3 inFile S2). As the differences between the interval mapping of F2s and the bulk segregant mapping of the advanced intercross may be due to technical or biological reasons, we focused on loci identified by both methods, which represent strong can-didates for loci that are important for growth in low glucose environments.
Sequence variation in HXT7 contributes to variation in growth
HXT6andHXT7encode nearly identical high-affinity glucose transporters, making them plausible candidate genes under-lying the growth rate QTL on chromosome IV.De novo am-plifications of these genes are frequently selected during experimental evolution in glucose-limited chemostats (Brown et al.1998; Greshamet al.2008; Kao and Sherlock 2008); however, whole-genome sequencing of the oak and vineyard parental strains did not identify copy number variation at this locus. As high-throughput short-read sequencing is unable to accurately resolve nucleotide variation in duplicate genes, we cloned and sequencedHXT6andHXT7from each parent (File S1, Materials and Methods). To assess the contribution of natural variation inHXT6andHXT7to variation in growth rate and lag duration, we created all possible reciprocal hemi-zygotes, in which one parental allele of HXT6 or HXT7 is knocked out, in the F1 hybrid. Hemizygosity for either
paren-talHXT6allele results in no phenotypic difference in the F1, whereas the F1 containing only the oak HXT7allele shows significant phenotypic differences from the F1 containing only the vineyardHXT7 allele, suggesting that variation in HXT7alone contributes to variation in growth (Figure S7 in
File S2).
Sequence analysis of the oak and vineyard HXT7alleles revealed 79 SNPs and 26 aa differences in the 1713-bp (571 aa) open reading frame (ORF). To test the effect of sequence variation in HXT7, we performed allele swaps in parental strains and in the F1. We created HXT7allele re-placement strains that contained no additional genetic mod-ifications except the replaced allele, which included the entire ORF and 530 bp of upstream sequence (which con-tained three SNPs and a 2-bp indel) (Materials and Methods). By considering sequence conservation and the nature of the amino acid changes, we identified a variant amino acid, T469Q, as potentially affecting protein function. This was further supported by using a protein structure model based on the crystal structure of the bacterial homolog XylE (Sun et al.2012) (Materials and Methods). The structural homol-ogy model showed the amino acid pointing into the trans-porter channel, in close proximity to amino acids known to interact with the translocating sugar molecule (Sun et al. 2012; Madej et al. 2014). To test the effect of the T469Q variant, we also created single-amino acid replacement al-leles in each genetic background.
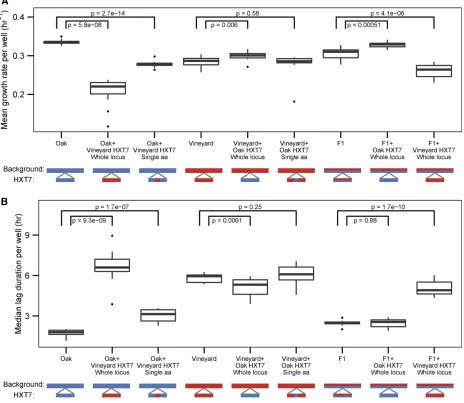
Phenotypic analyses revealed significant differences attrib-utable to allele replacements in the growth-limiting glucose concentration consistent with effects determined by linkage mapping. Namely, the oak HXT7 allele confers enhanced mean growth rate (Figure 6A) and decreased median lag (Figure 6B). Interestingly, the effect of either the oak or vine-yardHXT7allele is dependent on the genetic background. A strain containing the vineyard allele in the otherwise oak background grows slower and lags for a longer time than the vineyard parent. In contrast, the oak allele in the vineyard background caused a small but significant increase in growth rate and decrease in lag duration. Similar effects were found in the F1 background (Figure 6). This is consistent with ge-nome background effects modifying the effect of either pa-rental HXT7 allele. We found that the single-amino acid modification T469Q in the oak allele significantly reduces the growth rate of the oak parent, but has a smaller effect than replacement with the entire HXT7 vineyard allele for both mean growth rate (Figure 6A) and median lag (Figure 6B), suggesting that additional variation withinHXT7affects growth. Conversely, engineering the reciprocal Q469T mod-ification into the vineyardHXT7allele does not alter any of the growth phenotypes in a vineyard genetic background consistent with intra-allelic variation in the oakHXT7allele mediating the effect of the T469Q variant. Consistent with a smaller effect size of the QTL in the nonlimiting glucose con-centration as determined using linkage mapping, replacing the entire oakHXT7allele with the vineyardHXT7allele in the oak background is required to detect a decrease in growth Figure 3 A sign epistatic interaction underlies heritable variation in
rate in nonlimiting conditions (Figure S8A in File S2). Al-though the chromosome IV QTL containing HXT7is linked to variability in lag, we did notfind a significant effect on lag variability in allele-swapped strains (Figure S8B inFile S2). However, this is likely due to the small number of strains used in the regression to estimate median-independent lag vari-ability, which reduces our power to detect a statistically sig-nificant difference (Levy and Siegal 2008).
Although we have not found evidence for adaptive evolu-tion at theHXT7locus in natural populations, it is noteworthy thatHXT7is a recurrent target of selection in long-term ex-perimental evolution in glucose-limited environments. Copy number variation containingHXT6/HXT7, but not nucleotide variation, has been reported in multiple experimental evolu-tion studies (Brownet al.1998; Greshamet al.2008; Kao and Sherlock 2008; Koschwanez et al. 2013; Selmecki et al. 2015). To study the effect of anHXT6/HXT7amplification on glucose-dependent growth, we measured growth rates of an evolved clone in whichHXT6/HXT7is amplified. (Gresham et al. 2008) at different glucose concentrations using the microcolony assay. Wefind that aHXT6/HXT7amplification has a growth-rate advantage only at the limiting glucose con-centration but results in decreased growth rate at higher glucose concentrations (Figure S9 inFile S2), consistent with antagonistic pleiotropy. By contrast, the naturally occurring HXT7allele in the oak strain is beneficial in both limiting and nonlimiting glucose environments.
Discussion
The field of quantitative genetics was established nearly 100 years ago, reconciling the inheritance of continuously distributed traits with Mendelian genetics (Nelson et al. 2013b). Large-scale genetic mapping of quantitative traits first became feasible following the utilization of molecular polymorphisms as genetic markers (Botsteinet al.1980) and development of analytical methods (Lander and Botstein 1989). Recently, with increased sample sizes and resources,
genetic mapping studies are detecting more QTL but also uncovering surprising complexity, including gene-by-environment interactions, epistasis, and linkage between causative loci (Mackayet al.2009). The results of our study serve to em-phasize the prevalence of these characteristics even when considering closely related traits and environments. Further-more, we show that genetic interactions and gene-by-envi-ronment interactions underlie variation in both the central tendency and variability of traits.
Gene-by-environment interactions are a result of genetic loci that have different effects on phenotypic variance in different conditions. Gene-by-environment interactions are frequently found in QTL studies, and in one study were shown to affect the expression of a third of yeast genes (Smith and Kruglyak 2008). Wefind both shared loci with different effect sizes as well as environment-specific loci and genetic interac-tions when quantifying cell growth in two environments that differ in glucose concentration 20-fold. Measuring changes in QTL effect sizes over afiner gradient of glucose concentration may be informative, analogous to dose-dependent effects ob-served for chemical resistance (Wang and Kruglyak 2014). For example, the contribution ofHXT7to growth rate varia-tion might indicate the extent of control that the nutrient transport step has on growth rate, potentially relating the transporter Kmto the Monod constants (Ks) of the oak and
vineyard strains (Zivet al.2013b). Wefind that natural var-iation in HXT7 does not exhibit antagonistic pleiotropy, whereas amplification ofHXT7, which is repeatedly observed in experimental evolution studies, confers a cost at higher glucose concentrations. Identification of a target of selection in laboratory evolution experiments that also shows causa-tive natural variation suggests that experimental evolution serves as an important window into evolutionary adaptation in nature. Contrasting the outcomes between experimental evolution in the lab and natural variation may prove fruitful for understanding the causes and consequences of short-term adaptation on allelic variation, as compared with long evolu-tionary histories.
Recently, there has been increased interest in searching for so-called variance QTL (vQTL), by analyzing the difference in variance between genotypic classes, instead of the differ-ence in means (Ronnegard and Valdar 2011; Shenet al.2012; Yadavet al.2016). vQTL are not the same as variability QTL, because for vQTL the relevant variance is computed across strains (specifically those strains with a particular allele at a particular locus). Therefore, vQTL analyses are unlikely to uncover loci that affect within-strain variance (variability), and instead they uncover loci with alleles that suppress or enhance the mean effects of genetic differences at other loci (Nelsonet al.2013a; Yadavet al.2016). When clonal data and repeated measurements of different individuals with the same genotype are available, phenotypic variability can be directly estimated and mapped as a quantitative trait. Alleles determining variability segregate in natural populations and have been mapped in yeast (Anselet al.2008),flies (Mackay and Lyman 2005; Ayroles et al. 2015), plants (Hall et al. 2007; Jimenez-Gomez et al. 2011), and mice (Fraser and Schadt 2010). To our knowledge, our study is thefirst tofind genetic interactions determining phenotypic variability.
Moreover, wefind that genetic interactions make up a larger proportion of explained trait variance for variability traits compared to traits of central tendency. This is consistent with the observation that phenotypic stabilizers (genes that in-crease phenotypic variability when absent or impaired) tend to be interaction hubs (Levy and Siegal 2008; Bauer et al. 2015). In particular, stabilizers are characterized by many synthetic lethal genetic interactions (Levy and Siegal 2008). However, these studies have also shown that single-gene mutations can affect phenotypic variability. It is tempt-ing to think that, in our study, the parental strains have evolved to have low variability and the combination of dis-parate alleles leads to higher variability. This is supported by the effects of some but not all of the identified genetic interactions, including a sign epistatic interaction in which the interaction between two loci results in high phenotypic variability when the alleles are inherited from different parents and low variability when the alleles are from the same parent. It will be interesting to see if this observation will generalize to variability in different phenotypes and systems.
Our study highlights the advantage of using different mapping approaches to dissect the genetic basis of complex traits. Although individual segregant analysis has the advan-tage of detecting genetic interactions, the increased resolution of our bulk segregant approach was remarkable. The in-creased resolution is due to both use of an advanced intercross population and the increased sampling due to bulk segregant analysis. Importantly, our implementation of bulk segregant analysis did not require extensive parental-strain construc-tion. Although previous studies used genetically engineered strains (Ehrenreichet al.2010; Cubilloset al.2013), we cre-ated our advanced intercross population using homothallic diploid strains without the need for auxotrophic or drug re-sistance markers. This approach should be readily adaptable to other strains and related species, enabling bulk segregant approaches without extensive strain manipulation.
We confirmed the effect of sequence variation inHXT7on variation in growth rate and lag duration. However, we iden-tified important distinctions between the segregant analysis and the allele replacements. Specifically, the differential ef-fect of the allele depending on the genetic background indi-cates the presence of additional genetic interactions not identified by our two-dimensional scan. These effects might reflect higher order interactions involving more than two loci (Taylor and Ehrenreich 2014). Alternatively, they might be the result of an accumulation of undetected pairwise interac-tions. Although we did not find significant interactions in-volving the chromosome IV QTL position for mean growth rate and median lag duration, the estimated effect of the locus was consistently smaller in the vineyard background when considering the genotype at other additive loci, partic-ularly in the higher glucose concentration.
Figure 6 Background-dependent effects onHXT7contribute to cell growth rate variation. Distributions of (A) mean growth rate and (B) median lag duration for allele replacement strains grown in limiting glucose.P-values are for two samplet-tests (n= 12 for each analyzed strain). The diploid strain genotype and the genotype at theHXT7locus are of either oak (blue) or vineyard (red) parental origin. Single-amino acid allele replacements within
Our study emphasizes the inherent challenges of accu-rately predicting phenotype from genotype. It is necessary to account for genetic interactions, environmental variation, and phenotypic variability, as the estimated marginal additive effect of an allele may not reflect the actual effect in any specific genetic background.
Acknowledgments
We thank members of the Gresham and Siegal laboratories, as well as Matt Rockman, Fred Cross, and Gloria Corruzi, for feedback and helpful comments. We thank the Genomics Core Facility at NYU CGSB for Illumina sequencing, Barak Cohen for providing yeast strains, and Evan Baugh for assistance with homology structural modeling. This work was supported by National Institutes of Health grants R01GM086673, R01GM097415, R35GM118170 (to M.L.S.) and R01GM1007466 (to D.G.), and National Science Foun-dation grant MCB1244219 (to D.G.).
Literature Cited
Ansel, J., H. Bottin, C. Rodriguez-Beltran, C. Damon, M. Nagarajan
et al., 2008 Cell-to-cell stochastic variation in gene expression is a complex genetic trait.PLoS Genet.4: e1000049.
Ayroles, J. F., S. M. Buchanan, C. O’Leary, K. Skutt-Kakaria, J. K. Grenier et al., 2015 Behavioral idiosyncrasy reveals genetic control of phenotypic variability. Proc. Natl. Acad. Sci. USA 112: 6706–6711.
Bauer, C. R., S. Li, and M. L. Siegal, 2015 Essential gene disrup-tions reveal complex reladisrup-tionships between phenotypic robust-ness, pleiotropy, andfitness. Mol. Syst. Biol. 11: 773.
Blomberg, A., 2011 Measuring growth rate in high-throughput growth phenotyping. Curr. Opin. Biotechnol. 22: 94–102. Bloom, J. S., I. M. Ehrenreich, W. T. Loo, T.-L. V. Lite, and L.
Kruglyak, 2013 Finding the sources of missing heritability in a yeast cross. Nature 494: 234–237.
Botstein, D., R. L. White, M. Skolnick, and R. W. Davis, 1980 Construction of a genetic linkage map in man using re-striction fragment length polymorphisms. Am. J. Hum. Genet. 32: 314–331.
Brauer, M. J., A. J. Saldanha, K. Dolinski, and D. Botstein, 2005 Homeostatic adjustment and metabolic remodeling in glucose-limited yeast cultures. Mol. Biol. Cell 16: 2503–2517. Broman, K. W., H. Wu, S. Sen, and G. A. Churchill, 2003 R/qtl:
QTL mapping in experimental crosses. Bioinformatics 19: 889– 890.
Brown, C. J., K. M. Todd, and R. F. Rosenzweig, 1998 Multiple duplications of yeast hexose transport genes in response to se-lection in a glucose-limited environment. Mol. Biol. Evol. 15: 931–942.
Carlborg, Ö., and C. S. Haley, 2004 Opinion: epistasis: too often neglected in complex trait studies? Nat. Rev. Genet. 5: 618–625. Churchill, G. A., and R. W. Doerge, 1994 Empirical threshold values for quantitative trait mapping. Genetics 138: 963–971. Clowers, K. J., J. Heilberger, J. S. Piotrowski, J. L. Will, and A. P.
Gasch, 2015 Ecological and genetic barriers differentiate nat-ural populations ofSaccharomyces cerevisiae. Mol. Biol. Evol. 32: 2317–2327.
Cubillos, F. A., E. J. Louis, and G. Liti, 2009 Generation of a large set of genetically tractable haploid and diploid Saccharomyces strains. FEMS Yeast Res. 9: 1217–1225.
Cubillos, F. A., E. Billi, E. Zörgö, L. Parts, P. Fargier et al., 2011 Assessing the complex architecture of polygenic traits in diverged yeast populations. Mol. Ecol. 20: 1401–1413. Cubillos, F. A., L. Parts, F. Salinas, A. Bergstrom, E. Scovacricchi
et al., 2013 High-resolution mapping of complex traits with a four-parent advanced intercross yeast population. Genetics 195: 1141–1155.
Darvasi, A., and M. Soller, 1995 Advanced intercross lines, an experimental population for fine genetic mapping. Genetics 141: 1199–1207.
Doerge, R. W., 2002 Multifactorial genetics: mapping and analy-sis of quantitative trait loci in experimental populations. Nat. Rev. Genet. 3: 43–52.
Edwards, M. D., and D. K. Gifford, 2012 High-resolution genetic mapping with pooled sequencing. BMC Bioinformatics 13 (Suppl. 6): S8.
Ehrenreich, I. M., N. Torabi, Y. Jia, J. Kent, S. Martis et al., 2010 Dissection of genetically complex traits with extremely large pools of yeast segregants. Nature 464: 1039–1042. Fraser, H. B., and E. E. Schadt, 2010 The quantitative genetics of
phenotypic robustness.PLoS One5: e8635.
Geiler-Samerotte, K., C. Bauer, S. Li, N. Ziv, D. Gresham et al., 2013 The details in the distributions: why and how to study phenotypic variability. Curr. Opin. Biotechnol. 24: 752–759. Gerke, J. P., C. T. L. Chen, and B. A. Cohen, 2006 Natural isolates
of Saccharomyces cerevisiae display complex genetic variation in sporulation efficiency. Genetics 174: 985–997.
Gerke, J., K. Lorenz, and B. Cohen, 2009 Genetic interactions between transcription factors cause natural variation in yeast. Science 323: 498–501.
Gresham, D., M. M. Desai, C. M. Tucker, H. T. Jenq, D. A. Paiet al., 2008 The repertoire and dynamics of evolutionary adaptations to controlled nutrient-limited environments in yeast.PLoS Genet.4: e1000303.
Hall, M. C., I. Dworkin, M. C. Ungerer, and M. Purugganan, 2007 Genetics of microenvironmental canalization in Arabi-dopsis thaliana. Proc. Natl. Acad. Sci. USA 104: 13717–13722. Illingworth, C. J. R., L. Parts, A. Bergström, G. Liti, and V. Mustonen, 2013 Inferring genome-wide recombination landscapes from advanced intercross lines: application to yeast crosses.PLoS One8: e62266.
Jimenez-Gomez, J. M., J. A. Corwin, B. Joseph, J. N. Maloof, and D. J. Kliebenstein, 2011 Genomic analysis of QTLs and genes altering natural variation in stochastic noise. PLoS Genet. 7: e1002295.
Kao, K. C., and G. Sherlock, 2008 Molecular characterization of clonal interference during adaptive evolution in asexual pop-ulations of Saccharomyces cerevisiae. Nat. Genet. 40: 1499– 1504.
Koschwanez, J. H., K. R. Foster, and A. W. Murray, 2013 Improved use of a public good selects for the evolution of undifferentiated multicellularity. Elife 2: e00367.
Lander, E. S., and D. Botstein, 1989 Mapping mendelian factors underlying quantitative traits using RFLP linkage maps. Genet-ics 121: 185–199.
Levy, S. F., and M. L. Siegal, 2008 Network hubs buffer environ-mental variation in Saccharomyces cerevisiae. PLoS Biol. 6: e264.
Levy, S. F., N. Ziv, and M. L. Siegal, 2012 Bet hedging in yeast by heterogeneous, age-correlated expression of a stress protectant.
PLoS Biol.10: e1001325.
Li, H., and R. Durbin, 2009 Fast and accurate short read align-ment with Burrows-Wheeler transform. Bioinformatics 25: 1754–1760.
Liti, G., and E. J. Louis, 2012 Advances in quantitative trait anal-ysis in yeast.PLoS Genet.8: e1002912.
Mackay, T. F. C., and R. F. Lyman, 2005 Drosophila bristles and the nature of quantitative genetic variation. Philos. Trans. R. Soc. Lond. B Biol. Sci. 360: 1513–1527.
Mackay, T. F. C., E. A. Stone, and J. F. Ayroles, 2009 The genetics of quantitative traits: challenges and prospects. Nat. Rev. Genet. 10: 565–577.
Madej, M. G., L. Sun, N. Yan, and H. R. Kaback, 2014 Functional architecture of MFS D-glucose transporters. Proc. Natl. Acad. Sci. USA 111: E719–E727.
Michelmore, R. W., I. Paran, and R. V. Kesseli, 1991 Identification of markers linked to disease-resistance genes by bulked segre-gant analysis: a rapid method to detect markers in specific ge-nomic regions by using segregating populations. Proc. Natl. Acad. Sci. USA 88: 9828–9832.
Monod, J., 1949 The growth of bacterial cultures. Annu. Rev. Microbiol. 3: 371–394.
Nelson, R. M., M. E. Pettersson, X. Li, and Ã. Carlborg, 2013a Variance heterogeneity in Saccharomyces cerevisiae ex-pression data: trans-regulation and epistasis.PLoS One8: e79507. Nelson, R. M., M. E. Pettersson, and Ö. Carlborg, 2013b A century after Fisher: time for a new paradigm in quantitative genetics. Trends Genet. 29: 669–676.
Parts, L., F. A. Cubillos, J. Warringer, K. Jain, F. Salinas et al., 2011 Revealing the genetic structure of a trait by sequencing a population under selection. Genome Res. 21: 1131–1138. Pelkmans, L., 2012 Using cell-to-cell variability–a new era in
mo-lecular biology. Science 336: 425–426.
Pieper, U., B. M. Webb, G. Q. Dong, D. Schneidman-Duhovny, H. Fanet al., 2014 ModBase, a database of annotated compara-tive protein structure models and associated resources. Nucleic Acids Res. 42: D336–D346.
Robinson, M. R., N. R. Wray, and P. M. Visscher, 2014 Explaining additional genetic variation in complex traits. Trends Genet. 30: 124–132.
Ronnegard, L., and W. Valdar, 2011 Detecting major genetic loci controlling phenotypic variability in experimental crosses. Ge-netics 188: 435–447.
Saldanha, A. J., M. J. Brauer, and D. Botstein, 2004 Nutritional homeostasis in batch and steady-state culture of yeast. Mol. Biol. Cell 15: 4089–4104.
Selmecki, A. M., Y. E. Maruvka, P. A. Richmond, M. Guillet, N. Shoreshet al., 2015 Polyploidy can drive rapid adaptation in yeast. Nature 519: 349–352.
Shen, X., M. Pettersson, L. Rönnegård, and Ö. Carlborg, 2012 Inheritance beyond plain heritability: variance-controlling genes in Arabidopsis thaliana.PLoS Genet.8: e1002839. Smith, E. N., and L. Kruglyak, 2008 Gene–environment
interac-tion in yeast gene expression.PLoS Biol.6: e83.
Steinmetz, L. M., H. Sinha, D. R. Richards, J. I. Spiegelman, P. J. Oefneret al., 2002 Dissecting the architecture of a quantitative trait locus in yeast. Nature 416: 326–330.
Sun, L., X. Zeng, C. Yan, X. Sun, X. Gong et al., 2012 Crystal structure of a bacterial homologue of glucose transporters GLUT1–4. Nature 490: 361–366.
Swinnen, S., K. Schaerlaekens, T. Pais, J. Claesen, G. Hubmann
et al., 2012 Identification of novel causative genes determin-ing the complex trait of high ethanol tolerance in yeast usdetermin-ing pooled-segregant whole-genome sequence analysis. Genome Res. 22: 975–984.
Taylor, M. B., and I. M. Ehrenreich, 2014 Genetic interactions involving five or more genes contribute to a complex trait in yeast.PLoS Genet.10: e1004324.
R Development Core Team, 2012 R: A Language and Environment for Statistical Computing. R Foundation for Statistical Comput-ing, Vienna, Austria.
Wang, X., and L. Kruglyak, 2014 Genetic basis of haloperidol re-sistance in Saccharomyces cerevisiae is complex and dose de-pendent.PLoS Genet.10: e1004894.
Wilkening, S., G. Lin, E. S. Fritsch, M. M. Tekkedil, S. Anderset al., 2014 An evaluation of high-throughput approaches to QTL mapping in Saccharomyces cerevisiae. Genetics 196: 853– 865.
Yadav, A., K. Dhole, and H. Sinha, 2016 Differential regulation of cryptic genetic variation shapes the genetic interactome underlying complex traits. Genome Biol. Evol. 8: 3559–3573. Yang, J., R. J. F. Loos, J. E. Powell, S. E. Medland, E. K. Speliotes
et al., 2012 FTO genotype is associated with phenotypic vari-ability of body mass index. Nature 490: 267–272.
Yvert, G., 2014 “Particle genetics”: treating every cell as unique. Trends Genet. 30: 49–56.
Ziv, N., N. J. Brandt, and D. Gresham, 2013a The use of chemo-stats in microbial systems biology. J. Vis. Exp. 80: 50168. Ziv, N., M. L. Siegal, and D. Gresham, 2013b Genetic and
nongenetic determinants of cell growth variation assessed by high-throughput microscopy. Mol. Biol. Evol. 30: 2568– 2578.