18th International Conference on Structural Mechanics in Reactor Technology (SMiRT 18) Beijing, China, August 7-12, 2005 SMiRT18-S01-5
INTEGRATED DESIGN APPROACH OF THE PEBBLE BE
D
MODULAR USING MODELS
Pieter J Venter
Pebble Bed Modular Reactor (Pty) Ltd;
P.O.Box 9396
Centurion
0046
Republic of South Africa
Phone: +27 12 677 9400, Fax: +27 12 663 3053
E-mail:
[email protected]
ABSTRACT
The Pebble Bed Modular Reactor (PBMR) is the first pebble bed reactor that will be utilised in a high temperature direct Brayton cycle configuration. This implies that there are a number of unique features in the PBMR that extend from the German experience base. One of the challenges in the design of the PBMR is managing the integrated design process between the designers, the physicists and the analysts.
This integrated design process is managed through model-based development work. Three-dimensional CAD models are constructed of the components and parts in the reactor. From the CAD models, CFD models, neutronic models, shielding models, FEM models and other thermodynamic models are derived. These models range from very simple models to extremely detailed and complex models. The models are used in legacy software as well as commercial off-the-shelf software. The different models are also used in code-to-code comparisons to verify the results.
This paper will briefly discuss the different models and the interaction between the models, showing the iterative design process that is used in the development of the reactor at PBMR.
Keywords: PBMR, models, FEM, CFD, CAD
1. INTRODUCTION
Reactor Unit
Recuperators
Compressors
Turbine
Intercooler Pre-cooler
Gearbox
Generator
Figure 1: Main Power System of PBMR
Analyses and simulation of the behaviour of the reactor in this direct cycle rely on an integrated modelling approach (Figure 2) that comprises geometric, neutronic, thermohydraulic, and structural models.
Geometric Models
Neutronic Models
Thermohydraulic Models
Structural Models Geometry
Fluences, heating
Fluences
Temperatures, Pressures
Stresses, displacements Temperatures
Geometry Geometry
Figure 2: Integrated Reactor Modelling Approach
The geometric models define the geometry to be used in all the other models. This has the advantage of being a single source for the geometry definition, thereby ensuring that whenever a new model is established, it is built using the latest geometry. The geometric models also define the material usage. From the material usage the appropriate material models can be identified to predict the material behaviour in the reactor environment.
The neutronic models simulate the neutronic behaviour of the reactor and provide fluence and heating data for the thermodynamic and structural models. Since the neutronic behaviour is strongly dependant on the temperature feedback in the core, temperatures are provided by thermohydraulic models.
structural models. The structural models assess the structural integrity of the design and are used by the designers to make changes to the geometry models as necessary. The updated geometry models trigger updates to the other models as applicable and the whole process is repeated.
2. GEOMETRIC MODELS
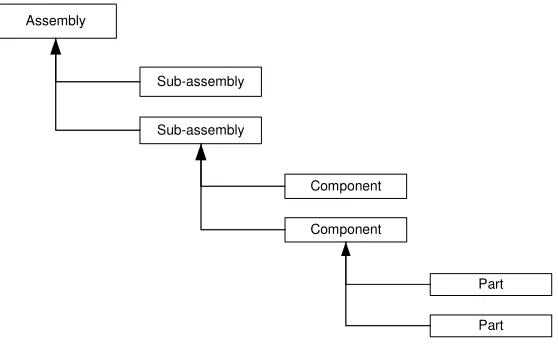
The geometry of the reactor is defined by constructing a three dimensional CAD model of the complete reactor with all the assemblies, sub-assemblies, components and parts in the correct location in the building. This model is constructed using a hierarchical bottom-up approach whereby the smallest individual parts are modelled according to the designer’s specification, then assembled into components, the components are assembled into sub-assemblies and the sub-assemblies are assembled into higher level assemblies as shown in Figure 3. These CAD models of the parts are constructed as solids in Unigraphics NX (http://www.ugs.com/products/nx).
Assembly
Sub-assembly
Sub-assembly
Component
Component
Part
Part
Figure 3: Hierarchy Tree of the CAD Model
Full revision control of the model is applied through a change control process in the product data management system where all the electronic CAD data is stored. This has the advantage that everyone working on the reactor is always aware of what the latest released geometric definition of the reactor is.
The CAD models gives PBMR the ability to easily extract accurate geometric information such as volumes, masses and moments of inertia of the different components or parts. This CAD model can be directly exported to many of the analysis software through CAD data exchange formats such as Parasolid for further analysis.
The CAD model is further used for interface design and control by running interference checks between different assemblies. This gives PBMR the ability to eliminate routing and interference problems that would have only become visible during construction. The CAD model further aids in planning access routes by placing servitudes around features that must be accessible, thereby checking that sufficient space is available for the intended operation.
Drawings for suppliers can be drawn up from this CAD solid model by viewing or cutting the model in different planes and extracting the intersecting lines. Drawings can thereafter be automatically updated when the solid model changes. This method of constructing drawings reduces the time needed to prepare drawing datapacks.
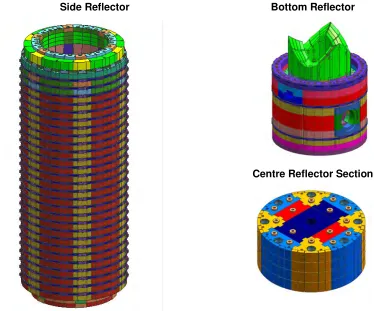
Bottom Reflector Side Reflector
Centre Reflector Section
Figure 4: Examples of the CAD Model of Some of the Graphite Components
3. NEUTRONIC MODELS
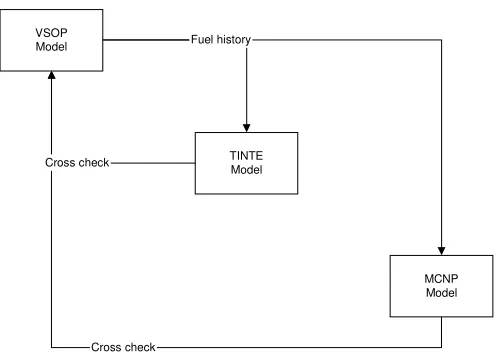
VSOP Model
TINTE Model
MCNP Model
Cross check
Fuel history
Cross check
Figure 5: Neutronic Model Interactions
3.1 VSOP Model
VSOP99 (Rütten, 2000) is a computer code system for the comprehensive numerical simulation of the physics of thermal reactors. It entails the set up of the reactor geometry and materials, as well as the fuel data. The analysis is started by the neutron spectrum evaluation and neutron diffusion calculations in two or three dimensions. This is followed by the fuel burn-up and fuel shuffling calculation with inputs from the reactor control and thermohydraulic models as shown in Figure 6.
The code can simulate the reactor operation from the initial core to the equilibrium core. The code system contains some important features required for pebble bed reactor analysis, such as treatment of double heterogeneous fuel, the different fuelling mode simulations, and two-dimensional (2D) thermal hydraulic capabilities including the pebble bed.
The reactor simulation comprises a series of iterations between calculating the flux and burn-up followed by fuel shuffling (through the core) steps. In this way, the effect of pebble flow is simulated. Through the use of pebble flow-lines, the effect of axially variable pebble flow velocities and varying pebble flow paths is included in the calculation. VSOP allows for this step-wise calculation process to continue until equilibrium is reached, i.e. the results for each burn-up period are reproduced identically. The cycle achieved at this stage is accordingly termed the ‘equilibrium cycle’. This cycle is characteristic of the biggest part of the reactor’s life.
Nuclear Data Fuel
Element Data Core Design
Resonance Integrals
Control Calcs Thermal Hydraulics (2-D)
Fuel Management Cost
Fuel Cycle Cost Burnup, Load Following,
Xenon
Ba s is for in -de p th Re s ea r c h:
TIN TE: -- D y na mi c S t udi e s
VSO P
:-- 2 :--D Tra ns po rt C a lc s - 2 -D Con trol Que s tion s - 3 -D Re a c tiv i ty Que s ti ons - F ue l El e me nt Lo ad s - W a s te C a l cu la tion s
Input Data -Organisation Restart Library Core Status Cost Library Neutron Diffusion (3-D) Neutron Spectrum
Figure 6: VSOP Code Flow
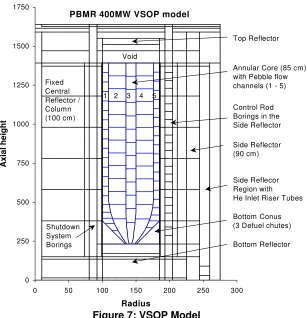
PBMR 400MW VSOP model
0 250 500 750 1000 1250 1500 1750
0 50 100 150 200 250 300
Radius A x ia l h e ig h t Void Shutdown System Borings Control Rod Borings in the Side Reflector Annular Core (85 cm) with Pebble flow channels (1 - 5) Fixed Central Reflector / Column (100 cm) Side Reflector (90 cm) Bottom Reflector Top Reflector
1 2 3 4 5
Side Reflecor Region with He Inlet Riser Tubes
Bottom Conus (3 Defuel chutes)
The VSOP model is mainly used to calculate the core neutronic conditions of the burn-in core as well as the equilibrium core and to illustrate compliance to the core neutronic design criteria. This is necessary from a design perspective to make sure that all the design objectives are met by the design. Where the criteria are not met, a design change is necessary.
The neutronic conditions obtained are used in various other analyses. From this neutronic data, the neutron distribution through the reactor can be obtained as flux profiles. The flux profile is used by the thermodynamic and structural models to calculate the effect of neutron fluence on the material properties, especially the graphite of the reflectors.
The fuel movement through the reactor shows the fuel depletion in a multi-pass reload configuration, including discharge burnup. This information, known as the fuel history, is used as input for the other neutronic models. The model further provides the power distribution including power per fuel sphere per pass in each of the modelled fuel flow channels (Figure 8). This is used as input by the thermodynamic models to model the heat deposition in the reactor.
The reactivity control and shutdown systems’ worths are also calculated. This is used to calculate the shutdown margin and neutronic response of the reactor due to control actions. The reactivity coefficients of the fuel, moderator and reflectors are also determined and together with the temperatures of these regions are used to calculate the reactivity response during normal operation and accident conditions.
0 200 400 600 800 1000 1200
0 0.5 1 1.5 2 2.5 3 3.5
Channel 1 m ulti-pas s r e lative pow e r s
A x ia l h e ig h t (t o p t o b o tt o m ) [c m ] Average Pas s 1 Pas s 2 Pas s 3 Pas s 4 Pas s 5 Pas s 6
0 200 400 600 800 1000 1200
0 0.5 1 1.5 2 2.5
Relative power density
A x ia l h e ig ht ( top t o bot to m ) [c m ] Channel 1 Channel 2 Channel 3 Channel 4 Channel 5
Figure 8: VSOP Axial Power Profiles Showing the Average per Channel (left) and the Average per Pass in Channel 1 (right)
3.2 TINTE Model
The TINTE (Time Dependent Neutronics and Temperatures) code (Gerwin, 1989) [MNM1]was developed by KFA (Kernforschungsanlage) – now known as Forschungszentrum Jülich in Germany– to investigate the nuclear and thermal transient behaviour of high temperature reactors, with full neutron, temperature and xenon feedback effects taken into account in two-dimensional (r-Z) geometry. TINTE is one of few HTGR codes worldwide that can perform time-dependent coupled neutronic, thermohydraulic and chemical interactions, for example: air/water ingress into an operating reactor.
The TINTE model uses the spatial distribution of isotopes and fuel history from the VSOP equilibrium core data as input.
nuclear behaviour. The TINTE model has the advantage of being able to handle these feedback effects over such very large range of time constants. The model incorporates numerous material property correlations for graphite and other core structures including the temperature and fast-fluence dependence of the pebble bed effective thermal conductivity.
In PBMR, the TINTE model is mainly used to model time-dependent transient events for both normal operation and accidents. The TINTE model captures the reactivity effects, Xenon dynamics, power excursions, decay-heat production and removal, temperature transients and gas convection phenomena. The normal operation events range from normal steady state power operation to load following manoeuvres with control using inventory control (pressure control) as well as control rods. The accident events range from slow transients (e.g. a depressurized loss of forced cooling event over 24 hours, Xenon oscillations over a few days) to fast transients (control rod ejection over one second).
The typical results from the TINTE analyses include flux profiles, power profiles, fuel burnup and discharge burnup, fuel, moderator and reflector temperatures, fuel and reflector fluences, Xenon concentrations and transients.
The TINTE results are also used in cross checking the VSOP results such as power profiles, flux profiles and component temperatures. Reactor response from control rod movements is also cross-checked with results from the Flownex point kinetics model results.
3.3 MCNP Model
The MCNP code (http://laws.lanl.gov/x5/MCNP) is a general purpose Monte Carlo N-Particle code that can be used for neutron, photon, electron, or coupled neutron/photon/electron transport, including the capability to calculate eigenvalues for critical systems. The code is widely used in the nuclear industry and is extensively and continuously verified and validated. Two of its main advantages are related with its capability of treating an arbitrary three-dimensional configuration, as well as using point-wise energy-dependent cross-section data. Thus, two of the main reasons to make use of approximations in deterministic transport codes (i.e. spatial and energy discretization) became unnecessary with MCNP. This, in turn, makes MCNP suitable for generating reference results against which the results given by deterministic codes are compared. Furthermore, all reactions given in a particular cross-section evaluation are accounted for.
The MCNP model is a full 3D model of all the components within the core barrel envelope, including fuel spheres with explicit fuel kernel modelling (Figure 9). This model is setup from the 3D CAD model with all the necessary geometric detail included (Figure 10). This detail includes the control rods, graphite reflectors with all the borings and gas flow channels and the three fuelling and three defuelling chutes with defuelling cones.
This model gives PBMR the ability to investigate the effect of design detail in 3D and to compare the results to the 2D VSOP and TINTE models. These comparisons are typically reactivity balances (for instance: multiplication factors, control rod worths, flux and power distribution, energy deposition in the reflector) in the core and the resultant neutron and photon flux profiles. From these comparisons one can then judge whether a specific design feature can be approximated or whether it should be modelled fully.
Figure 9: MCNP Modelling of the Fuel Sphere Showing the Fuel Kernels (left) and the Packing of the Fuel Spheres (right)
Figure 10: MCNP Model of the Core
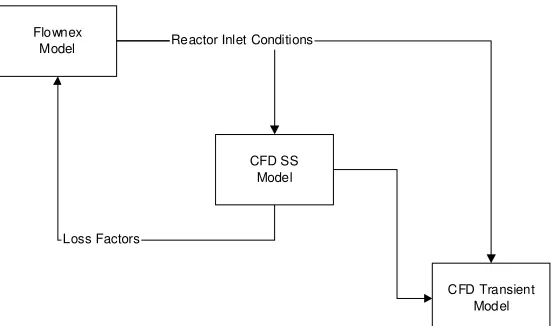
4. THERMOHYDRAULIC MODELS
Flownex Model
CFD SS Model
CFD Transient Model Loss Factors
Reactor Inlet Conditions
Figure 11: Thermohydraulic Model Interaction
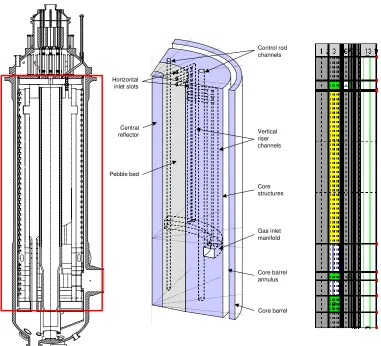
4.1 Flownex Model
Flownex (http://www.flownex.com/) is a general purpose thermal-fluid network analysis code, i.e. an integrated system based CFD analysis code based on a network approach. It solves the flow, pressure and temperature distribution in large unstructured thermal-fluid networks and provides the designer with essential information on the interaction between network components and the behaviour of complex systems.
In PBMR the Flownex model allows for an integrated analysis of the reactor in the MPS network. The Flownex model of the reactor consists of a point kinetics neutronic model and all the gas flow paths necessary to give an accurate representation of the reactor behaviour. The parameters for the point kinetics model are obtained from the VSOP model and the transient response is verified against the TINTE model. The Flownex model also includes a control algorithm that represents the reactor controller. The reactor controller controls the movement of the control rods. These movements are modelled as changes in the external reactivity. The Flownex model can either represent just the pebble bed (for fast thermal transients) or the full reactor with the reflector graphite, core barrel and reactor pressure vessel (for slow thermal transients).
Horizontal inlet slots
Control rod channels
Central reflector
Pebble bed
Vertical riser channels
Core barrel annulus
Core barrel Gas inlet manifold Core structures
Figure 12: Flownex Model of the Reactor Showing the Geometry (left), the Features Modelled (middle) and the Flownex Representation (right)
4.2 CFD Model
Computational Fluid Dynamics (CFD) are used at PBMR to model the reactor in as much detail as possible to see the effect of detail features on the expected temperatures and pressures. The software packages used are Star-CD (http://www.cd-adapco.com/products/starsolver.htm) and Fluent (http://www.fluent.com/). All the material properties necessary are modelled as functions of temperature, pressure and fluence where applicable. The pebble bed is modelled as a porous medium with the characteristics of a packed bed of fuel spheres. User coding has been developed that models the individual pebble behaviour in this porous medium. The heat input for the models are derived from the neutron and photon energy deposition output from the MCNP model.
Four different types of CFD reactor models (Figure 13) are constructed from the CAD models for various applications. The models range from a very detailed 60° section steady state model to a 180° section steady state model with less internal detail and from a detailed 5° section transient model to a full 360° transient model up to the reactor pressure vessel with less internal detail.
Figure 13: Different CFD Models for Steady State and Transient Analyses
5. STRUCTURAL MODELS
The structural analysis models are used to assess the structural integrity of the reactor. This structural integrity is assessed for normal operating conditions to ensure the lifetime of the reactor as well as the accident conditions to ensure the safety of the reactor. The structural models are split into two types of models, the FEM models that are used in the structural integrity assessment and the PFC3D models that are used to assess the loads due to the pebble bed.
5.1 FEM Models
Finite Element Method (FEM) models are used to assess the structural integrity of the components in the reactor. The software packages that are used include MSC Nastran (http://www.mscsoftware.com) and MSC Marc (http://www.mscsoftware.com) for non-linear analyses such as contact analyses.
the CAD model. Additional loads such as the neutron fluence (from VSOP), pressure (from CFD), silo load (from PFC3D) and dead weight (from CAD) can also be applied to assess the integrity and lifetime of the block.
Figure 14: FEM Model of a Graphite Block to Assess the Thermal Stress
An example of a larger assembly model is shown in Figure 15 which represents a model of the reactor to analyse the stress in the various components as a function of time during a seismic event employing a full contact model. The inputs to this analysis include the vertical and horizontal accelerations at the various support points as a function of time.
Section through the Core Structures Horizontal seismic acceleration
input
Calculated stress as a function of time
Vertical seismic acceleration input Restraint detail
Section through the Core Structures Horizontal seismic acceleration
input
Calculated stress as a function of time
Vertical seismic acceleration input Restraint detail
Figure 15: FEM Model of the Reactor to Assess the Stress due to a Seismic Event
5.2 PFC3D Model
PFC3D(http://www.itascacg.com/pfc) is a particle flow computer program that uses the Distinct Element Method (DEM) (Cundall, 1971) to simulate the non-linear interaction of a large number of particles. Instead of following a continuum approach, the physics driving the movement of particles is simulated directly. It is particularly well suited for simulating sphere-to-sphere and sphere-to-wall interactions in the core, partly because its basic modelling element is a sphere, and partly because numerical data can be easily extracted from models during simulations by using both built in and user written functions.
The following aspects related to the fuel spheres in the core are simulated:
• The vertical distribution of the normal pressure on the silo’s side walls caused by the large number of fuel spheres pressing against them. The loads are then used in the structural analysis of the graphite reflector blocks. These loads are also used to assess the stability of the centre reflector and other columns of blocks,
• The structural stiffness of the assembly of spheres in the core,
• The stress relieving effects of circulating fuel spheres in the core,
• The packing efficiency of the fuel spheres in the core and
• The sphere path and residence time
The PFC3D geometry is constructed from CAD models and captures the sphere flow paths. An example of such a model showing the defuel cones and chutes is illustrated in Figure 16. The natural irregular packing of the spheres is visible.
porosity is then used in the thermohydraulic and the neutronic models, while the pressures and pebble bed stiffness are used in the FEM models.
Figure 16: PFC3D Model Showing the Defuel Cones and Chutes
Figure 17: Radial Porosity from the PFC3D Model
6. CONCLUSION
The models described above play an integral role in the PBMR design process. The models range from simple 1D and 2D models to very detailed 3D models covering all aspects from neutronic and thermodynamic to structural analyses. These models assist the designers in assessing the validity of the design and allow for accurate and critical analysis of the design.
7. REFERENCES
Cundall, P. A., (1971) Proceedings of the Symposium of the International Society of Rock Mechanics, Vol. 1, Paper No. II-8.