INVESTIGATION
Population Genetics and Molecular Evolution
of DNA Sequences in Transposable Elements.
I. A Simulation Framework
T. E. Kijima and Hideki Innan1 Graduate University for Advanced Studies, Hayama, Kanagawa 240-0193, Japan
ABSTRACTA population genetic simulation framework is developed to understand the behavior and molecular evolution of DNA sequences of transposable elements. Our model incorporates random transposition and excision of transposable element (TE) copies, two modes of selection against TEs, and degeneration of transpositional activity by point mutations. We first investigated the relationships between the behavior of the copy number of TEs and these parameters. Our results show that when selection is weak, the genome can maintain a relatively large number of TEs, but most of them are less active. In contrast, with strong selection, the genome can maintain only a limited number of TEs but the proportion of active copies is large. In such a case, there could be substantial fluctuations of the copy number over generations. We also explored how DNA sequences of TEs evolve through the simulations. In general, active copies form clusters around the original sequence, while less active copies have long branches specific to themselves, exhibiting a star-shaped phylogeny. It is demonstrated that the phylogeny of TE sequences could be informative to understand the dynamics of TE evolution.
T
RANSPOSABLE elements (TEs) are ubiquitous and one of the major components in the genomes of many organisms, although the proportion of TEs in a genome varies across species [Homo sapiens, 40% (Landeret al.2001); Drosophilamelanogaster, 15% (Adams et al. 2000); Zea mays, 70–85%
(Craiget al.2002)]. TEs are classified into two major catego-ries based on the transposition machinery: DNA-mediated transposons (DNA transposons) and RNA-mediated transpo-sons (RNA transpotranspo-sons or retrotranspotranspo-sons). Retrotranspotranspo-sons are further classified into three superfamilies: long-terminal repeat (LTR) retrotransposons, long interspersed nuclear ele-ments (LINEs), and short interspersed nuclear eleele-ments (SINEs). Our major interest is in RNA transposons that can increase the copy number through replicative transposition.
Integration of new TEs in a genome has a direct effect on thefitness of the host genome. Insertion of a TE in the coding region of a functional gene will cause a loss of the function. If a TE is inserted near a gene, it potentially changes the
expression pattern. Insertions of TEs in junk regions might not be harmful for the host genome, but they can have indirectly deleterious effects because deletion, duplication, inversion, and translocation likely occur through ectopic recombination between TEs. Thus, to understand the mechanisms of genome evolution, it is crucial to know their potential roles, and genomic sequence data have tremendous amounts of informa-tion on how TEs have behaved in the past.
Population genetics provide a theoretical framework to understand the evolutionary behavior of any genetic varia-tion, including TEs. In the 1980s, many population genetic models of transposons were developed (Charlesworth and Charlesworth 1983; Langley et al. 1983; Charlesworth and Langley 1989). The authors focused on the evolutionary changes of the copy number of TEs in natural populations and found that the transposition–selection balance is the ma-jor factor to determine the equilibrium of the TE copy number in a genome. As mentioned above, because TEs usually have harmful effects on the host genome to some extent, almost all of these models consider selection that operates to decrease the copy number of TEs. Models were further extended to explore the potential roles of other factors, such as breeding system (Hickey 1982; Charlesworth and Charlesworth 1995; Wright and Schoen 1999; Morgan 2001), migration between
Copyright © 2013 by the Genetics Society of America doi: 10.1534/genetics.113.150292
Manuscript received February 11, 2013; accepted for publication August 9, 2013 Supporting information is available online athttp://www.genetics.org/lookup/suppl/ doi:10.1534/genetics.113.150292/-/DC1.
1Corresponding author: Graduate University for Advanced Studies, Hayama, Kanagawa
subpopulations (Deceliere et al. 2005), competition between subfamilies (Le Rouzic and Capy 2006), and activity decay by point mutations (Le Rouzic and Capy 2006; Le Rouzic et al.
2007). However, these models focus only on the copy number dynamics and did not consider the sequences of TEs. To the best of our knowledge, the most notable exception is the retro-transposon model of Navarro-Quezada and Schoen (2002) (but see Ohta 1985, Slatkin 1985, Brookfield 1986, and Hud-son and Kaplan 1986 for fundamental numerical approaches and Quesneville and Anxolabéhère 2001 and Cerveau et al.
2011 for simple models of DNA transposons). Navarro-Que-zada and Schoen (2002) modified the simulation model of Charlesworth and Charlesworth (1983) such that each TE has a DNA sequence. Their model assumed that the TE se-quence has nonsynonymous and synonymous sites and that point mutations at nonsynonymous sites decrease the trans-position rate. With this model, they investigated the pattern of the accumulation of nonsynonymous and synonymous mutations. Le Rouzicet al.(2007) also incorporated the decay of activity into the model of Charlesworth and Charlesworth (1983), but this model did not consider DNA sequences of TEs. We here extend the model of Navarro-Quezada and Schoen (2002) with a few modifications. First, the genome is assigned to functionally important regions and junk regions. It is assumed that insertion of TEs in the former regions is deleterious, but not that in the latter. Second, we use a more realistic function of the relationship between the transposition rate and point mutations according to recent data ofAlu ele-ments (Bennettet al.2008). Then, we simultaneously inves-tigate the evolutionary behavior of the copy number of TEs and their sequence evolution.
Model
Our model basically follows that of Charlesworth and Charles-worth (1983), except that each TE has a DNA sequence, which is assumed to determine the transpositional activity of the TE. It is also assumed that the genome has functionally important regions and junk regions. The evolutionary dynam-ics of TEs are simulated in a random-mating population with
Ndiploids. A diploid has a pair of haploid genomes, and each haploid consists of two chromosomes with equal lengths. A single haploid genome has in total Tsites, which can be oc-cupied by TEs. TheseTsites are located on the chromosomes with equal length of intervals. It is assumed thatp3Tsites are in functionally important regions so that TE insertion is deleterious at these sites. At the remaining (12p)3Tsites, there would be no direct selective force against TE insertion. The allocation of theTsites to the neutral and selected classes is random. The selection parameters for p3T sites are de-termined before a simulation run, and they are assumed to be constant over generations.
Each generation of the evolutionary simulation consists of (i) transposition and excision of TEs, (ii) recombination (chromosomal crossing over), (iii) point mutations and indels in the DNA sequences of TEs, and (iv) construction of a new
population for the next generation through random mating and selection.
Detailed descriptions for each step are as follows.
(i) Transposition and excision of TEs
Transposition of an active TE creates a completely identical copy, which will randomly occupy one of the empty sites. The transposition rates of TEs depend on their DNA sequences. The transposition rate for theith TE is given byui=u03ai per generation, whereu0is the maximum transposition rate andaiis the relative activity of the TE that is determined by its DNA sequence (see below for details). TEs are randomly deleted from the genome at ratev per generation, which is referred to as the excision rate.
(ii) Recombination
TEs are located on recombining chromosomes, and the rate of recombination between adjacent sites is assumed to be c
per generation. That is, the number of chiasmata per meiosis is a random variable from a Poisson distribution with mean
c 3 T, and the chromosomal locations are also randomly determined. We define the population recombination pa-rameter asr= 4Nc.
(iii) Point mutations and indels in the DNA sequences of TEs
We assume that each TE has a DNA sequence that consists of
Lnucleotides. This sequence is supposed to encode an essen-tial cis-acting factor for transposition machinery, and the se-quence determines the transpositional activity. We conventionally assume that the sequence consists of L/3 codons and that thefirst and second positions of the codon are nonsynonymous and the third position is synonymous. We use a simple two-allele model, in which only two nucleo-tides, 0 and 1, are allowed and recurrent mutation occurs between 0 and 1. Nucleotide changes at nonsynonymous positions can potentially affect the activity. The sequence is also subject to indels. We assume that any indel causes a frameshift, immediately resulting in a complete“ deactiva-tion”of the transpositional activity [i.e.,“pseudogene effect” (McAllister and Werren 1997)]. Thus, once a TE experiences an indel, it will have no chance to create a new copy, while it still occupies the site and accumulates point mutations. The rates of these two types of mutations (point mutations and indels) are denoted bymandf3mper site per generation, respectively, wherefrepresents the relative rate of indels to point mutations. The population mutation parameter is de-fined asu= 4Nm.
In contrast to indels, the effect of nonsynonymous muta-tions is rather mild. It is assumed that the original sequence at the initiation of a simulation run has the full activity; that is,
(
ai¼
xi2a
12a b
for xi.a
ai¼0 for xi#a:
(1)
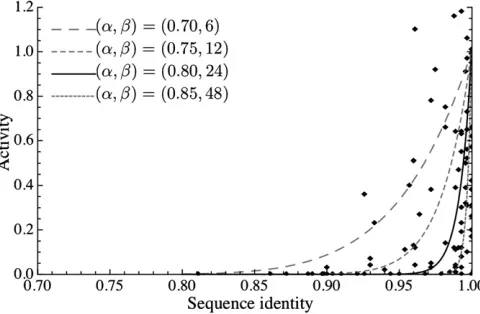
This equation produces a monotonically decreasing function from (ai, xi) = (1, 1) to (0, a) (see Figure 1). The trans-position rate is used in step i.
Thus, the model assumes that the activity is 100% determined by a cis-acting factor. One might imagine a se-quence like the coding region of reverse transcriptase as acis -acting factor. For such a region, the nonsynonymous and synonymous sites in our model can be considered as function-ally important sites as a cis-acting factor and as other less functional sites, respectively. Alternatively, for SINEs such as Alu, the entire sequence may be important as a cis-acting factor because the RNA secondary structure should determine the ability of transposition. Thus, we assume that the activity of a TE is determined by its sequence. The environments provided by trans-acting factors are assumed to be uniform for all TEs.
(iv) Construction of a new population for the next generation through random mating and selection
Selection operates against TEs at the diploid level, which is incorporated in this step to createNdiploid individuals in the next generation. In this process, a pair of haploid genomes is randomly chosen from the current generation, which becomes a candidate of the diploid offspring that constitute the next generation. Let wbe thefitness of this candidate diploid.wis determined by two modes of selection: genomic position-dependent (GP) selection and copy number-dependent (CN) selection.
Then, a random value between 0 and 1 is generated, and if it is smaller thanw, this individual is accepted as a member of the next generation. The process is repeated until we have
Ndiploids accepted.
GP selection works, depending on what part of the genome the TE is inserted in. As described above, a haploid genome has in total p3Tsites in a functionally important region, where TEs are deleterious. The selection coefficient against TE insertion at the jth site (j= {1, 2, 3,. . .,T}) is denoted bysGP(j). If it is in a functionally important region, we assume that sGP(j) follows an exponential distribution with mean l, whilesGP(j) = 0 if it is in a junk region.sGP(j)’s for allTsites are determined before a simulation run and they are assumed to be constant over generations. The total se-lection coefficient against TE insertions for thekth individ-ual is given by assuming the selection effect is additive,
sGP;k¼12
YT
j¼1
12zðj;kÞsGPðjÞ
; (2)
where
zðj;kÞ ¼
8 < :
0 if TE is absent 1 if TE is heterozygous 2 if TE is homozygous
at the jth site. This model is similar to the deleterious in-sertion model (Charlesworth 1991; Tsitrone et al.1999).
CN selection works on the number of TEs (whether active or not) in the diploid individual, which is denoted byn. The coefficient of CN selection is denoted bysCN, which we as-sume follows the function proposed by Charlesworth and Charlesworth (1983),
sCN;k¼jntk; (3)
wherenkis the number of TEs in thekth diploid individual, and j andt (.1) are coefficients that specify the function. This function is considered to represent the situation where the deleterious effect of TEs is produced by ectopic recombi-nation (e.g., Langley et al. 1988: Capy et al.1996). As the number of TEs increases, the chance of ectopic recombination dramatically increases (Petrovet al.2003), and this effect is characterized byjandt. Then, adding the effects of the two modes of selection, thefitness of thekth individual is given by
wk¼
12sGP;k
12sCN;k
: (4)
Ifwk,0, we assume that thefitness is zero according to Le Rouzicet al.(2007).
Simulations
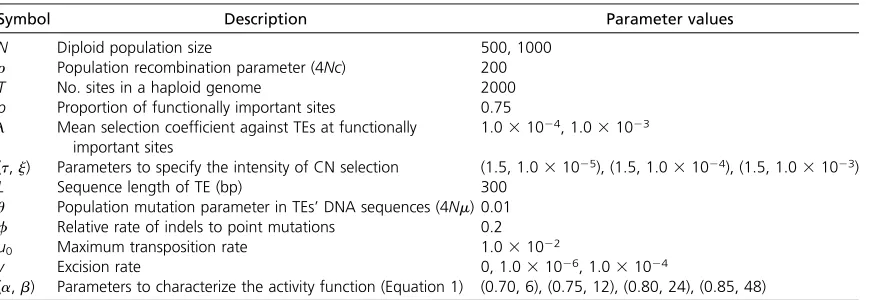
The parameter values used in the simulations are summarized in Table 1. Two values of the population sizes (N= 500 and 1000) were considered. It was assumed that a diploid genome has 2T= 4000 sites, which TEs can occupy. These sites were distributed on the genome with equal lengths of intervals, and the recombination rate (c) between adjacent sites was set such that the population recombination parameterr= 4Nc= 200. This recombination rate is quite high so that TEs can behave almost independently. It was assumed that p = 75% of the Figure 1 Relationship between the activity and DNA sequence of human
Aluelements (data from Bennettet al.2008). The horizontal axis
repre-sents the nucleotide identity betweenAluelements and their consensus
2000 sites were in functionally important regions, and we considered two values of the deleterious selection parameter, l= {1.031024, 1.031023}, representing weak and strong GP selection cases, respectively. For CN selection, wefixedt= 1.5, which was the value used in many previous simulation works following the original one by Charlesworth and Char-lesworth (1983). We used three values ofj = {1.031025, 1.031024, 1.031023}, representing weak, moderate, and strong CN selection cases.
The maximum rate of transposition wasfixed to beu0= 1.031022, which is roughly in agreement with both em-pirical estimations (Charlesworthet al.1992; Nuzhdin and Mackay 1995; Suhet al.1995; Masideet al.2000) and those used in previous simulation studies (Morgan 2001; Navarro-Quezada and Schoen 2002; Le Rouzic and Capy 2006; Le Rouzic et al. 2007). We used three different rates of exci-sion,v= {0, 1.031026, 1.031024}. We did not consider cases with v.u0because the population cannot maintain TEs with such an unrealistically high excision rate.
For point mutations that occur in TE sequences, we set the population mutation parameteru= 4Nm= 0.01, which is within a typical range of nucleotide diversities in eukaryotes (Hartl and Clark 2006). The relative rate of indels to point mutations was assumed to bef= 0.2, which is according to the observation in polymorphism data in humans (Chenet al.2009).
The two parameters (a and b) involved in Equation 1 were determined based on the human Alu data (Bennett
et al. 2008). The data are shown in Figure 1;Aluelements
of high identity to the consensus sequence have generally high activities, and the activity decreases with decreasing identity. We found that the solid line with (a,b) = (0.80, 24) in Figure 1 approximately agrees with the data, which was used in the simulation. In addition, we considered three pairs (a,b) = (0.70, 6), (0.75, 12), and (0.85, 48). Thefirst two pairs represent very small and small degeneration effects of point mutations (i.e., the activity is less sensitive to muta-tions than theAlu-fitted case represented by the solid line in Figure 1), while the last one (0.85, 48) was for a large de-generation effect (i.e., the activity dramatically drops with a small number of mutations).
Note that we here used theAludata because they should somehow reflect the relationship between the TE’s sequence divergence and the transpositional activity. Although anAlu
element does not encode a protein, it forms a secondary structure at the RNA level, which should be related to the activity level. Therefore, as a proxy, we used the observed relationship between the Alu activity and sequence diver-gence in the entire Alu region to represent the selective constraint on nonsynonymous (or functionally important) sites in our simulation.
For each of all possible combinations of these parameters (listed in Table 1), we performed simulations for 503103 generations. We assumed the initial condition for each rep-lication such that a single copy of a TE appears in a single haploid individual in the population. With this setting, TEs completely disappear in the population in a very short time in a number of replications. Excluding such replications, we obtained data to 50 3103generations forfive replications in all parameter sets. In each replication, we scored the following statistics every N/5 generations: ntotal, the total number of TEs per diploid individual; and nact, the total number of active copies (a.0) per diploid individual.
2These statistics were computed for all diploid individ-uals in the population and the averages were obtained. In addition, using 1% of representative individuals in the population, we obtained more detailed information every
N/5 generations. For each TE, we scored genomic position and transpositional activity and nucleotide divergence from the original copy at synonymous and nonsynonymous sites, denoted bydNanddS, respectively.
Results
Average copy number
Throughout this work, the transposition rate wasfixed, and we explored the effects of all other parameters. We show the results forN= 500 in the main text, and the results forN= 1000 are inSupporting Information,Figure S1, because the general patterns forN= 1000 are very similar to those for
N= 500. Table 1 Summary of the parameters used in this study
Symbol Description Parameter values
N Diploid population size 500, 1000
r Population recombination parameter (4Nc) 200
T No. sites in a haploid genome 2000
p Proportion of functionally important sites 0.75
l Mean selection coefficient against TEs at functionally
important sites
1.031024, 1.031023
(t,j) Parameters to specify the intensity of CN selection (1.5, 1.031025), (1.5, 1.031024), (1.5, 1.031023)
L Sequence length of TE (bp) 300
u Population mutation parameter in TEs’DNA sequences (4Nm) 0.01
f Relative rate of indels to point mutations 0.2
u0 Maximum transposition rate 1.031022
v Excision rate 0, 1.031026, 1.031024
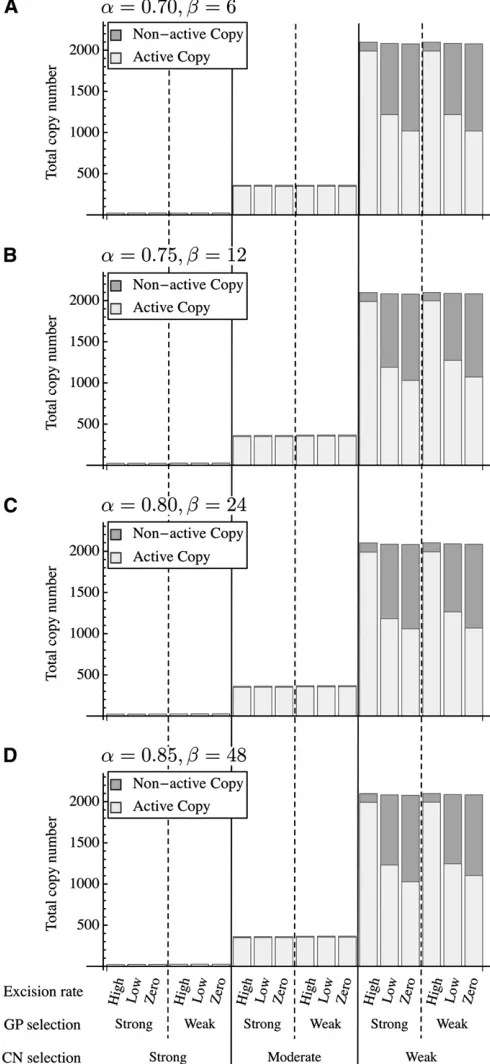
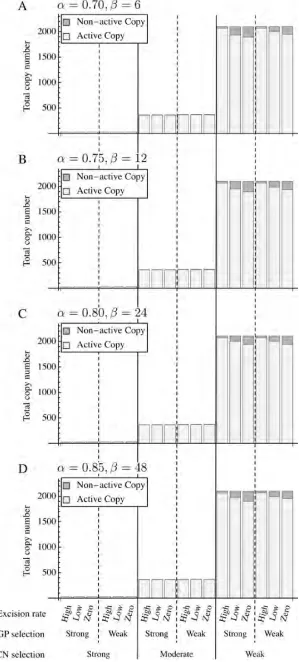
Figure 2 summarizes the effects of the parameters on the total copy number per individual ðntotalÞ. The copy number was calculated everyN/5 generations from thefive replica-tions of simulation data and the average is shown (the initial 10 3 103 generations were excluded because n
total is un-stable and depends on the initial state). We found that the total copy number is strongly affected by the intensity of CN selection. ntotal is very small when selection is strong ðntotal,30Þ, while for the cases of moderate and weak CN selection,ntotalis relatively large,ntotal400 for moderate CN selection and ntotal2000 for weak CN selection. GP selection also decreases ntotalbut the effect is not visible in the comparison between the results forl= 1024and 1023 (note that iflwas increased to 1022, in almost all simula-tion runs, TEs are virtually eliminated from the populasimula-tion soon after the initiations of the simulations). Note that the total number of sites per diploid genome is 4000, so that approximately half of them are occupied in the simulation runs withntotal2000.
It seems that ntotal is less affected by the decay rate of transpositional activity by point mutations [characterized by (a,b)]. In Figure 2, A–D are placed such that the degener-ation effect increases from top to bottom [i.e., A (0.70, 6)/ B (0.75, 12)/C (0.80, 24)/D (0.85, 48)]. The effect of the excision rate on the total numberðntotalÞis also small.
Proportion of active copies
The effect of the parameters onqactis also seen in Figure 2, in which the open boxes represent the number of active copies. qactis also affected by the two modes of selection; as the selective pressure increases,qactgenerally increases. This would be because highly active copies have more chan-ces to survive especially under strong selective pressure.
There is quite a positive correlation between the excision rate and qact, which can be understood as follows. The po-tential copy number of TEs is mainly determined by the strength of the two modes of selection, as demonstrated above. In the meantime, a number of turnovers of TEs occur. Excisions are the major event to cause turnovers. Each event makes room, in which one of the TEs in the genome can generate a daughter copy. It is obvious that a more active copy has more chance to contribute. Therefore, when turn-overs occur frequently (i.e., the excision rate is high), highly active copies increase, resulting in a largeqact. This applies particularly when ntotal is small or competition for empty sites among TEs is stiff due to strong selective pressure. In-deed, qact is close to 1.0 in all cases with ntotal,400 in Figure 2.
There is little effect of (a,b) onqact. This is simply be-cause we define active copies as those with nonzero activity (a.0).aandbdetermine only how much point mutations decrease the activity (a), and, in any case, a very large num-ber of mutations are required to make a completely non-active copy. It is suggested that the contribution of point mutations to make a completely nonactive copy is much smaller than that of indels.
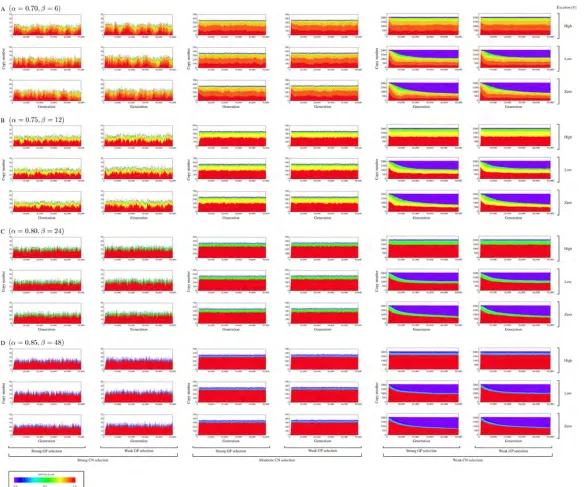
Volatility of the copy number of TEs and their activities through generations
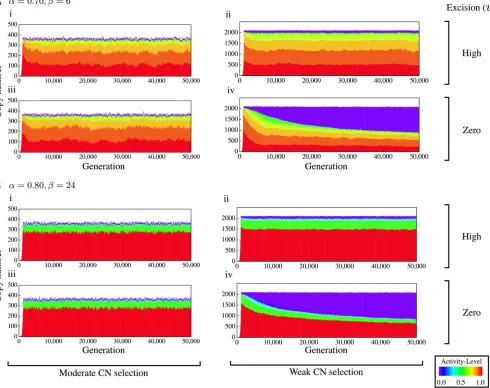
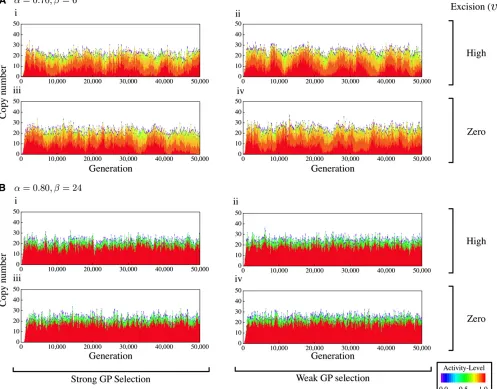
The changes of the copy number of TEs ðntotalÞ and their activities were investigated through the simulation runs. Some of the results forN= 500 are shown in Figure 3 and Figure 2 Total copy number of TEsðntotalÞwhen (a,b) = (0.7, 6), (0.75, 12), (0.8, 24), and (0.85, 48). Active and nonactive copies are shown by
open and shaded bars, respectively. The averages over five replications
Figure 4; seeFigure S2andFigure S3for full results withN= 500 and 1000, respectively. Figure 3 shows the results of eight parameter sets in the weak GP selection case with rel-ative large copy numbers. Let usfirst focus on Figure 3, A and B, left, that is, the moderate CN selection cases. The copy number seems to be stable atntotal400 and there are a sub-stantial number of active TEs.aandbare the major factors to affect the distribution of the activity level because they de-termine how quickly a TE’s activity is degenerated.
In the weak CN selection cases (Figure 3, A and B, right), the total copy number is very large (2000). When the excision rate is zero, a large proportion of TEs are less active (shown in purple) because many TEs can survive for a long time under less pressure of direct excision. A low excision rate causes slow turnovers of TEs, resulting in a longer time to reach an equilibrium, as seen in Figure 3B, iv. Note that
the cases of no excision are unique in that, at each site, once a TE isfixed, it persists forever. That is, the ultimate state of each site is thefixation of TEs that will be eventually deac-tivated by point mutations; therefore, there will be no true equilibrium. This should be the reason why the proportion of deactivated copies gradually increases in the zero excision cases (especially Figure 3, A, iv and Figure B, iv).
Figure 4 shows the results for the strong CN selection cases. The total number of TEs is very small, and most of them are highly active as mentioned earlier. The major dif-ference from the patterns in Figure 3 is that the total copy number is not stable andfluctuates greatly over generations.
Evolution of TE sequences
Our simulations allow exploring the relationship between the behavior of copy number and that of sequence evolution. Figure 3 Behavior of the copy number of TEs along simulations in the weak GP selection case. (A) (a,b) = (0.7, 6); (B) (a,b) = (0.80, 24). The levels of
activity are shown in color from red (highly active) to purple (deactivated). It should be noted that when (a,b) = (0.80, 24), the effect of a single
mutation on the activity level is larger so that the activity level decreases with a relatively large“gap”. As a consequence, we see a limited number of
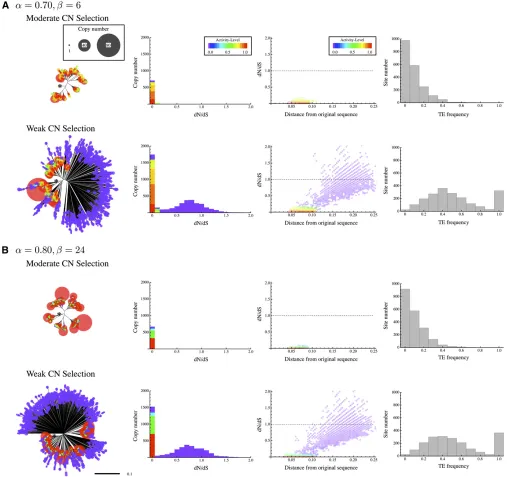
Through a single run of simulation, everyN/5 generations, we constructed a neighbor-joining (NJ) tree by using all TEs in a 1% sample of the population. We also computed thedN/
dSratios and nucleotide distances from the original sequence. The results for the weak GP selection case are summarized in Figure 5. Figure 5, A and B, respectively shows the results for (a,b) = (0.70, 6) and (0.80, 24) with zero excision rate. The results for two cases (moderate and weak CN selection cases) are shown, which correspond to Figure 3, A, iii and Figure B, iv, respectively. In each case, the NJ tree, the density distri-bution ofdN/dS, the plot of dN/dSagainst the distance from the original sequence, and the frequency spectrum of TE insertions are presented. They are based on the data att= 503 103generations because the patterns are quite stable over generations for these cases (but see below).
The patterns for (a,b) = (0.70, 6) and (0.80, 24) are quite similar. In Figure 5, in the moderate CN selection case withntotal400, most TEs are highly active (from orange to
red) and they form clusters in the NJ tree, which distribute around the original sequence (presented by an asterisk). There are some nonactive copies, and they locate quite far from the original sequence. This pattern is also seen in the density distribution of dN/dSand the plot ofdN/dSagainst the distance from the original sequence. The distances for most TEs are ,0.10, while there are several TEs with dis-tances.0.10. The former are highly active copies as is ob-vious from the lowdN/dSratio (generally,0.2), while the latter are inactive copies withdN/dSratios close to unity. The frequency spectra show that the frequencies of TEs at almost all sites are,50%, indicatingfixations of TEs are very rare and they are polymorphic.
sequence. The density distribution ofdN/dSis bimodal with two peaks; one is a sharp peak that consists of highly active copies with very small dN/dS. In contrast, the other peak consists of less active copies that broadly distribute around
dN/dS = 1. As is shown in the plot of dN/dS against the distance, active copies make a cluster along the horizontal axis at dN/dS = 0, while nonactive copies distribute over a wide range. The frequency spectra show that the frequen-cies of TEs distribute in a wide range from very low (unique) to 1 (fixed). Fixed copies likely have very low activity (or are
completely deactivated), consistent with the observation of Alu (Batzer and Deininger 2002).
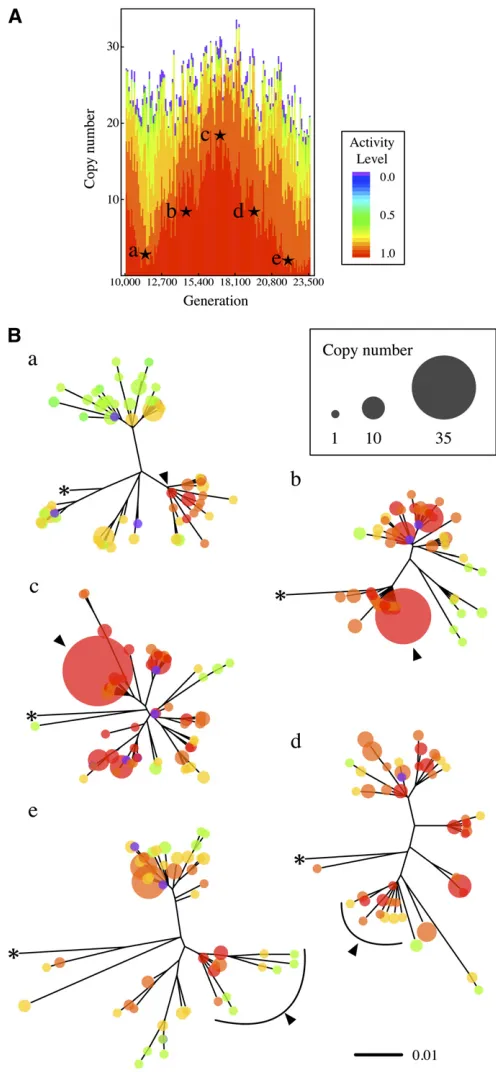
As shown in Figure 4, there are substantialfluctuations of the copy number when CN selection is strong. Such cases provide opportunities to explore how TE sequences evolve through fluctuations. In Figure 6, we show how NJ trees change along fluctuations. As an example, we use the data betweent= 103103and 23.53103generations in Figure 4A, ii, which are redrawn in Figure 6A. NJ trees are shown atfive time points with stars in Figure 6A (a, b, c, d and e, Figure 5 NJ tree, density distribution ofdN/dS, plot ofdN/dSas a function of the distance from the original sequence, and the frequency spectrum of TE
insertions. (A) (a,b) = (0.70, 6); (B) (a,b) = (0.80, 24). Results for two parameter sets are shown to represent the strong and weak CN selection cases.
These cases correspond to Figure 3, A and B, iii and iv. All results are based on the data att= 503103generations. In the NJ trees, the size and color of
corresponding tot= {11.5, 14.5, 17, 19.5, 22}3103 gen-erations, respectively).
From time a to c, the copy number of highly active copies increases dramatically, and Figure 6B shows that the most active copies presented by the red circle with an arrowhead in the tree at time a greatly contribute to this increase. The copy number increases to35 from time a to c (the corre-sponding copies are shown by a red circle with an arrow-head). At times d and e, highly active copies decrease, and then, with accumulation of point mutations, they are degen-erated, resulting in several clusters presented by circles from orange to green. Thus, analyses of TE sequences can enhance our understanding of the evolutionary mechanism of TEs.
Discussion
By taking advantage of recent drastic improvement in computational power, we performed a large-scale forward simulation of TEs. The model basically follows the classic model by Charlesworth and Charlesworth (1983). In this work, we added a number of factors to their model, and the most novel part is that each TE has DNA sequence in-formation that defines its transpositional activity. Almost all previous simulation studies have been performed with no DNA sequence information, except for very few works in-cluding that of Navarro-Quezada and Schoen (2002). They performed a simulation of TE sequences based on the model of Charlesworth and Charlesworth (1983) to explore the behavior of nucleotide changes at synonymous and nonsy-nonymous sites. Unfortunately, this sequence model has not been fully explored for a decade.
In addition to incorporating TE sequences, our modifi ca-tions include that two modes of selection (i.e., CN and GP selection) are incorporated and that the transpositional ac-tivity can be degenerated by mutations. We used a more realistic function to determine the transpositional activity, according to the human Aludata.
Furthermore, our simulation is different from that of Navarro-Quezada and Schoen (2002) in that we performed simula-tions on greater ranges for various parameters, including the genome size, the population size, and the number of simulated generations. Our extensive simulations allowed us to inves-tigate the evolutionary dynamics of TE sequences not only at a specific time point but also through generations.
Wefirst explored the effect of selection on the total copy numbers ðntotalÞ and the proportion of active copies (qact). Our results show that the combination of the two modes of selection determines the number of TEs that can be main-tained in the genome. When selection is weak, the genome can maintain a large number of TEs but the proportion of active copies should be small. In contrast, when selection is moderate, the genome can maintain a relatively small copy number of TEs, most of which are likely highly active. When the total copy number is restricted to be very low by strong selective pressure, the copy number is unstable and fl uctu-ates over generations.
We observed a clear trend that when the total copy number is smaller due to strong selection, more copies are active (Figure 2). This trade-off should be directly related to the competition among copies. When selection is strong, the Figure 6 (A and B) Change of NJ trees in a cycle offluctuation of the TE copy number. An example from Figure 4A, i is presented. NJ trees at (a) t= 11.53103, (b) 14.53103, (c) 173103, (d) 19.53103, and (e) 223
103generation are shown. The size and color of each circle represent the
capacity to maintain TEs in the genome is limited. In such a situation, if some occupiable sites become available (mainly by excision), extensive competition among TEs is expected, and more active copies have more chance to occupy.
We also explored how DNA sequences of TEs evolve in the simulations. As we have shown in Figure 5 and Figure 6, the phylogeny of TE sequences could be informative to under-stand the dynamics of TE evolution. A general trend revealed by our simulations is that active copies form clusters located close to the original sequence. In contrast, non- and less active copies usually have long branches specific to each, exhibiting a star-shaped phylogeny. This is because they accumulate in-dependent point mutations without increasing copy number. Such an accumulation causes a growth of the branch until the copy is removed from the genome. As a consequence, the average length of external branches to non- and less active copies reflects how often turnovers of TEs occur. We also showed dynamic change of phylogenetic trees of TEs when the copy number changes substantially (Figure 6).
The pattern of TE sequence evolution is similar to that of protein-coding genes under purifying selection (McAllister and Werren 1997; Navarro-Quezada and Schoen 2002). That is, the dN/dS ratio is low for active copies, and once the activity is reduced, it increases and exhibits saturation around 1.0. It is indicated that strong competitions among TEs result in selective pressure to maintain the function of transposition.
Thus, our simulation framework provides a useful tool to understand population genetics and molecular evolution of TEs, and further simulations will reveal more detailed behavior of TEs in genome evolution. It could also provide deep insights into the evolutionary dynamics of TEs in a genome, such as the formation of subfamilies and their competitions.
Acknowledgments
We thank two anonymous reviewers for their helpful com-ments. This work is in part supported by grants from the Japan Society for the Promotion of Science (JSPS) (to H.I.). T.E.K. is a JSPS predoctoral fellow.
Literature Cited
Adams, M. D., S. E. Celniker, R. A. Holt, C. A. Evans, J. D. Gocayne
et al., 2000 The genome sequence ofDrosophila melanogaster.
Science 287: 2185–2195.
Batzer, M. A., and P. L. Deininger, 2002 Alu repeats and human
genomic diversity. Nat. Rev. Genet. 3: 370–379.
Bennett, E. A., H. Keller, R. E. Mills, S. Schmidt, J. V. Moranet al.,
2008 Active Alu retrotransposons in the human genomes.
Genome Res. 18: 1875–1883.
Brookfield, J. F. Y., 1986 A model for DNA sequence evolution
within transposable element families. Genetics 112: 393–407.
Capy, P., D. Anxolabéhère, and T. Langin, 1996 Dynamics and
Evo-lution of Transposable Elements (Molecular Biology Intelligence Unit), Ed. 1. Springer-Verlag, New York.
Cerveau, N., S. Leclercq, E. Leroy, D. Bouchon, and R. Cordaux,
2011 Short- and long-term evolutionary dynamics of bacterial
insertion sequences: insights from Wolbachia endosymbionts.
Genome Biol. Evol. 3: 1175–1186.
Charlesworth, B., 1991 Transposable elements in natural
popula-tions with a mixture of selected and neutral insertion sites.
Genet. Res. 57: 127–134.
Charlesworth, B., and D. Charlesworth, 1983 The population
dy-namics of transposable elements. Genet. Res. 42: 1–27.
Charlesworth, B., and C. H. Langley, 1989 The population
genet-ics ofDrosophilatransposable elements. Annu. Rev. Genet. 23:
251–287.
Charlesworth, B., A. Lapid, and D. Canada, 1992 The distribution
of transposable elements within and between chromosomes in
a population ofDrosophila melanogaster. I. Element frequencies
and distribution. Genet. Res. 60: 103–114.
Charlesworth, D., and B. Charlesworth, 1995 Transposable
ele-ments in inbreeding and outbreeding populations. Genetics
140: 415–417.
Chen, J.-Q., Y. Wu, H. Yang, J. Bergelson, M. Kreitman et al.,
2009 Variation in the ratio of nucleotide substitution and indel
rates across genomes in mammals and bacteria. Mol. Biol. Evol.
26: 1523–1531.
Craig, N. L., R. Craigie, M. Gellert, and A. Lambowitz (Editors), 2002 Mobile DNA II, Ed. 2. American Society for Microbiology, Washington, DC.
Deceliere, G., S. Charles, and C. Biémont, 2005 The dynamics of
transposable elements in structured populations. Genetics 169:
467–474.
Hartl, D. L., and A. G. Clark, 2006 Principles of Population
Genet-ics, Ed. 4. Sinauer Associates, Sunderland, MA.
Hickey, D. A., 1982 Selfish DNA: a sexually-transmitted nuclear
parasites. Genetics 101: 519–531.
Hudson, R., and N. Kaplan, 1986 On the divergence of members
of a transposable element family. J. Math. Biol. 24: 207–215.
Lander, E. S., L. M. Linton, B. Birren, C. Nusbaum, M. C. Zodyet al.,
2001 Initial sequencing and analysis of the human genome.
Nature 409: 860–921.
Langley, C. H., J. F. Y. Brookfield, and N. Kaplan,
1983 Transposable elements in Mendelian populations. I. A
theory. Genetics 104: 457–471.
Langley, C. H., E. Montgomery, R. Hudson, N. Kaplan, and B.
Char-lesworth, 1988 On the role of unequal exchange in the
con-tainment of transposable element copy number. Genet. Res. 52:
223–235.
Le Rouzic, A., and P. Capy, 2006 Population genetics models of
competition between transposable element subfamilies.
Genet-ics 174: 785–793.
Le Rouzic, A., T. S. Boutin, and P. Capy, 2007 Long-term evolution
of transposable elements. Proc. Natl. Acad. Sci. USA 104:
19375–19380.
Maside, X., S. Assimacopoulos, and B. Charlesworth, 2000 Rates
of movement of transposable elements on the second
chromo-some ofDrosophila melanogaster. Genet. Res. 75: 275–284.
McAllister, B. F., and J. H. Werren, 1997 Phylogenetic analysis of
a retrotransposon with implications for strong evolutionary
con-straints on reverse transcriptase. Mol. Biol. Evol. 14: 69–80.
Morgan, M. T., 2001 Transposable element number in mixed
mating populations. Genet. Res. 77: 261–275.
Navarro-Quezada, A., and D. J. Schoen, 2002 Sequence evolution
and copy number of Ty1-copiaretrotransposons in diverse plant
genomes. Proc. Natl. Acad. Sci. USA 99: 268–273.
Nuzhdin, S. V., and T. F. Mackay, 1995 The genomic rate of
trans-posable element movement in Drosophila melanogaster. Mol.
Biol. Evol. 12: 180–181.
Ohta, T., 1985 A model of duplicative transposition and gene
Petrov, D. A., Y. T. Aminetzach, J. C. Davis, D. Bensasson, and A. E.
Hirsh, 2003 Size matters: non-LTR retrotransposable elements
and ectopic recombination in Drosophila. Mol. Biol. Evol. 20:
880–892.
Quesneville, H., and D. Anxolabéhère, 2001 Genetic
algorithm-based model of evolutionary dynamics of class II transposable
elements. J. Theor. Biol. 213: 21–30.
Slatkin, M., 1985 Genetic differentiation of transposable elements
under mutation and unbiased gene conversion. Genetics 110:
145–158.
Suh, D. S., E. H. Choi, T. Yamazaki, and K. Harada, 1995 Studies on
the transposition rates of mobile genetic elements in a natural
pop-ulation ofDrosophila melanogaster. Mol. Biol. Evol. 12: 748–758.
Tsitrone, A., S. Charles, and C. Biémont, 1999 Dynamics of
trans-posable elements under the selection model. Genet. Res. 74:
159–164.
Wright, S. I., and D. J. Schoen, 1999 Transposon dynamics and
the breeding system. Genetica 107: 139–148.
GENETICS
Supporting Information http://www.genetics.org/lookup/suppl/doi:10.1534/genetics.113.150292/-/DC1
Population Genetics and Molecular Evolution
of DNA Sequences in Transposable Elements.
I. A Simulation Framework
T. E. Kijima and Hideki Innan
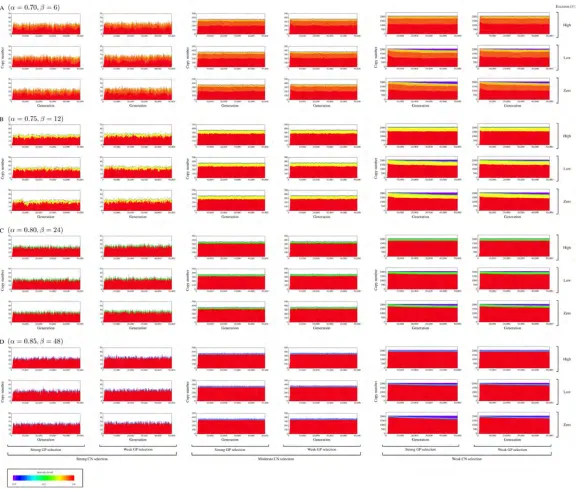
Figure S1 Total copy number of TEs ( total) for N = 1; 000. See the legend of Figure 2 for details
Figure S2 Full simulation results on the behavior of the copy number of TEs along simulations for N = 500.