University of Windsor University of Windsor
Scholarship at UWindsor
Scholarship at UWindsor
Electronic Theses and Dissertations Theses, Dissertations, and Major Papers
2008
Ultra-wideline solid-state NMR spectroscopy and its application in
Ultra-wideline solid-state NMR spectroscopy and its application in
characterizing inorganic and organometallic complexes
characterizing inorganic and organometallic complexes
Joel A. Tang
University of Windsor
Follow this and additional works at: https://scholar.uwindsor.ca/etd
Recommended Citation Recommended Citation
Tang, Joel A., "Ultra-wideline solid-state NMR spectroscopy and its application in characterizing inorganic and organometallic complexes" (2008). Electronic Theses and Dissertations. 8009.
https://scholar.uwindsor.ca/etd/8009
Ultra-Wideline Solid-State NMR Spectroscopy and
its Application in Characterizing Inorganic and
Organometallic Complexes.
By
Joel A. Tang
A Dissertation
Submitted to the Faculty of Graduate Studies through the Department of Chemistry and Biochemistry
in Partial Fulfilment of the Requirements for the Degree of Doctor of Philosophy
at the University of Windsor.
Windsor, Ontario, Canada
2008
1*1
Library and Archives CanadaPublished Heritage Branch
395 Wellington Street Ottawa ON K1A0N4 Canada
Bibliotheque et Archives Canada
Direction du
Patrimoine de I'edition
395, rue Wellington Ottawa ON K1A0N4 Canada
Your file Votre reference ISBN: 978-0-494-47109-8 Our file Notre reference ISBN: 978-0-494-47109-8
NOTICE:
The author has granted a non-exclusive license allowing Library and Archives Canada to reproduce, publish, archive, preserve, conserve, communicate to the public by
telecommunication or on the Internet, loan, distribute and sell theses
worldwide, for commercial or non-commercial purposes, in microform, paper, electronic and/or any other formats.
AVIS:
L'auteur a accorde une licence non exclusive permettant a la Bibliotheque et Archives Canada de reproduire, publier, archiver,
sauvegarder, conserver, transmettre au public par telecommunication ou par I'lnternet, prefer, distribuer et vendre des theses partout dans le monde, a des fins commerciales ou autres, sur support microforme, papier, electronique et/ou autres formats.
The author retains copyright ownership and moral rights in this thesis. Neither the thesis nor substantial extracts from it may be printed or otherwise reproduced without the author's permission.
L'auteur conserve la propriete du droit d'auteur et des droits moraux qui protege cette these. Ni la these ni des extraits substantiels de celle-ci ne doivent etre imprimes ou autrement reproduits sans son autorisation.
In compliance with the Canadian Privacy Act some supporting forms may have been removed from this thesis.
While these forms may be included in the document page count,
their removal does not represent any loss of content from the thesis.
• * •
Canada
Conformement a la loi canadienne sur la protection de la vie privee, quelques formulaires secondaires ont ete enleves de cette these.
Declaration of Co-Authorship / Previous Publications
The majority of the material contained within this document has been previously
published in peer-reviewed journals. In accordance with regulations defined by the Faculty
of Graduate Studies, this dissertation is presented in manuscript format. I was the principal
investigator for all publications and I had a significant role in the preparation of the
manuscript. I acknowledge my supervisor, Professor Robert W. Schurko, as a co-author in
this work as he made significant contributions to the writing/editing of manuscripts. Other
listed authors on manuscripts contributed through acquisition of raw data or synthesis of the
material studied. The dissertation is based on the following publications:
Chapter 3: Joel A. Tang, Jason D. Masuda, Timothy J. Boyle, and Robert W. Schurko. Ultra-wideline 27A1 NMR Investigation of Three-and Five-Coordinate Aluminum Environments. ChemPhysChem, 2006, 7, 117-130; DOI:
10.1002/cphc.200500343
Chapter 4: Joel A. Tang, Bobby D. Ellis, Timothy H. Warren, John V. Hanna, Charles L. B. Macdonald, and Robert W. Schurko. Solid-State 63Cu and 65Cu NMR Spectroscopy of Inorganic and Organometallic Copper(I) Complexes. J.
Amer. Chem. Soc, 2007,129, 13049-13065; DOI: 10.1021/ja073238x.
Chapter 5: Elzbieta Kogut, Joel A. Tang, Alan J. Lough, Cory M. Widdifield, Robert W. Schurko, and Ulrich Fekl. Neutral High-Potential Nickel Triad Bisdithiolenes: Structure and Solid-State NMR Properties of P t f S ^ C F j ^ L .
Inorg. Chem., 2006, 45, 8850-8852; DOI: 10.1021/ic0614972.
I certify that I have obtained permission from the copyright owner(s) to include the
above published material(s) in my thesis. I certify that this thesis, and the research to which
it refers, are the product of my own work during my registration as graduate student at the
I declare that, to the best of my knowledge, my thesis does not infringe upon anyone's
copyright nor violate any proprietary rights and that any ideas, techniques, quotations, or any
other material from the work of other people included in my thesis, published or otherwise,
are fully acknowledged in accordance with the standard referencing practices. Furthermore,
to the extent that I have included copyrighted material that surpasses the bounds of fair
dealing within the means of the Canada Copyright Act, I certify that I have obtained a written
permission from the copyright owner(s) to include such material(s) in my thesis.
I declare that this is a true copy of my thesis, including any final revisions, as
approved by my thesis committee and the Graduate Studies office, and that this thesis has not
Abstract
Ultra-wideline (UW) powder patterns (breadth sizes > 300 kHz) are difficult to
acquire using conventional NMR methods because of limited excitation bandwidths and/or
low signal intensities. This thesis will demonstrate the application of solid-state UWNMR
spectroscopy and complementary techniques such as X-ray diffraction and theoretical
calculations, to examine nuclear environments of chemical materials.
27A1 UWNMR experiments were conducted in a frequency-stepped manner on
coordination compounds with 27A1 nuclei with non-spherical coordination environments by
using Hahn-echo and/or QCPMG pulse sequences. 27A1 quadrupolar coupling constants
(CQ(27A1)) as large as 48.2(1) MHz. X-ray data and theoretical calculations are utilized to
examine the relationships between the quadrupolar interactions and molecular structure.
Solid-state 63/65Cu NMR experiments were conducted on a series of inorganic and
organometallic copper(I) complexes with a variety of spherically asymmetric Cu coordination
environments. Enormous CQ(63/65Cu) values and significant copper chemical shielding
anisotropics (CSAs) are measured ranging from 3.4 to 71.0 MHz. 'H-31P CP/MAS NMR
spectra for complexes with 63/65Cu-31P spin pairs are used to determining the sign of CQ and
EFG tensor orientation. X-ray data and theoretical calculations aid in examining the
relationship of the NMR interaction tensor with the molecular structure.
Multinuclear solid-state NMR and EPR spectroscopy and first principles calculations
are used to examine the electronic structures of the redox series [Pt(tfd)2]z"[NEt4]z+ (tfd =
S2C2(CF3)2; z = 0,1,2). 195Pt NMR experiments revealed large 195Pt CSAs with distinct CS
[Pt(tfd)2][NEt4] is examined using EPR, 13C and 19F MAS NMR spectroscopy. The unpaired
electron spin densities at 13C and 19F nuclei were measured using variable temperature NMR
experiments. Theoretical calculations help rationalize the large platinum CSAs and different
CS tensor orientations and determine the electron spin densities at 13C and 19F nuclei.
The use of microcoils and WURST pulses for acquiring UWNMR spectra is
explored. UW spectra can be acquired without changing the transmitter frequency using large
rf fields or frequency-swept pulses. The efficiency of UWNMR spectroscopy improved for
both microcoil and WURST pulse experiments compared to 4.0 mm coil experiments.
Microcoils are also used to acquire UW spectra of an unreceptive nucleus (91Zr) and a
Awan kas iti sursuro a sanikua, ta dayta awan makatakaw kenka.
Acknowledgements
After my undergraduate studies I applied to a number of schools for post-graduate
studies. Unexpectedly, Professor Schurko contacted me shortly after and knowing that I had
no background in NMR spectroscopy took a chance and hired me. For the past five years he
has led me through a journey into the theory and practices of solid-state NMR. For his
guidance and wisdom that he has given me about NMR spectroscopy and science in general
I truly owe him a great deal of gratitude. I would also like to thank him for all the
opportunities he has given me to expand my social network in the NMR community through
conferences and meetings as well as from working abroad. I know that the travel costs were
quite a bit especially the three months in Paris.
I could not have proceeded in this conquest without the help of my colleagues who
have backed me through all of this and I must extend my appreciation to them. First, Dr.
Ivan Hung and Dr. Andy Lo, who passed on their knowledge to me as I progressed through
my research, I would not have gotten far without them. Next, to all of those who have come
and gone the years who I knew I could turn to for advice and do things that I really did not
want to do myself: Cory Widdifield, Aaron Rossini, Hiyam Hamaed, Alan MacGregor, Luke
O'Dell, Andre Sutrisno, Bryan Lucier, Ryan Mills, Jenna Pawlowski, Marcel Hildebrand and
Michael Laschuk. The presence of everyone in the office made the dynamics of the group
unique. From the many debates on serious topics (i.e. who would win in an all out brawl:
The Muppets or Sesame Street characters) as well as the subtle bickering between two
colleagues (not because they despised each other, but because I think they secretly had
The Macdonald Group, in particular Prof. Charles L. B. Macdonald, Bobby Ellis,
Chris Andrews, Erin Norton, and Benjamin Copper, I would also like to acknowledge. I
appreciate all the useful insight and discussions we had involving the reactions and systems
that I worked with, teaching me the key aspects of inert atmosphere chemistry (execution and
maintenance), and using your lab space when we had none of our own. Also, I apologise for
all the glassware I broke while working in your lab (oops!).
Dr. Dimitiri Sakellariou and his NMR research group at CEA, Sacalay, France are
recognized for allowing me to visit their research facilities and teaching me certain aspects
of your work. The time I spent there will always be remembered.
I would like to thank Mike Fuerth for all his help with the NMR spectrometers and
Sinisa Jezdic for help with any electronic problems. Your guidance in helping me to try to
keep our NMR lab run smoothly and with regular maintenance is greatly recognized.
I thank Charles Macdonald, Jichang Wang, Paul Ellis and Chitra Ranga for serving
on my advisory committee and taking the time to read my thesis and attend my defense.
Most importantly, I would like to thank my family and friends for all your love and
Table of Contents
Declaration of Co-Authorship / Previous Publications iii
Abstract v Dedication vii Acknowledgments viii
List of Tables xiv List of Figures and Schemes xvi
List of Appendices xxiv List of Abbreviations xxxi List of Symbols xxxv
1 Introduction 1
Bibliography 10
2 Key Concepts of Nuclear Magnetic Resonance 16
2.1 NMR Interactions 16 2.1.1 External Interactions 16
2.1.1.1 Zeeman Interaction 17 2.1.1.2 Radio Frequency Field 20 2.1.2 Internal Interactions 22
2.1.2.1 Chemical Shielding 22 2.1.2.2 Quadrupolar Coupling 27
2.1.2.3 Euler Angles 31 2.1.2.4 Direct and Indirect Spin-Spin Coupling 33
2.2 Selected Experimental Methods 35 2.2.1 Magic Angle Spinning 35 2.2.2 Frequency-Stepped NMR 37
2.2.3 Cross Polarization 39 2.2.4 Spin-Echo and QCPMG Pulse Sequences 40
2.2.5 Ab initio and DFT Calculations 42
Bibliography 45
3 Ultra-Wideline 27A1 NMR Investigations of Three- and Five-Coordinate Aluminum
Environments 49
3.1 Introduction 49 3.2 Experimental 53
3.2.1 Sample Preparation 53 3.2.2 Single Crystal X-ray Diffraction 54
3.2.3 Powder X-ray Diffraction 54 3.2.4 Simulation of Powder X-ray Diffraction Patterns 55
3.2.7 NMR Simulations 57 3.2.8 Theoretical Calculations 58
3.3 Results and Discussion 58 3.3.1 Solid-State NMR Spectroscopy 58
3.3.1.1 27A1 NMR Spectroscopy of Three-Coordinate Aluminum Compounds 60 3.3.1.2 27Al NMR Spectroscopy of Five-Coordinate Aluminum Compounds
64
3.3.1.3 Solid-State 13C NMR Spectroscopy 67
3.3.2 X-ray Diffraction 68 3.3.3 Structural Features 70 3.3.4 Theoretical Calculations of 27A1EFG Tensors 71
3.3.5 Relationships Between Structure and EFG Tensor Characteristics . . . . 77
3.4 Conclusion 84 Bibliography 86
4 Solid-State 63C and 65Cu UWNMR Spectroscopy of Inorganic and Organometallic
Copper(I) Complexes 93
4.1 Introduction 93 4.2 Experimental 96
4.2.1 Sample Preparation 96 4.2.2 Single Crystal and Powder X-ray Diffraction 100
4.2.3 Sample Purity 101 4.2.4 Solid-State NMR Spectroscopy 101
4.2.5 NQR Spectroscopy 104 4.2.6 NMR Simulations 105 4.2.7 Theoretical Calculations 105
4.3 Results and Discussion 106 4.3.1 Solid-state 63Cu and 65Cu NMR Spectroscopy 106
4.3.2 3,P CP/MAS NMR and Residual Dipole-Dipole Couplings 120
4.3.3 Theoretical Calculations of 65/63Cu EFG Tensors 127 4.3.4 Theoretical Calculations of Copper CS Tensors 135
4.4 Conclusion 138 Bibliography 139
5 Characterization of Platinum Bisdithiolene Complexes using Multinuclear
Solid-State NMR Spectroscopy 149
5.1 Introduction 149 5.2 Experimental 154
5.2.1 Sample Preparation 154 5.2.2 X-ray Crystal Structure Determinations 156
5.2.4 EPR Spectroscopy 158 5.2.5 NMR and EPR Simulations 158
5.2.6 Theoretical Calculations 158
5.3 Results and Discussion 160 5.3.1 Solid-State Structures 160
5.3.2 Solid-State Platinum NMR and EPR Spectroscopy 163
5.3.3 19F-13C CP/MAS NMR Spectroscopy 168
5.3.4 19F MAS NMR Spectroscopy 171 5.3.5 Variable-Temperature NMR 173 5.3.6 Computational Studies of NMR Parameters 176
5.3.7 Platinum CS Tensor Calculations 177
5.3.8 MO Analysis 180 5.3.9 g-Tensor Calculations 186
5.3.10 Hyperfme Shift Calculations 186
5.3.11 Electronic Structure 189
5.4 Conclusion 190 Bibliography 192
6 Application of Static Microcoils and WURST Pulses for Solid-State Ultra-Wideline
NMR Spectroscopy of Quadrupolar Nuclei 202
6.1 Introduction 202 6.2 Experimental 206 6.3 Results and Discussion 207
6.3.1 Efficiency Gain Using Microcoils or WURST Pulses 207 6.3.2 The Effects of High rf Field Strengths on NMR Powder Patterns using
Microcoils 212 6.3.3 Further UWNMR Applications of Microcoils - Low-yNuclei and Satellite
Transitions 217 6.4 Summary/Conclusions 220
Bibliography 222
7 Future Research Directions 226
Bibliography 235
Appendices
A Supplementary Tables 238
A. 1 Supplementary Tables for Chapter 3 238 A.2 Supplementary Tables for Chapter 4 250 A.3 Supplementary Tables for Chapter 5 279 A.4 Supplementary Tables for Chapter 6 288
B. 1 Supplementary Figures for Chapter 3 289 B.2 Supplementary Figures for Chapter 4 292 B.3 Supplementary Figures for Chapter 5 300 B.4 Supplementary Figures for Chapter 6 301
C Copyright Release Forms 305
List of Tables
3.1 Experimental and calculated 27A1NMR Parameters of AlMes3 and A1(NTMS2)3 . . .
72
3.2 Experimental and calculated 27A1 NMR Parameters of [Me2-Al(//-OTHF)]2, and
[Et,-Al(//-OTHF)]2 75
3.3 Comparison of theoretically calculated 27A1 EFG tensors for the Al atom and A1X3
molecules 81
4.1 Summary of X-ray crystallographic data for the Cp'CuPR3 compounds 102
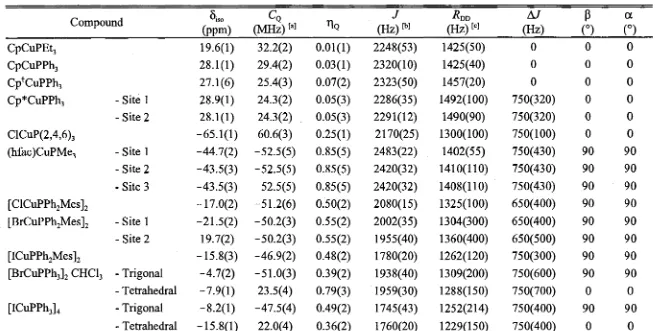
4.2 Experimental 65/63Cu NMR parameters 109
4.3 NQR data for select copper phosphines 116
4.4 31P NMR experimental parameters 123
4.5 Theoretical G03 copper EFG tensor calculations using the RHF method 128
4.6 Theoretical G03 copper CS tensor calculations using RHF and B3LYP
methods 136
5.1 Crystallographic data for [Pt(tfd)2]° and [Pt(tfd)2][NEt4]2 161
5.2 Experimental 195Pt CS tensor parameters 165
5.3 Selected bond lengths of [Pt(tfd)2]° and [Pt(tfd)2][NEt4]2 166
5.4 Platinum CS tensor parameters calculated using ADF software 178 5.5 Contributions to paramagnetic shielding from mixing of occ and vir MOs of [Pt(tfd)2]°
based on BLYP/TZP-Pt(4d) calculations 183
5.6 Contributions to paramagnetic shielding from mixing of occ-vir MOs of [Pt(tfd)2]2"
based on BLYP/TZP-Pt(4d) calculations 183
5.7 Theoretical g-tensor values of [Pt(tfd)2]" 187
6.1 Experiment efficiency comparisons for acquiring RbC104 and GaPcCl NMR spectra 208
6.2 Quantitative comparisons (An) of the 87Rb and 71Ga NMR powder patterns to the
standard spectra at different rf field strengths 215
List of Figures and Schemes
Figures:
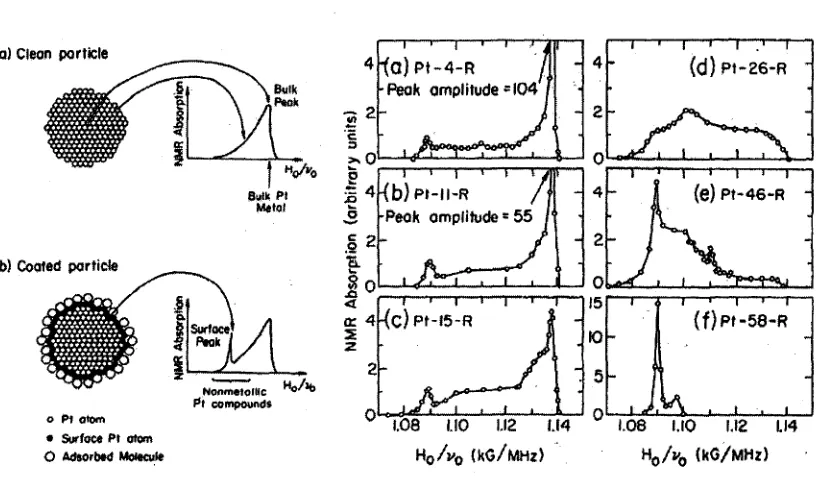
1.1 Schematics of a clean and coated Pt nanoparticle (left). From the 195Pt field-sweep NMR, the resonance at low field corresponds to the surface Pt atoms and at high field from the core Pt atoms. Reprinted figure with permission from reference [50].
Copyright 2008 by the American Physical Society 5
1.2 Frequency-stepped (point-by-point) 27A1 NMR experiment at 9.4 T on an (aminato)hexaluminum cluster (a). Top and bottom traces are experimental and simulated spectra. 59Co NMR variable offset cumulative spectra at 11.8 T of [(Py)2CoPc]Br (b). Left are the experimental sub-spectra and right are simulations. Inset spectrum represents the ideal line shape. Figures reprinted with permission from references [56] and [58]. Copyright 2008 American Chemical Society
6
2.1 (a) The relation between the nuclear angular momentum (I) and magnetic moment (ji) vectors. For positive gamma (y), \i and I are parallel, and for negative y they are antiparallel. (b) Precession of the nuclear magnetic moment around B0; clockwise rotation when y is positive and counterclockwise rotation when y is negative
17
2.2 Nuclear spin interaction with B0. The energy difference (A£) between eigenstates increases linearly with the Larmor frequency (and hence the magnetic field strength) 19
2.3 Nuclear spin precession about the z-axis of B0 and the resulting net magnetization
20
2.4 Rotation of the net magnetization (M0) about an induced magnetic field (B,) after applying a rf pulse. The angle of rotation is governed by the pulse length (xp)
21
2.5 (a) T, is the time required for the spins to return to thermal equilibrium and the build-up of net magnetization along the z-axis. (b) T2 is the time required for complete decoherence of the magnetization in the xy-plane. (c) The influence of T2 and T2* on
the FID 22
frequencies with respect to the magnetic field in a powder sample 25
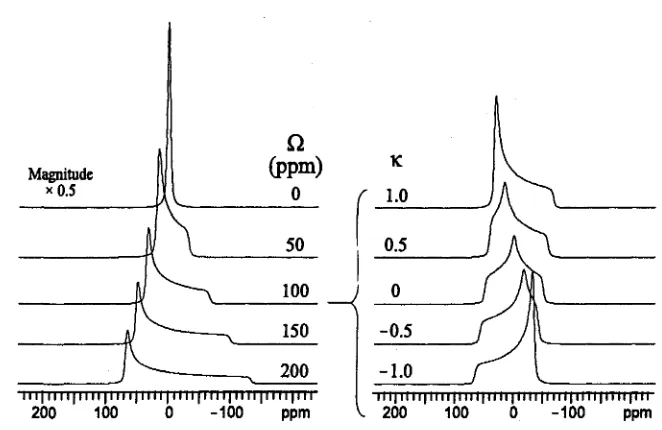
2.7 Different CS tensor conventions used to describe the CS powder patterns. From left to right are the standard (a), Herzfeld-Berger (b) and Haeberlen (c) conventions, a =
522 -8i s o and b = (5^, S^ll. Adapted from figures by Klaus Eichele
(http://anorganic.uni-tuebingen.de/klaus/nmr) 26
2.8 Influence of Q. (left) and K (right) on the chemical shielding dominated powder pattern
line shape 27
2.9 First- and second-order quadrupolar perturbation from the Zeeman levels for a spin-3/2
nucleus. Note that zero-field degeneracies are neglected in this figure 30
2.10 Relationship between the magnitude of CQ and the molecular site symmetry. Adapted
from the work of Kentgens
31
2.11 Influence of CQ (left) andrjQ (right) on the static quadrupolar powder pattern line shape 31
2.12 Pictorial representation of the CS tensor rotation from the initial frame of reference
(x,y, z) into its own PAS (X,Y,Z) 32
2.13 The influence of sample rotation on (a) CS A dominated and (b) quadrupolar dominated
powder patterns. Signal enhancement is achieved since the signal intensity increases
under the peaks as the rotational speed (vrot) becomes faster 36
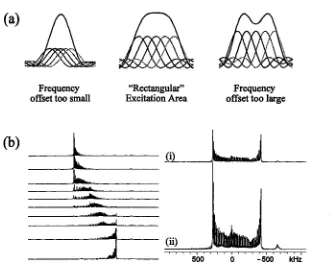
2.14 (a) The effects of applying improper frequency increment values on the excitation
profile. Enhancement at the center of the profile occurs when the increment is too small and with a large increment the excitation depletes at the center, (b) The set of sub-spectra collected across a frequency range are processed by (i) skyline projection
or (ii) addition 38
2.15 Cross-polarization pulse sequence 40
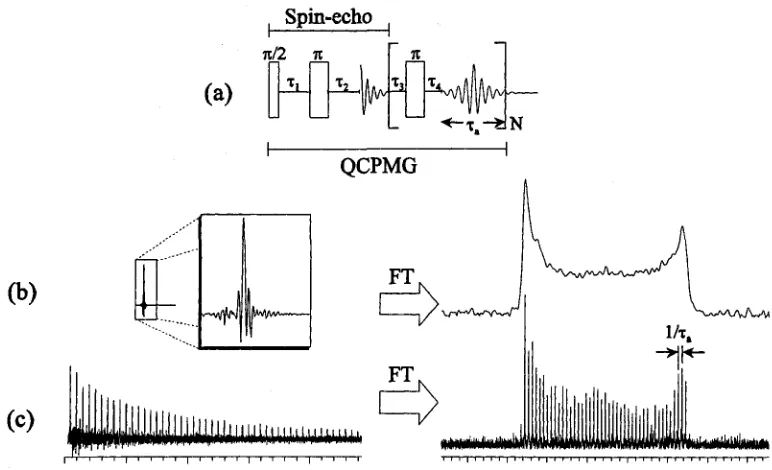
2.16 (a) Spin-echo and QCPMG pulse sequences, (b) Spin-echo FID where a full echo is
acquired and the corresponding spectrum, (c) The QCPMG FID embodies a chain of spin-echoes, determined by the number of Meiboom-Gill (MG) loops of the pulse
sequence, and the associated spikelet spectrum 41
3.1 Frequency-stepped 27A1 QCPMG NMR spectra f (a) AlMes3 and (b) A1(NTMS2)3. Top
impurities 60
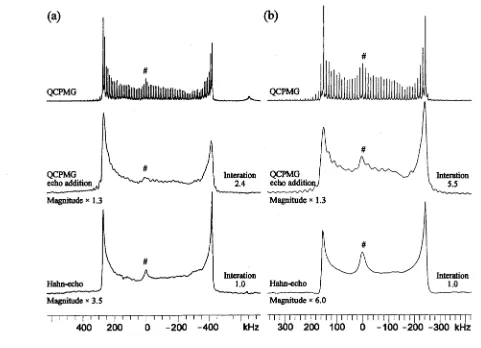
3.2 Comparison of QCPMG, summed QCPMG echo, and Hahn-echo spectra for (a) AlMes3 and (b) A1(NTMS2)3. The spectra were processed using co-addition. # denotes
impurities 61
3.3 Central transition static 27A1NMR spectra of (a) AlMes3 and (b) A1(NTMS2)3. Top
traces are analytical simulations, centre traces are Hahn-echo spectra and bottom traces are high-resolution QCPMG spectra, f indicates FM radio signal interference and #
denotes impurities 62
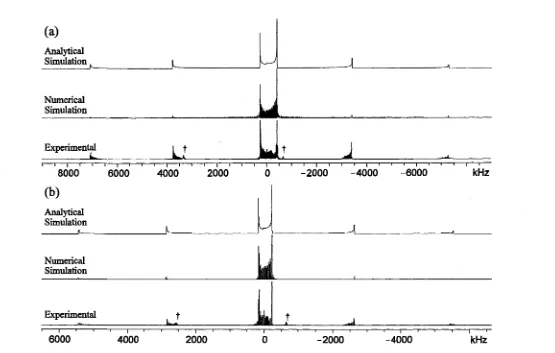
3.4 27A1 QCPMG central and satellite transition NMR spectra of (a) AlMes3 and (b) A1(NTMS2)3. Each set displays analytical simulations (top trace), numerical simulations (middle trace), and experimental (bottom) spectra. Total acquisition time was approximately 2.5 to 3 h for each compound, f denotes signal interference from
FM radio stations 65
3.5 Static central transition 27A1 NMR spectra of (a) [Me2-Al(u-OTHF)]2 and (b) [Et,-Al(u-OTHF)]2. Top-to-bottom traces are analytical simulations, Hahn-echo spectra, and
high resolution QCPMG spectra, respectively 66
3.6 13C {]H} CP/MAS NMR spectra of (a) AlMes3 (vrot = 9.0 kHz), (b) A1(NTMS2)3 (vrot = 7.0 kHz), (c) [Me2-Al(n-OTHF)]2 (vrot = 7.0 kHz) and (d) [Eta-A10i-OTHF)]2 (vrot =
5.0 kHz). * denotes spinning side bands and # denotes impurities 68
3.7 Simulated and experimental PXRD patterns of (a) AlMes3, (b) A1(NTMS2)3, and (c) [Me2-Al(|j,-OTHF)]2. Peaks are labelled with the corresponding d spacings
69
3.8 Theoretical 27A1 EFG tensor orientations of (a) AlMes3, (b) A1(NTMS2)3, (c) [Me2-Al(u,-OTHF)]2, and (d) [Me2-Al(|i-OTHF)]2. Hydrogen atoms were removed for clarity
74
3.9 Effects of varying molecular bond lengths of the first coordination sphere on |F33| (- • - ) and SCF energy ( - • - ) for (a) AMes3 and (b) A1(NTMS2)3. Calculations are based on B3LYP/6-311G** and crystallographic values are circled. SCF energies are
normalized to 0 kJ mor1 with respect to the crystallographic state 78
3.10 MO diagrams of A1C13 (a-c) and AlMe3 (d-e). pz orbitals (HOMO-1) of the chlorine
aluminum is shown in (e). Hydrogen atoms have been removed for clarity
82
3.11 MO diagrams of A1(NTMS2)3 (a-c) and AlMes3 (d-e). Nitrogen/?, orbitals (HOMO) (a) of A1(NTMS2)3 involved in 71 donation to the aluminum pz orbital (b). The unoccupied p2 orbital (LUMO+1) of aluminum is shown in (c). The p orbitals (HOMO) of carbon atoms on AlMes3 are primarily involved in the n system of the aromatic rings (d) and show no n donation to the aluminum atom. The pz orbital (LUMO) of AlMes3 is shown in (f). Hydrogen atoms are removed for clarity
84
4.1 65Cu (left set) and 63Cu (right set) NMR spectra of [Cu(PhCN)4] [BF4]. (a) Simulation and experimental MAS spectra at 9.4 T with vrot = 16.0 kHz. (b) Static NMR spectra at 9.4 T where the top trace shows a simulation without CSA, middle trace with CSA and the bottom trace is experimental, (c) Static NMR spectra at 21.1 T. * indicates
spinning sidebands 107
4.2 Static 65Cu (left) and 63Cu (right) NMR spectra of (a) CpCuPEt3, (b) CpCuPPh3, (c) Cp^uPPhj and (d) Cp*CuPPh3. Top and bottom traces are analytical simulations and experimental spectra, respectively, f denotes FM radio signal interference and #
indicates small signal from copper metal 110
4.3 Static 65Cu NMR spectra of (a) ClCuP(2,4,6)3, (b) (hfac)CuPMe3 and (c) [Me3NN]Cu(CNAr). Top, middle and bottom traces are analytical simulations, numerical simulations and experimental spectra, respectively. # denotes metallic
copper interference and * indicates part of the satellite transitions 114
4.4 65Cu Static QCPMG spectra of (a) [ClCuPPh2Mes]2, (b) [BrCuPPh2Mes]2 and (c) [ICuPPh2Mes]2. Top and bottom traces are analytical simulations and experimental spectra respectively. # denotes copper metal interference, f indicates an unknown
impurity and * denotes signal from ±1/2-3/2 satellite transition 115
4.5 Static 65Cu NMR spectra of (a) [BrCuPPh3]4CHCl3 and (b) [ICuPPh3]4 stepped clusters. Starting from the top, traces correspond to analytical simulations of the tetrahedral and trigonal sites, the added analytical simulations and the experimental
spectrum 118
4.6 Copper chemical shifts of Cu(I) complexes referenced with respect to CuCl(s) (8iso = 0
ppm) 119
4.7 'H-31P CPMAS NMR spectra of (a) CpCuPEt3 (b) CpCuPPh3 (c) CptCuPPh3 (d) Cp*CuPPh3. Top and bottom traces are analytical simulations and experimental
4.8 'H- 31P CPMAS NMR of (a) ClCuP(2,4,6)3, (b) (hfac)CuPMe3, (c) [ClCuPPh2Mes]2, (d) [ICuPPh2Mes]2 and (e) [BrCuPPh2Mes]2. Bottom traces are experimental spectra and top traces are analytical simulations where the two sites, (i) and (ii), are in a 5:3
ratio for (e) 124
4.9 1H-31P CPMAS NMR spectra of step clusters (a)[BrCuPPh3]4CHCl3 and (b) [ICuPPh3]4. Top traces are simulations and bottom traces are experimental spectra; (i) simulation of the trigonal site, (ii) simulation of the tetrahedral site and (iii) is the sum
of both simulations. * denote spinning sidebands 125
4.10 65Cu EFG tensor orientation for (a) [(PhCN)4Cu]+ and EFG and CS tensor orientation for (b) CpCuPEt3> (c) CpCuPPh3, (d) CpfCuPPh3 and (e) Cp*CuPPh3. All orientations are from RHF/6-31++G** calculations. Protons were removed for clarity . . . . 127
4.11 65Cu tensor orientations for (a) ClCuP(2,4,6)3, (b) (hfac)CuPMe3, (c)
[Me3NN]Cu(CNAr), (d) [ClCuPPh2Mes]2, (e) [BrCuPPh2Mes]2, (f) [ICuPPh2Mes]2, (g) [BrCuPPh3]4CHCl3, and (h) [ICuPPh3]4. All orientations are from RHF/6-31++G** calculations. Protons, phosphines and mesityl groups are removed for clarity
132
4.12 Correlation of electron density and EFG tensor orientations of (a) (hfac)CuPMe3, (b)
[Me3NN]Cu(CNAr), (c) [ClCuPPh2Mes]2, (d) [BrCuPPh2Mes]2, (e) [ICuPPh2Mes]2,
(f) [BrCuPPh2Mes]2 and (g) [ICuPPh3]4 133
5.1 Molecularstmctures(30°/oprobabilityenvelopes)of[Pt(tfd)2]0(a)and[Pt(tfd)2][NEt4]2 (b). Selected distances and angles (A, °): a) Ptl-Sl, 2.2423(18); Ptl-S2, 2.2360(18); Sl-Cl, 1.701(6); S2-C2,1.692(6); CI-C2,1.380(9); Sl-Ptl-S2,88.52(7); Sl-Ptl-S2', 91.48(7). b) Ptl-Sl, 2.2855(17); Ptl-S2, 2.2826(16); Sl-Cl, 1.761(6); S2-C2,
1.745(7); C1-C2, 1.348(9); Sl-Ptl-S2, 89.05(6); S1-PU-S2*, 90.95(6). Confidence intervals given (center of the Figure) refer to 95% confidence (mean ± 2 s. e. m.). The
C-C bond shortening indicated is significant with 92% confidence 162
5.2 195Pt NMR spectra of (a) [Pt(tfd)2]° and (b) [Pt(tfd)2][NEt4]2 where (i) are static and (ii) are MAS spectra. Top traces are simulations and bottom traces are experimental spectra. The downwards arrows denotes isotropic chemical shifts and all other peaks
are spinning side bands 164
5.3 Solid-state platinum EPR spectrum of [Pt(tfd)2][NEt4] at room temperature
167
5.4 19F-I3C CP/MAS NMR spectra of (a) [Pt(tfd)2]°, (b) [Pt(tfd)2][NEt4]2, and (c) [Pt(tfd)2][NEt4] at 9.4 T. The downwards arrows denotes isotropic chemical shifts and
5.5 19F MAS NMR spectra of (a) [Pt(tfd)2]°, (b) [Pt(tfd)2][NEt4]2 and (c) [Pt(tfd)2][NEt4] at 9.4 T. The downwards arrows denotes isotropic chemical shifts, * indicates the presence of trace amounts of starting material, [Pt(tfd)2][NEt4]2, and all other peaks are
spinning sidebands 172
5.6 19F-13C CP/MAS NMR spectra at various temperatures of [Pt(tdf)2][NEt4] at 9.4 T. vrot = 15.0 kHz. The downwards arrows denotes isotropic shifts of the CF3 carbons and dashed lines indicate isotropic shifts from the NEt4 cation and [Pt(tfd)2][NEt4]2. All
other peaks are spinning sidebands 173
5.7 Temperature dependence of 5tot for [Pt(tdf)2][NEt4]. (a)' 9F-13C CP/MAS VT data with slope = -1.5(l)x 1(T3, intercept = 76.5(16.3) and R2 = 0.979. 19F MAS VT data for (b) siteFl with slope = 4.1 (4) xlO"4, intercept =-30.2(5.1) and/?2 = 0.971 and(c)siteF2 with slope = 7.0(9)* 10~4, intercept = -36.0(11.5) and/?2 = 0.951. Solid lines represent
best linear fits of the data 175
5.8 19F MAS NMR at various temperatures of [Pt(tdf)2][NEt4] at 9.4 T. vrot = 16.5 kHz. The downwards arrows denotes isotropic peaks and all other peaks are spinning
sidebands unless indicated 176
5.9 Platinum CS tensor orientations for (a) [Pt(tfd)2]° and (b) [Pt(tfd)2]2\ Tensor
orientations are based on VWN+BP/TZP-Pt(4d) calculations 179
5.10 Occ and vir MOs involved in major paramagnetic shielding contributions for [Pt(tfd)2]° 182
5.11 Occ and vir MOs involved in major paramagnetic shielding contributions for
[Pt(tfd)2]2" 185
5.12 (a) Positive spin density plot and (b) l0B2g MO of [Pt(tfd)2]". Contour isovalue of 0.04
a.u. was used for both figures 190
6.1 Static 87Rb NMR spectra at 9.4 T of RbC104 acquired using: (a) a 4.0 mm coil (V! = 119 kHz) with the (i) 90-180 echo, (ii) 90-90 echo, and (iii) QCPMG pulse sequences, (b) a 1.6 mm coil (v, = 81 kHz) with the (i) 90-180 echo, and (ii) QCPMG pulse sequences; (c) a 4.0 mm coil with the (i) WURST-echo (vexc = 3.0 kHz) and (ii) WURST-QCPMG (vexc = 3.4 kHz) pulse sequences. Traces above the QCPMG spectra are echo co-added spectra generated by adding together all echoes from the QCPMG echo train. Inset at the top is the simulated spectrum
210
(b) a 1.6 mm microcoil with the (i) 90-180, (ii) 90-90 echo and (iii) QCPMG pulse sequences; and (c) a 4.0 mm coil with (i) WURST-echo and (ii) WURST-QCPMG pulse sequences. Spectra above the QCPMG spectra are echo co-added spectra generated by adding together all echoes from the QCPMG echo train. Inset: analytical
simulation based on spectra acquired at multiple magnetic fields 211
6.3 87Rb NMR spectra at 9.4 T of RbC104 using the 1.6 mm microcoil acquired with the (a) 90-180 echo, (b) 90-90 echo and (c) QCPMG pulse sequences. Traces above each QCPMG spectra in (c) are the QCPMG echo co-added spectra. Values on the left of each spectrum are the rf powers used when acquiring the spectrum
214
6.4 Static 7IGa NMR QCPMG spectra at 9.4 T of GaPcCl acquired using various rf field
strengths using a 1.6 mm coil 216
6.5 91Zr NMR QCPMG spectra of Na^rOs at 9.4 T acquired using (a) a 4.0 mm coil with the frequency-stepped method and (b) a microcoil. The top trace is an analytical
simulation of (a) 218
6.6 59Co NMR spectra at 9.4 T acquired using a microcoil and a rf power of 446 kHz. Top trace is an analytical simulation using NMR parameters from reference [48]. * denotes
FM radio signal interference 220
7.1 27A1 solid-state NMR spectra of MAO at 9.4 T. Top and bottom spectra were acquired using a non-spinning and rotated sample at 10.0 kHz, respectively
227
7.2 Numerically simulated 27A1 NMR spectra of [(MeAl)(OMe)]6 at various spinning
speeds using EFG parameters calculated in reference [4] 228
7.3 87Rb MQMAS spectrum of a microcrystalline RbN03 sample [6]. The indirect dimension (vertical axis) shows the separation of sites based on isotropic shifts and their corresponding line shapes when influenced by second-order quadrupolar interactions. The projected spectrum in the direct dimension represents a standard
MAS experiment 229
7.4 (a) Numerically simulated 195Pt NMR spectra and (b) platinum CS tensor orientations
Schemes:
3.1 Molecular structures of (a) AlMes3, (b) A1(NTMS2)3, (c) [Me2-Al(^i-OTHF)]2, and (d)
[Et2-Al(|ji-OTHF)]2. Hydrogen atoms were removed for clarity 52
4.1 Molecular structures of (a) tetrakisbenzonitrile copper(I) tetrafluoroborate ([Cu(PhCN)4][BF4]), (b) cyclopentadienyl copper(I) triethylphosphine (CpCuPEt3), (c)
cyclopentadienyl copper(I) triphenylphosphine (CpCuPPh3), (d)
tetramethylcyclopentadienyl copper(I) triphenylphosphine (CptCuPPh3), (e) pentamethylcyclopentadienyl copper(I) triphenylphosphine (Cp*CuPPh3), (f) tris(2,4,6-methoxyphenyl)phosphinecopper(I) chloride (ClCuP(2,4,6)3), (g) trimethylphosphine(hexafluoroacetylacetonato)copper(I) ((hfac)CuPMe3), (h)
(3-diketiminato copper(I) isocyanide ([Me3NN]Cu(CNAr), Ar = 2,6-Me2C6H3), (i) bis((mesityldiphenylphosphine)-(|i2-chloro)-copper(I)) ([ClCuPPh2Mes]2), (j) bis((mesityldiphenylphosphine)-(|X2-bromo)-copper(I)) ([BrCuPPh2Mes]2), (k) bis((mesityldiphenylphosphine)-(|i2-iodo)-copper(I)) ([ICuPPh2Mes]2), and stepped clusters (1) tetrameric triphenylphosphine copper(I) bromide ([BrCuPPh3]4- 2CHC13) and (m) tetrameric triphenylphosphine copper(I) iodide ([ICuPPh3]4)
97
5.1 Resonance structures of metal bisdithiolene complexes 150
5.2 Molecular structure of [Pt(tfd)2]z 153
List of Appendices
Appendix A: Supplementary Tables
A.3.1 Selected aluminum chemical shift tensor calculations for AlMes3, A1(NTMS2)3,
[Me2-AlCu-OTHF)]2 and [Et2-Al(//-OTHF)]2 238
A.3.2 Crystallographic data for AlMes3 and A1(NTMS2)3 239
A.3.3 Atomic coordinates of AlMes3 used in theoretical calculations 240
A.3.4 Atomic coordinates of A1(NTMS2)3 used in theoretical calculations 241
A.3.5 Atomic coordinates of [Me2-Al(|Li-OTHF)]2 used in theoretical calculations . 242
A.3.6 Atomic coordinates of [Et2-Al(|i-OTHF)]2 used in theoretical calculations . . 243
A.3.7 Predicted Vn, V22, V33, CQ, and T)Q values of AlMes3 and A1(NTMS2)3 by varying the
atomic distances 244
A.3.8 Effects on Mulliken charges by changing bond lengths of the first coordination
sphere of AlMes3 and A1(NTMS2)3 245
A.3.9 Mulliken analysis of AlMes3 and A1(NTMS2)3 246
A.3.10 Comparison of molecular orbital energies and qualitative descriptions of MOs of
AlMes3 and A1(NTMS2)3 248
A.3.11 Calculated SCF energies for aluminum complexes 249
A.4.1 Experimental parameters used in acquiring 65Cu NMR spectra 250
A.4.2 Experimental parameters used in acquiring 63Cu NMR spectra 251
A.4.3 Experimental parameters used in acquiring 31P CP/MAS NMR spectra 251
A.4.4 Experimental parameters used in acquiring 13C CP/MAS NMR spectra 251
A.4.5 Selected bond lengths and angles of the copper (I) compounds 252
A.4.7 G03 EFG calculations of Cp'CuPR3 (Cp' = Cp, Cpf, Cp*; R = Et, Ph) complexes 254
A.4.8 G03 EFG calculations of Cp'CuPR3 (Cp' = Cp, Cp^ Cp*; R = Et, Ph) complexes
using the 14s8p5d basis set on Cu 256
A.4.9 G03 EFG calculations of ClCuP(2,4,6)3, (hfac)CuPMe3 and [Me3NN]Cu(CNAr)
258
A.4.10 G03 EFG calculations of ClCuP(2,4,6)3, (hfac)CuPMe3 and [Me3NN]Cu(CNAr)
using the 14s8p5d basis set on the copper atom 259
A.4.11 G03 EFG calculations of [XCuPPh2Mes]2 (X = CI, Br, I) 260
A.4.12 G03 EFG calculations of [ICuPPh3]4-step cluster 261
A.4.13 G03 EFG calculations of [ICuPPh3]4-step cluster using the 14s8p5d basis set on the
copper atom 262
A.4.14 G03 EFT calculations of [BrCuPPh3]4-2CHCl3-step cluster 263
A4.15 G03 calculated EFG tensor coordinates for [(PhCN)4Cu][BF4] 264
A.4.16 G03 calculated EFG and CS tensor coordinates for CpCuPR3 (R = Et, Ph)
265
A.4.17 G03 calculated EFG and CS tensor coordinates for Cp'CuPPh3 (Cp' = Cpf, Cp*)
266
A.4.18 G03 calculated EFG tensor coordinates for ClCuP(2,4,6)3, (hfac)CuPMe3 and
[Me3NN]Cu(CNAr) 267
A.4.19 G03 calculated EFG and CS tensor coordinates for[XCuPPh2Mes]2 (X = CI, Br, I)
268
A.4.20 G03 calculated EFG tensor coordinates for [BrCuPPh3]4-2CHCl3 and [ICuPPh3]4
stepped clusters 269
A.4.21 ADF copper EFG calculations using the Amsterdam Density Functional (ADF)
software package 270
A.4.22 G03 RHF copper CSA calculations of the various copper(I) compounds
A.4.23 G03 B3LYP copper CSA calculations of the various copper(I) compounds
274
A.4.24 SCF Energies from G03 calculations for copper(I) compounds 277
A.5.1 Experimental parameters for 195Pt CP/CPMG NMR experiments 279
A.5.2 Experimental parameters for 195Pt MAS NMR experiments 279
A.5.3 Experimental parameters for 19F MAS NMR experiments 279
A.5.4 Experimental parameters for 19F-13C VACP/MAS NMR experiments . . . 280
A.5.5 Experimental parameters for 'H-13C VACP/MAS NMR experiments 280
A.5.6 Complete list of Gaussian 03 195Pt CS tensor calculations of [Pt(tfd)2]° . 281
A.5.7 Contributions to paramagnetic shielding from mixing of occ and vir MOs of
[Pt(tfd)2]° based on BLYP/TZP-Pt(4d) calculations 282
A.5.8 Contributions to paramagnetic shielding from mixing of occ and vir MOs of
[Pt(tfd)2]2" based on BLYP/TZP-Pt(4d) calculations 283
A.5.9 Composition of the MOs in [Pt(tfd)2]° from BLYP/TZP-Pt(4d) calculations . . . . 284
A.5.10 Composition of the MOs in [Pt(tfd)2]2" from BLYP/TZP-Pt(4d) calculations . . . 285
A.5.11 5tot theoretical calculations for the "ene" carbons of [Pt(tfd)2]~ 286
A.5.12 8tot theoretical calculations for the fluorine atoms of [Pt(tfd)2]~ 286
A.6.1 Experimental parameters used for 87Rb, 71Ga, 91Zr and 59Co NMR experiments ..
Appendix B: Supplementary Figures
B.3.1 MAS simulations of A1(NTMS2)3 showing the required spinning speed to average
out the second-order broadening of the powder pattern 289
B.3.2 Spectral processing comparison of (a) AlMes3 and (b) A1(NTMS2)3. Top traces
represent skyline projections and bottom traces are co-added. | indicates FM radio
signal interference 289
B.3.3 T2 decay calculations of (a) AlMes3, (b) A1(NTMS2)3, (c) [Me2-Al(//-OTHF)]2, and
(d) [Et2-Al(//-OTHF)]2 290
B.3.4 Simulation of CSA contribution to the breadth of the AlMes3 central transition
powder pattern. Experimentally determined NMR parameters (CQ = 48.2 MHz and
rjQ = 0.00) were used • 290
B.3.5 QCPMG (top), summed QCPMG echo (middle) and Hahn-echo (bottom) spectra
comparison for [Me2-Al(//-OTHF)]2. Skyline projection (a) and co-addition (b)
spectral processing are shown 291
B.3.6 QCPMG (top), summed QCPMG echo (middle) and Hahn-echo (bottom) spectra
comparison for [Et2-Al(//-OTHF)]2. Skyline projection (a) and co-addition (b)
spectral processing are shown 291
B.3.7 ORTEP drawing of (a) AlMes3 and (b) A1(NTMS2)3 (30% ellipsoids). Hydrogen
atoms have been removed for clarity 292
B.4.1 'H-13C CPMAS NMR spectra of (a) CpCuPEt3 (b) CpCuPPh3 (c) CpfCuPPh3 and
Cp*CuPPh3. * denotes spinning sidebands 292
B.4.2 'H-13C CPMAS NMR spectra of (a) ClCuP(2,4,6)3 and (b) [ICuPPh3]4. * denotes
spinning sidebands 293
B.4.3 'H-13C CPMAS NMR spectra of (a) (hfac)CuPMe3 and (b) [Me3NN]Cu(CNAr).
* denotes spinning sidebands 293
B.4.4 Powder X-ray diffraction patterns of (a) [(PhCN)4Cu][BF4] (b) CpCuPPh3, (c)
CpfCuPPh3 and (d) Cp*CuPPh3 294
B.4.5 Powder X-ray diffraction patterns of (a) ClCu(2,4,6)3 (b) (hfac)CuPMe3 (c)
[Me3NN]Cu(CNAr) and (d) [ICuPPh3]4 294
(c) Cp+CuPPh3 and (d) Cp*CuPPh3 295
B.4.7 Integrated intensity comparisons of between Hahn-echo and QCPMG experiments
and T2 measurements for CptCuPPh3 and Cp*CuPPh3 296
B.4.8 Simulated 65Cu NMR spectra of ClCuP(2,4,6)3 with (a) no CSA and (b) with Q =
2000 ppm and K = 1.0 . . . 297
B.4.9 (a) Full diagonalization (scale follows 65Cu Larmor frequency v0), (b) analytical
simulation, (c) numerical simulation and (d) experimental 65Cu NMR spectrum of
[ICuPPh2Mes]2 using CQ = 49.5 MHz, r)Q = 0.47 and Q. = 1000 ppm 297
B.4.10 65Cu NMR simulations of (a) without CSA and (b) with CSA for [ICuPPh2Mes]2.
Experimental spectrum is shown in (c). Dashed lines act as guides for comparison.
# denotes copper metal interference 298
B.4.11 Simulation of the satellite positions for the tetragonal site of [ICuPPh3]4 indicate
that the underlying pattern is not from the satellite transitions 298
B.4.12 Spectra comparison of the tetragonal site of [ICuPPh3]4 to show the presence of
CSA. From the top down, analytical simulations with and without CSA, QCPMG
echo addition and QCPMG spectra are shown respectively 299
B.4.13 31P CP/MAS NMR spectrum simulations for (hfac)CuPMe3 without (top trace) and
with (middle trace) the addition of A/. Bottom trace is the experimental spectrum. Dashed lines are guides for comparison of the simulations to the experimental
spectrum 299
B.4.14 Electron density maps of (a) CpCuPEt3, (b) CpCuPPh3, (c) CpfCuPPh3 and (d)
Cp*CuPPh3 300
B.5.1 (a) ]H-13C VACP/MAS NMR and (b) 19F-13C VACP/MAS NMR Spectra of
[Pt(tfd)2][NEt4] 300
B.6.1 71Ga QCPMG NMR spectrum at 9.4 T of GaPcCl using a 1.0 mm i.d. coil. 157680
scans were acquired across 21.9 hours. The S/N of the highest point of the
spectrum is 13.0 301
B.6.2 Frequency-stepped 71Ga NMR spectra acquired at (a) 9.4 T and (b) 21.1 T.
Simulation parameters used for both fields are given in the figure 301
B.6.3 87Rb QCPMG NMR spectra at 9.4 T of RbC104 using a 4.0 mm i.d. coil. Values on
302
B.6.4 Frequency-stepped 71Ga NMR spectra at 9.4 T of GaPcCl using Hahn-echo (left) and QCPMG (right) pulse sequences. Overlaid trace on the total QCPMG NMR spectrum is the QCPMG echo-added spectrum. Inset: Analytical simulation and
used to serve as the ideal line shape 302
B.6.5 Numerical simulations of GaPcCl 71Ga UWNMR spectra using various rf field
strengths 303
B.6.6 Frequency-stepped 91Zr NMR spectra at 9.4 T of Na^rOj using the QCPMG pulse
sequence 303
B.6.7 Numerical simulations of NajZrC^ 91Zr UWNMR spectra at 9.4 T using various rf
Appendix C: Copyright Permission Forms
C.l Permission to use Figure 3 and 5 from C. P. Slichter et al. Phys. Rev. B, 1982, 26,
3559 305
C.2 Permission to use Figure 5 from P. L. Bryant et al. J. Am. Chem. Soc, 2001,123,
12009 and Figure 3 from Frydman et al. J. Phys. Chem. A., 1999,103,430
306
C.3 Permission to use Figure 2 from A.P.M. Kentgen Geoderma, 1997, 80,271
307
C.4 Permission to use Figure 3 from D. Massiot et al. Solid State Nucl. Magn. Reson.,
List of Abbreviations
(2,4,6) tris-(2,4,6-methoxyphenyl)
ADF Amsterdam density functional
AO atomic orbital
B3LYP Becke's three parameter exchange functional with the correlation function of Lee, Yang and Parr
BLYP Becke's exchange functional with the correlation function of Lee, Yang, and Parr
BP
CS
CSA
CP
Cp
Cp*
Cpt
Cp'
^Pcent
CT
DFT
DZ
ECP
EFG
Et
Becke88 exchange with Perdew86 correlation functional
chemical shielding, chemical shift
chemical shielding anisotropy
cross-polarization
cyclopentadienyl, C5H5
pentamethylcyclopentadienyl, C5Me5
tetramethylcyclopentadienyl, CsHMe4
cyclopentadienyl with various coordinated ligands
geometric center of the Cp' ring
central transition
density functional theory
double-£ functional
effective core potential
electric field gradients
CH3CH2-FID free induction decay
FT Fourier transformation
G03, G98 Gaussian-03, Gaussian-98
GIAO
HBA
hfac
i.d.
MAS
Me
Mes
MG
MO
gauge including atomic orbitals
Herzfeld-Berger analysis
hexafluoroacetylacetonato ligand
inner diameter
magic angle spinning
methyl ligand,
CH3-mesityl ligand
Meiboom-Gill
molecular orbital
MPW1PW91 modified Perdew-Wang exchange functional with Perdew-Wang correlation functional
MQMAS multiple-quantum magic angle spinning
N.A. natural abundance
NMR nuclear magnetic resonance
NP nanoparticle
NQR nuclear quadrupole moment
NTMS2 bis(trimethylsilyl)amino ligand
o.d. outer diameter
ORTEP Oak Ridge thermal ellipsoid plot
OTHF tetrahydrofurfuryloxide
PAS principal axis system
Ph phenyl ligand,
C6H5-ppm parts per million
PW91VWN Perdew-Wang exchange functional with Vosk, Wilk, and Nusair correlation functional
PXRD powder X-ray diffraction
QCPMG quadrupole Carr-Purcell-Meiboom-Gill
QZ4P quadruple-^ quadruple polarized functional
rf radio frequency
rPBE revised Zhang-Wang exchange and Perdew-Burke-Ernzerhof correlation functional
RHF, UHF restricted Hartree-Fock, unrestricted Hartree-Fock
S/N signal-to-noise ratio
SCF self consistent field
ST satellite transition
SSNMR solid-state nuclear magnetic resonance
tfd (trifluoromethyl)dithiolene ligand
THF tetrahydrofuran
TMS tetramethyl silane
TPPM two pulse phase-modulation
UWNMR ultra-wideline nuclear magnetic resonance
VACP variable amplitude cross-polarization
vir virtual (or unoccupied) molecular orbital
VT variable temperature
VWN Vosk, Wilk, and Nusair correlation functional
WURST wideband, uniform rate, and smooth truncation
XRD X-ray diffraction
List of Symbols
o,P
aD,pD
a, P,Y
A
Bo
B,
Bind
B,ot
CQ
d
Dc
A5
An
spin-up, spin-down states
dipolar angles
Euler angles
hyperfine coupling constant
static magnetic field
oscillating magnetic field
induced magnetic field
total magnetic field
quadrupole coupling constant
residual dipole-dipole coupling constant
receptivity relative to 13C
shielding anisotropy
integrated intensity of a difference specti
8 reduced anisotropy
5n, 522, 53 3 principal chemical shift tensor components (standard and H B convention)
5dip dipolar chemical shift
5F C Fermi contact chemical shift
8hf hyperfine chemical shift
8iso isotropic chemical shift
5tot total chemical shift
8XX, 8yy, 5 ^ principal chemical shift tensor components (Haeberlen convention)
Ea a spin state energy level
Ep P spin state energy level
e elementary charge
eQ nuclear quadrupole moment
Gm gain in signal-to-noise ratio
ix> 8y> Sz principal g-tensor components
T) shielding asymmetry parameter
T|Q quadrupole asymmetry parameter
y gyromagnetic ratio
h, ft Planck constant
/ spin quantum number
I angular momentum vector
/ spin operator
I+ raising operator
/_ lowering operator
A/ indirect spin-spin coupling anisotropy
/ indirect spin-spin coupling constant
Jiso isotropic indirect spin-spin coupling
Ln angular momentum operator
M spin magnetization
\x, nuclear spin magnetic moment
|Xo v a c u u m permeability
Na spin population of the a state
Np spin population of the p state
v0 Larmor frequency
v, rf oscillating frequency
v7 L a r m o r frequency of nucleus /
vQ quadrupole frequency
vrot rotational frequency
Q. span of the chemical shielding tensor
RDD direct spin-spin (dipole-dipole) coupling constant
i?eff effective dipole-dipole coupling
is chemical shielding tensor
a , „ a2 2, a3 3 principal chemical shielding tensor components
Gd diamagnetic shielding
Giso isotropic shielding
aisoref isotropic shielding of reference c o m p o u n d
op paramagnetic shielding
QpCocc-vir) paramagnetic shielding contribution from mixing of occ-vir orbitals
r ^ internuclear distance between atoms A and B
pap spin density
xa acquisition time
Tp pulse width
r , longitudinal relaxation time constant
T2 transverse relaxation time constant
T2* effective transverse relaxation time constant
0p tip angle
6R rotational angle
0 angle between V33 and B0.
V E F G tensor
Vu, V22, V33 principal E F G tensor components
co0 Larmor frequency
CO, oscillating frequency of applied pulse
0)rf oscillating frequency of rotating frame
Chapter 1
Introduction
Since the work of Rabi over 70 years ago,[1] nuclear magnetic resonance (NMR) has
evolved into one of the widely used spectroscopic techniques because of its sensitivity to
changes in local atomic environments. Solution NMR spectroscopy of receptive and
ubiquitous nuclei, such as 'H, 13C, 19F, 15N and 31P, is commonly employed to characterize
molecular structures, examine molecular dynamics, and monitor inter- and intra-molecular
interactions in chemical and biological materials/2"61 and serves as a complementary
technique to other characterization methods such as infrared and UV-vis spectroscopy.
While liquid-state NMR is prevalent in synthetic chemistry and structural biology, solid-state
NMR (SSNMR) has emerged as a technique for studying insoluble small molecules and
complex solid biological systems/7"101 as well as solid materials, including zeolites/7'111
glasses/7,12'131 and self-assembled monolayers/14'151 Compared to solution NMR, SSNMR
provides more information about the atomic/molecular environment because of the
anisotropic nature of powdered/solid samples. Powder patterns obtained from SSNMR
experiments can yield not only the isotropic chemical shift, but also the anisotropic NMR
parameters such as the quadrupole coupling constant, span, asymmetry parameters, etc.
Unfortunately, acquisition of these spectra can be difficult because of their much broader
spectral widths and lower resolutions. Most often, wideline NMR spectroscopy is used to
acquire these broad NMR powder patterns.
powder patterns with large spectral breadths ranging from tens of kHz to between 250 and
300 kHz.[16"23] Wideline NMR studies are commonly associated with static 2H SSNMR,
since these spectra can be broader than 100 kHz; however, they have also been used for static
'H and 13C NMR spectroscopy. Wideline NMR spectroscopy is used for a number of
applications, most commonly for investigating molecular structures, dynamics and motions
of inorganic, (bio)organic and biological compounds/19'24"30^ but have also been used for in
the past for quantitative analysis of oil and moisture in carbohydrate materials and
ceramics.[31"33) Over the past 20 years, there have been significant advancements in NMR
spectroscopy, allowing for the development of more sophisticated NMR techniques. For
instance, a commonly used wideline experiment is the 2D wideline separation (WISE) pulse
sequence that was developed by Spiess et al.[34] This experiment is based on the coupling
interactions between nuclei, most often between 2H and 13C. In the direct dimension, a
high-resolution 13C NMR spectrum is acquired, while indirectly acquiring 'H or 2H wideline NMR
spectra. The 'H or 2H wideline spectra can be correlated to the carbon to which it is coupled
based on the corresponding high-resolution 13C NMR spectrum of the direct dimension. The
WISE experiment has been applied to obtain structural and dynamic information at the
molecular level for a number of systems, such as organic solids, polymers, clay materials,
and self-assembled monolayers.[14'35'39]
Although this method is ideal for spectra that are less than 200 kHz in breadth and
most often involves correlations between 'H, 2H, or 13C nuclei, there are many situations
where other nuclei, such as metals, are of greater importance to the system and its properties.
atoms which dictate their structure, reactivity and dynamics. In many cases these nuclei are
unreceptive to NMR because of factors such as low natural abundance, low gyromagnetic
ratios (vide infra), dilute spins, large NMR interactions, or combinations of these factors,
producing broad, low-resolution spectra.[310] There are a number of methods that have been
developed to obtain high-resolution spectra such as magic angle spinning (MAS),[40'41J
multiple quantum MAS (MQMAS),[42] double rotation (DOR),[43] and dynamic angle
spinning (DAS),[44] but are limited to nuclei with relatively small anisotropic interactions.
For cases where large anisotropic interactions are present, extremely broad patterns can occur
which cannot be acquired using routine NMR methods.
In order to acquire extremely broad patterns, a variety of methods have been
developed, including stepped-frequency, field-sweep, and frequency-stepped NMR
spectroscopy. To distinguish these methods from other standard wideline NMR experiments,
the term "ultra-wideline NMR" (UWNMR) will be used herein as a general name for all
techniques utilized for the acquisition of powder patterns greater than 300 kHz in breadth.
The stepped-frequency technique was introduced by Sindorf and Bartuska, who used variable
frequency pulses to acquire UWNMR spectra. [45'46] In this method, a weak pulse is applied
and then a single point is acquired. The transmitter frequency is then changed, then another
weak pulse is applied and a point is acquired again. This cycle is repeated until the carrier
frequency moves across the entire pattern or the desired frequency range. The entire process
is repeated until a sufficient signal-to-noise ratio (S/N) is achieved. This method is suitable
for cases where adequate pulse powers cannot be achieved; however, current NMR systems
The field-sweep and frequency-stepped NMR experiments are based on similar
principles. For the field-sweep technique, the magnetic field strength is varied while the
transmitter frequency remains constant. The field strength can be controlled by applying a
current through a superconducting coil mounted in the bore of the magnet to surround the
sample holder or probehead. After the current is applied, the magnetic field is allowed to
stabilize and then a spin-echo spectrum is acquired using soft pulses. This process is then
repeated until the field is swept across the desired frequency range. The intensities or
integrated areas of the echoes are measured and plotted as a function of the magnetic field
(or frequency).[47] This method is often referred to as the point-by-point method. The
field-sweep technique has been used to study a variety of nuclei such as platinum, titanium, zinc
and aluminum, in various types of systems.[48"53] Slichter et al. have used the point-by-point
field-sweep NMR method to examine the surface structure of platinum nanoparticles (Figure
1.1). Clear distinctions between the core and surface platinum sites can be seen at different
loading levels. For high resolution spectra, smaller increments in the field strength would
be required increasing the number of experiments to be performed. This can be extremely
time-consuming and tedious for ultra-wideline patterns. This method can be automated,
though specialized instrumentation is required.[53]
The frequency-stepped method is similar to field-sweep NMR spectroscopy; the
transmitter frequency is stepped across a frequency range, acquiring a spin-echo at each
frequency, while the magnetic field is kept constant. There are two variations of this method.
Figure 1.1: Schematics of a clean and coated Pt nanoparticle (left). From the 195Pt field-sweep NMR, the resonance at low field corresponds to the surface Pt atoms and at high field from the core Pt atoms. Reprinted figure with permission from reference [50]. Copyright 2008 by the American Physical Society.
field-sweep NMR (Figure 1.2a).t47'54"56] Similar drawbacks are associated with this method,
making the acquisition of broad spectra very inefficient. Bryant et al. have used this method
to examine an (aminato)hexaluminum cluster.[56] In order to acquire a spectrum that is ca.
150 kHz in breadth, a total experimental time of 46 hours was required. Thus, it could
potentially take a week, a month, or even longer to acquire an UWNMR spectrum with this
technique. A more efficient method for acquiring UWNMR spectra is with the variable
offset cumulative spectra (VOCS) method.[57'58] Strong rf pulses are applied to excite spins
across a greater frequency region. Rather than measuring the intensity or integrated area of
sub-(a) (b) SiWBCrtV/Br W f
A) expt.
B) sim.
_J«_ J
m MO » o - s o -M» ->»
»&<*<» «Ufe) »O»A0I#»3
Figure 1.2: Frequency-stepped (point-by-point) 27A1NMR experiment at 9.4 T on an
(aminato)hexaluminum cluster (a). Top and bottom traces are experimental and simulated spectra. 59Co NMR variable offset cumulative spectra at 11.8 T of [(Py)2CoPc]Br (b). Left are the experimental sub-spectra and right are simulations. Inset spectrum represents the ideal line shape. Figures reprinted with permission from references [56] and [58]. Copyright 2008 American Chemical Society.
spectra can be added together or skyline projected to produce the final spectrum. Since a
wider spectral range (ca. 100 kHz) is accounted for using this method, much fewer frequency
positions are required, reducing the total number of experiments. Frydman et al. used the
VOCS experiment to acquire a 59Co UWNMR spectrum of [(Py)2CoPc]Br, that is ca. 525
kHz in breadth, in ca. 17 hours (Figure 1.2b). Compared to the point-by point 27A1 NMR
experiment by Bryant et al., the VOCS technique was able to acquire a spectrum that is 3.5
times broader in nearly 37 % of the experimental time.
Using the Hahn-echo pulse sequence with the VOCS method is common for
UWNMR experiments, but for extremely unreceptive nuclei, this is inadequate for acquiring
NMR spectra with high S/N in a reasonable amount of time. Pulse sequences such as double
(RAPT),[63] cross-polarization (CP),[64] and (quadrupole) Carr-Purcell-Meiboom-Gill
((Q)CPMG)[65"67] have been shown to substantially improve S/N compared to corresponding
Hahn-echo experiments. DFS and HS are impossible to implement for acquiring UWNMR
spectra, since adiabatic field sweeps cannot be achieved on current NMR spectrometers. In
addition, they are impractical since some approximate knowledge of the magnitude of the
quadrupolar interaction is required in order to properly set up the experiment for optimal
performance. The QCPMG pulse sequence is commonly applied with VOCS-style UWNMR
to enhance the S/N and greatly reduce the number of acquisitions for each sub-spectrum.
Further enhancement of S/N has been achieved by coupling DFS, HS, RAPT and CP with
the QCPMG pulse sequence^61'68"711 but of these, only CP has been successfully applied for
UWNMR experiments. Another way of enhancing the S/N is to perform UWNMR
experiments at extremely low temperatures (4 - 25 K). Ellis et al. have carried out
CP/QCPMG UWNMR experiments at low temperatures on a number of bioinorgnic
compounds.[72"75] For instance, when implementing the CP/QCPMG pulse sequence at 10 K,
a significant increase in S/N was achieved which allowed the acquisition of a 400 kHz broad
67Zn NMR spectrum.[73] The combination of signal enhancement techniques with UWNMR
spectroscopy can provide a means to study unreceptive nuclei that were once believed to be
difficult to examine, notably, nuclei which are diluted (i.e., small % of the total mass) by the
nature of their environments (e.g., metals in proteins, macromolecules, porous solids; acting
as dopants, etc.).
In this thesis, we will explore various UWNMR methods and their application to
produce ultra-wideline patterns caused by large NMR interactions. In order to understand
the context of this research, a discussion of basic NMR interactions and their spectral
manifestations are required. Chapter 2 provides this information, as well as general concepts
pertaining to the NMR methods that are of great importance in these studies.
Chapter 3 discusses the application of 27A1 solid-state UWNMR spectroscopy to a
series of thee- and five-coordinate aluminum compounds. Spectra as large as ca. 800 kHz
are acquired and used to obtain the NMR tensor parameters at the aluminum center.
Complementary techniques, such as X-ray diffraction and ab initio calculations, are also
employed to correlate the measured NMR parameters with the molecular and electronic
structures.
Chapter 4 provides a discussion on the use of 63/65Cu solid-state UWNMR
spectroscopy for series of inorganic and organometallic copper(I) compounds. Spectra are
as broad as 6.4 MHz, which is six to eight orders of magnitude broader than peaks typically
observed in solution NMR experiments. 31P NMR spectroscopy is also performed to
experimentally determine the electric field gradient tensor orientations with respect to the
molecular frames as well as the signs of the copper quadrupole coupling constants.
Theoretical calculations are again used to provide an explanation for the observed NMR
parameters and their relationships to the molecular and electronic structure.
In Chapter 5, multinuclear solid-state NMR spectroscopy and first principles
calculations are employed to investigate the molecular and electronic structures of the
platinum bisdithiolene series [Pt(tfd)2]zlNEt4]z+ (z = 0, 1, 2). 195Pt, I3C and 19F solid-state
Variable-temperature 13C and 19F NMR spectroscopy are utilized to determine the
localization of electron spin densities of the paramagnetic complex. Theoretical calculations
are also discussed to complement the NMR results and to explain the origins of the large
chemical shielding interaction at the platinum centres.
To date, most UWNMR experiments are performed by acquiring the large spectrum
in sections and co-adding or projecting the sub-spectra; this can be a tedious task for
extremely broad patterns; hence, there are many ways that UWNMR may be improved.
Chapter 6 explores two different approaches; probe modifications and specialized pulse
sequences. Microcoils, arbitrarily defined as solenoid coils with inner diameters less than
1.0 mm, have been introduced for a variety of solid-state NMR experiments.[76"79] By
reducing coil dimensions, stronger rf fields can be generated, which can excite broader
spectral regions. In situations where microcoils may not be suitable, specially crafted
adiabatic pulses are another viable option. A preliminary explanation of frequency-swept
Bibliography
[I] Rabi, 1.1. Phys. Rev. 1937, 51, 652.
[2] Mason, J. Chem. Rev. 1981, 81, 205.
[3] Gladden, L. F. Chem. Eng. Sci. 1994, 49, 3339.
[4] Dyson, H. J.; Wright, P. E. Insights into the structure and dynamics of unfolded
proteins from nuclear magnetic resonance. In Unfolded Proteins, 2002; Vol. 62, pp 311.
[5] Pellecchia, M. Chem. Biol. 2005,12, 961.
[6] Grant, D. M.; Harris, R. K. Encyclopedia of Nuclear Magnetic Resonance', Wiley:
New York, 1996.
[7] Dybowski, C ; Bai, S.; van Bramer, S. Anal. Chem. 2004, 76, 3263.
[8] Legrand, A. P.; Bresson, B.; Guidoin, R.; Famery, R. J. Biomed. Mater. Res. 2002,
63, 390.
[9] Baldus, M. Curr. Opin. Struct. Biol. 2006,16, 618.
[10] Hong, M. Structure 2006,14, 1731.
[II] Suib, S. L. Chem. Rev. 1993, 93, 803.
[12] Eckert, H. Angew. Chem.-Int. Edit. 1989, 28, 1723.
[13] Eckert, H. Prog. Nucl. Magn. Reson. Spectrosc. 1992, 24,159.
[14] Gao, W.; Dickinson, L.; Grozinger, C ; Morin, F. G.; Reven, L. Langmuir 1996,12,
6429.
[15] Badia, A.; Lennox, R. B.; Reven, L. Accounts Chem. Res. 2000, 33, 475.
[17] Levy, H.; Grizzle, E. J. Chem. Phys. 1966, 45, 1954.
[18] Rupprecht, A. Acta Chem. Scand. 1966, 20, 582.
[19] Silbernagel, B. G.; Dines, M. B.; Gamble, F. R.; Gebhard, L. A.; Whittingham, M.
S. J. Chem. Phys. 1976, 65, 1906.
[20] Silbernagel, B. G.; Gamble, F. R. J. Chem. Phys. 1976, 65,1914.
[21] Zeigler, R. C ; Maciel, G. E. J. Am. Chem. Soc. 1991,113, 6349.
[22] Spooner, P. J. R.; Watts, A. Biochemistry 1991, 30, 3871.
[23] Pschorn, U.; Rossler, E.; Sillescu, H.; Kaufmann, S.; Schaefer, D.; Spiess, H. W.
Macromolecules 1991, 24, 398.
[24] Seelig, J. Q. Rev. Biol. 1977,10, 353.
[25] Mantsch, H. H.; Saito, H.; Smith, I. C. P. Prog. Nucl. Magn. Reson. Spectrosc.
1971,11,211.
[26] Smith, R. L.; Oldfield, E. Science 1984, 225, 280.
[27] Jelinski, L. W. Annu. Rev. Mater. Sci. 1985,15, 359.
[28] Spiess, H. W. Annu. Rev. Mater. Sci. 1991,21,131.
[29] Palmer, A. G.; Williams, J.; McDermott, A. J. Phys. Chem. 1996,100, 13293.
[30] Laws, D. D.; Bitter, H. M. L.; Jerschow, A. Angew. Chem.-Int. Edit. 2002, 41, 3096.
[31] Bartholomew, R. F.; Schreurs, J. W. H. J. Non-Cryst. Solids 1980, 38-9, 679.
[32] Robertson, J. A.; Morrison, W. H. J. Am. Oil Chem. Soc. 1979, 56, 961.
[33] Alexander, D. E.; Silvela, L.; Collins, F. I.; Rodgers, R. C. J. Am. Oil Chem. Soc.
1967, 44, 555.
[35] Clauss, J.; Schmidt-Rohr, K.; Adam, A.; Boeffel, C ; Spiess, H. W. Macromolecules
1992,25, 5208.
[36] Cai, W. Z.; Schmidt-Rohr, K.; Egger, N.; Gerharz, B.; Spiess, H. W. Polymer 1993,
34,267.
[37] Landfester, K.; Boeffel, C ; Lambla, M.; Spiess, H. W. Macromolecules 1996, 29,
5972.
[38] Antonietti, M.; Radloff, D.; Wiesner, U.; Spiess, H. W. Macromol. Chem. Phys.
1996,197,2713.
[39] Wang, L. Q.; Liu, J.; Exarhos, G. J.; Flanigan, K. Y.; Bordia, R. J. Phys. Chem. B
2000,704,2810.
[40] Andrew, E. R.; Bradbury, A.; Eades, R. G. Nature 1958,182, 1659.
[41] Lowe, I. J. Phys. Rev. Lett. 1959, 2,285.
[42] Medek, A.; Harwood, J. S.; Frydman, L. J. Am. Chem. Soc. 1995,117, 12779.
[43] Samoson, A.; Lippmaa, E.; Pines, A. Mol. Phys. 1988, 65, 1013.
[44] Mueller, K. T.; Sun, B. Q.; Chingas, G. C.; Zwanziger, J. W.; Terao, T.; Pines, A. J.
Magn. Reson. 1990, 86, 470.
[45] Sindorf, D. W.; Bartuska, V. J. J. Magn. Reson. 1989, 85, 581.
[46] Kennedy, M. A.; Void, R. L.; Void, R. R. J. Magn. Reson. 1991, 92, 320.
[47] Clark, W. G.; Hanson, M. E.; Lefloch, F.; Segransan, P. Rev. Sci. Instrum. 1995, 66,
2453.
[48] Narath, A. Phys. Rev. 1967,162, 320.
![Figure 3.8: Theoretical 27A1EFG tensor orientations of (a) AlMes3, (b) A1(NTMS2)3, (c) [Me2-Al(//-OTHF)]2, and (d) [Me2-Al(//-OTHF)]2](https://thumb-us.123doks.com/thumbv2/123dok_us/1469997.1180100/113.615.141.506.62.431/figure-theoretical-tensor-orientations-almes-ntms-othf-othf.webp)
![Figure 4.4: 65Cu Static QCPMG spectra of (a) [ClCuPPh2Mes]2, (b) [BrCuPPh2Mes]2 and (c) [ICuPPh2Mes]2](https://thumb-us.123doks.com/thumbv2/123dok_us/1469997.1180100/154.615.117.520.60.549/figure-static-qcpmg-spectra-clcupph-mes-brcupph-icupph.webp)
![Figure 4.8: 'H-31P CP/MAS NMR of (a) ClCuP(2,4,6)3, (b) (hfac)CuPMe3, (c) [ClCuPPh2Mes]2, (d) [ICuPPh2Mes]2 and (e) [BrCuPPh2Mes]2](https://thumb-us.123doks.com/thumbv2/123dok_us/1469997.1180100/163.792.137.679.63.432/figure-mas-clcup-cupme-clcupph-icupph-mes-brcupph.webp)