Available Online atwww.ijcsmc.com
International Journal of Computer Science and Mobile Computing
A Monthly Journal of Computer Science and Information Technology
ISSN 2320–088X
IJCSMC, Vol. 3, Issue. 9, September 2014, pg.82 – 95
RESEARCH ARTICLE
Detection and Localization of Multiple
Spoofing Attackers in Wireless Networks
1
R.Suguna,
2R.Ramya
1
Department of Computer Science, Periyar University, TamilNadu, India
1[email protected]
2Department of Computer Science, Periyar University, TamilNadu, India
2[email protected]
Abstract— Wireless spoofing attacks are easy to launch and can significantly impact the performance of
networks. Although the identity of a node can be verified through cryptographic authentication, conventional
security approaches are not always desirable because of their overhead requirements. In this paper, we propose
to use spatial information, a physical property associated with each node, hard to falsify, and not reliant on
cryptography, as the basis for 1) detecting spoofing attacks; 2) determining the number of attackers when
multiple adversaries masquerading as the same node identity; and 3) localizing multiple adversaries. We propose
to use the spatial correlation of received signal strength (RSS) inherited from wireless nodes to detect the
spoofing attacks. We then formulate the problem of determining the number of attackers as a multiclass
detection problem. Cluster-based mechanisms are developed to determine the number of attackers. When the
training data are available, we explore using the Support Vector Machines (SVM) method to further improve the
accuracy of determining the number of attackers. In addition, we developed an integrated detection and
localization system that can localize the positions of multiple attackers. We evaluated our techniques through two
testbeds using both an 802.11 (WiFi) network and an 802.15.4 (ZigBee) network in two real office buildings. Our
experimental results show that our proposed methods can achieve over 90 percent Hit Rate and Precision when
determining the number of attackers. Our localization results using a representative set of algorithms provide
strong evidence of high accuracy of localizing multiple adversaries.
Index Terms— Wireless network security, spoofing attack, attack detection, localization
1.
INTRODUCTION
masquerade as another device. In spite of existing 802.11 security techniques including Wired Equivalent Privacy (WEP), WiFi Protected Access (WPA), or 802.11i (WPA2), such methodology can only protect data frames—an attacker can still spoof management or control frames to cause significant impact on networks. Because of its infrastructural, computational, and management overhead. Further, cryptographic methods are susceptible to node compromise, which is a serious concern as most wireless nodes are easily accessible, allowing their memory to be easily scanned. In this work, we propose to use received signal strength (RSS)-based spatial correlation, a physical property associated with each wireless node that is hard to falsify and not reliant on cryptography as the basis for detecting spoofing attacks. Since we are concerned with attackers who have different locations than legitimate wireless nodes, utilizing spatial information to address spoofing attacks has the unique power to not only identify the presence of these attacks but also localize adversaries. An added advantage of employing spatial correlation to detect spoofing attacks is that it will not require any additional cost or modification to the wireless devices
themselves.
We focus on static nodes in this work, which are common for spoofing scenarios [7]. We addressed spoofing detection in mobile environments in our other work [8]. The works that are closely related to us are [3], [7], [9]. Faria and Cheriton [3] proposed the use of matching rules of signalprints for spoofing detection, Sheng et al. [7] modeled the RSS readings using a Gaussian mixture model and Chen et al. [9] used RSS and K-means cluster analysis to detect spoofing attacks. However, none of these approaches have the ability to determine the number of attackers when multiple adversaries use the same identity to launch attacks, which is the basis to further localize multiple adversaries after attack detection. Although Chen et al. [9] studied how to localize adversaries, it can only handle the case of a single spoofing attacker and cannot localize the attacker if the adversary uses different transmission power levels.
The main contributions of our work are: 1) GADE: a generalized attack detection model (GADE) that can both detect spoofing attacks as well as determine the number of adversaries using cluster analysis methods grounded on RSS-based spatial correlations among normal devices and adversaries; and 2) IDOL: an integrated detection and localization system that can both detect attacks as well as find the positions of multiple adversaries even when the adversaries vary their transmission power levels.
In GADE, the Partitioning Around Medoids (PAM) cluster analysis method is used to perform attack detection. We formulate the problem of determining the number of attackers as a multiclass detection problem. We then applied cluster-based methods to determine the number of attacker. We further developed a mechanism called SILENCE for testing Silhouette Plot and System Evolution with minimumdistance of clusters, to improve the accuracy of determining the number of attackers. Additionally, when the training data are available, we propose to use the Support Vector Machines (SVM) method to further improve the accuracy of determining the number of attackers.
Moreover, we developed an integrated system, IDOL, which utilizes the results of the number of attackers returned by GADE to further localize multiple adversaries. As we demonstrated through our experiments using both an 802.11 network as well as an 802.15.4 network in two real office building environments, GADE is highly effective in spoofing detection with over 90 percent hit rate and precision. Furthermore, using a set of representative localization algorithms, we show that IDOL can achieve similar localization accuracy when localizing adversaries to that of under normal conditions. One key observation is that IDOL can handle attackers using different transmission power levels, thereby providing strong evidence of the effectiveness of localizing adversaries when there are multiple attackers in the network.
The rest of the paper is organized as follows. We place our work in the context of related research in Section 2. We provide our theoretical analysis and describe the generalized attack detection model in Section 3. We formulate the problem of determining the number of attackers using multiclass detection and propose our cluster-analysis-based mechanisms in Section 4. In Section 5, we present IDOL, theintegrated detection and localization system. Finally, we conclude our work in Section 6.
2.
RELATED WORK
The traditional approach to prevent spoofing attacks is to use cryptographic-based authentication [5], [6], [10]. Wu et al. [5] have introduced a secure and efficient key management (SEKM) framework. SEKM builds a Public Key Infrastructure (PKI) by applying a secret sharing scheme and an underlying multicast server group. Wool [6] implemented a key management mechanism with periodic key refresh and host revocation to prevent the compromise of authentication keys. An authentication framework for hierarchical, ad hoc sensor networks is proposed in [10]. However, the crypto-graphic authentication may not be always applicable because of the limited resources on wireless devices, and lacking of a fixed key management infrastructure in the wireless network.
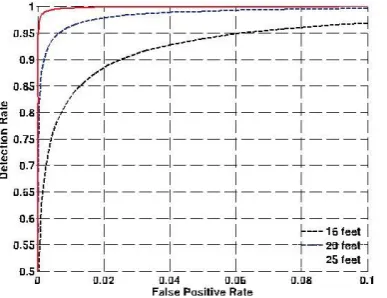
Fig. 1. The ROC curves when the distance between two wireless devices is 16, 20, and 25 feet, respectively. The standard deviation of shadowing is 2 dB. The path loss exponent is 2.5.
Fig. 2. The ROC curves when the standard deviation of shadowing is 2, 3, and 4 dB, respectively. The distance between two devices is 25 feet.
where F Xð_Þ is the Cumulative Distribution Function (CDF) of the random variable X.
From (7) and (8), for a specified detection rate DR, the threshold of test can be obtained as
_ ¼ 2_2F __21ðn;_=2_2 Þð1 _ DRÞ; ð9Þ
and the false positive rate can be represented in terms of the detection rate
FPR ¼ 1 _ F _2 ðnÞ_F __21ðn;_=2_2Þð1 _ DRÞ_: ð10Þ
From (7), we can see that the detection rate DR increases with _, which can be represented by the distance between two wireless nodes together with the landmarks. Moreover, for a specified detection rate DR, (10) shows that the false positive rate FPR increases with the standard deviation of shadowing _.
We next study the detection power of our approach by using the RSS-based spatial correlation. Fig. 1 presents the numerical results of receiver operating characteristic (ROC) curves based on (7) and (8) when randomly placing two wireless devices in a 100 by 100 feet square area. There are four landmarks deployed at the four corners of the square area. The physical distance between two wireless devices is 16, 20, and 25 feet, respectively. The path loss exponent _ is set to 2.5 and the standard deviation of shadowing is 2 dB. From the figure, we observed that the ROC curves shift to the upper left when increasing the distance between two devices. This indicates that the farther away the two nodes are separated, the better detection performance that our method can achieve. This is because the detection performance is proportional to the noncentrality parameter _, which is represented by the distance between two wireless nodes together with the landmarks.
We further investigate the detection performance of our approach under RSS variations. In this study, we fixed the distance between two wireless devices as 25 feet. The obtained ROC curves when the standard deviation of shadowing is set to 2, 3, and 4 dB, respectively, is shown in Fig. 2. From the figure, it can be seen that we can obtain better detection performance with lower standard deviation of shadowing _. A larger standard deviation of shadowing causes the two distributions, i.e., noncentral
chi-square and central chi-square, to get closer to one another. Consequently, the smaller standard deviation of shadowing _ results
2.2 Attack Detection Using Cluster Analysis
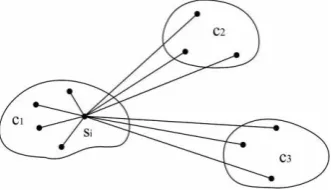
The above analysis provides the theoretical support of using the RSS-based spatial correlation inherited from wireless nodes to perform spoofing attack detection. It also showed that the RSS readings from a wireless node may fluctuate and should cluster together. In particular, the RSS readings over time from the same physical location will belong to the same cluster points in the n -dimensional signal space, while the RSS readings from different locations over time should form different clusters in signal space. We illustrated this important observation in Fig. 3, which presents RSS reading vectors of three landmarks (i.e., n¼3) from two different physical locations. Under the spoofing attack, the victim and the attacker are using the same ID to transmit data packets, and the RSS readings of that ID is the mixture readings measured from each individual node (i.e., spoofing node or victim node). Since under a spoofing attack, the RSS readings from the victim node and the spoofing attackers are mixed together, this observation suggests that we may conduct cluster analysis on top of RSS-based spatial correlation to find out the distance in signal space and further detect the presence of spoofing attackers in physical space.
In this work, we utilize the Partitioning Around Medoids Method to perform clustering analysis in RSS. The PAM Method [26] is a popular iterative descent clustering algorithm. Compared to the popular K-means method [9], the PAM method is more robust in the presence of noise and outliers. Thus, the PAM method is more suitable in determining clusters from RSS streams, which can be unreliable and fluctuating over time due to random noise and environmental bias [27].
We thus formulate spoofing detection as a statistical significance testing problem, where the null hypothesis is
H0 : normal ðno spoofing attackÞ:
In significance testing, a test statistic T is used to evaluate whether observed data belong to the null-hypothesis or not. In particular, in our attack detection phase, we partition the RSS vectors from the same node identity into two clusters (i.e., K¼2) no matter how many attackers are using this identity, since our objective in this phase is to detect the presence of attacks. We then choose the distance between two medoids Dm as the test statistic T in our significance testing for spoofing detection, Dm¼ kMi_Mjk, where Mi and Mj
are the medoids of two clusters. Under normal conditions, the test statistic Dm should be small since there is basically only one cluster from a single physical location. However, under a spoofing attack, there is more than one node at different physical locations claiming the same node identity. As a result, more than one clusters will be formed in the signal space and Dm will be large as the medoids are derived from the different RSS clusters associated with different locations in physical space.
2.3 Evaluation Strategy
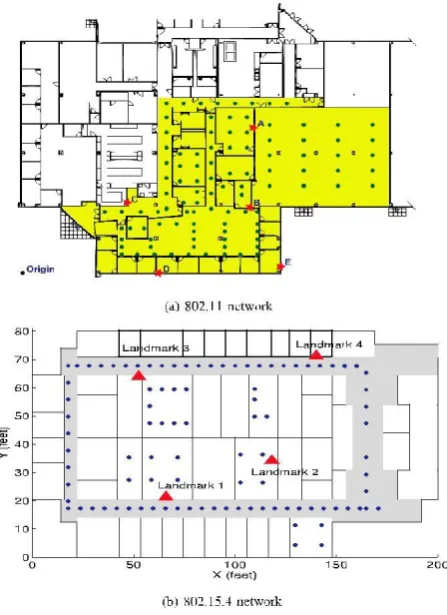
To test the performance of our attack detection approach, we evaluate our approach in real office building environ-ments. We conducted experiments in two office buildings: one is the Wireless Information Network Laboratory (WINLAB) using an 802.11 (WiFi) network and the other is the Computer Science Department at Rutgers University using an 802.15.4 (ZigBee) network as presented in Fig. 4. The wireless devices we consider here are a Dell laptop running Linux and equipped with an Orinoco silver card (for the 802.11 network) and a Tmote Sky mote (for the 802.15.4 network). The size of these two floors are 219 ft _ 169 ft and 200 ft _ 80 ft, respectively. Fig. 4a shows five landmarks in red stars in the 802.11 networks to maximize the coverage, whereas there are four landmarks deployed as red triangles in the 802.15.4 network to achieve optimal landmark placement [17], shown in Fig. 4b. We note that the deployment of landmarks has important impact on the detection performance, which is similar to the wireless localization [17]. Each landmark is a Linux machine equipped with a Atheros miniPCI 802.11 wireless card and a Tmote Sky mote so as to measure the RSS readings from both WiFi and Zigbee networks.
Fig. 4. Landmark setups and testing locations in two networks within two office buildings.
2.4 Results of Attack Detection
2.4.1 Impact of Threshold and Sampling Number
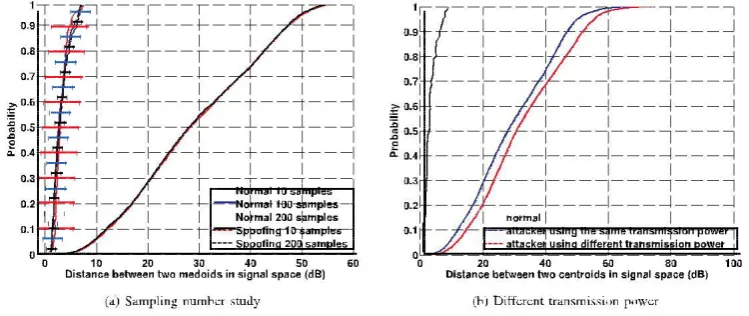
Fig. 5. 802.11 network: cumulative distribution function of distance between medoids Dm in signal space.
Fig. 6. Receiver operating characteristic curves when using the PAM method to perform attack detection.
2.4.2 Handling Different Transmission Power Levels
If a spoofing attacker sends packets at a different transmission power level from the original node, based on our cluster analysis there will be two distinct RSS clusters in signal space (i.e., Dm will be large). We varied transmission power for an attacker from 30 mW
(15 dBm) to 1 mW (0 dBm). We found that in all cases Dm is larger than normal conditions. Fig. 5b presents an example of the
Cumulative Distribution Function of the Dm for the 802.11 network when the spoofing attacker used transmission power of 10 dB to send packets, whereas the original node used 15 dB transmission power level. We observed that the curve of Dm under the different
transmission power level shifts to the right indicating larger Dm values. Thus, spoofing attacks launched by using different transmission power levels will be detected effectively in GADE.
2.4.3 Performance of Detection
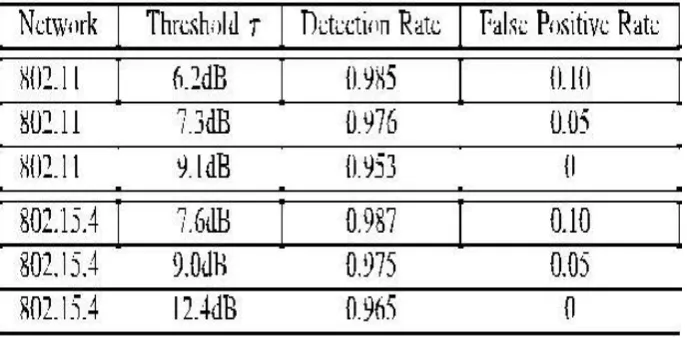
positive rates less than 10 percent, the detection rate are above 98 percent when the threshold _ is around 8 dB. Even when the false positive rate goes to zero, the detection rate is still more than 95 percent for both networks.
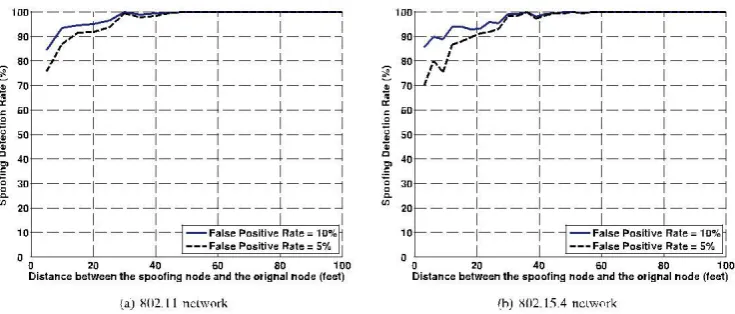
2.4.4 Impact of Distance between the Spoofing Node and the Original Node
We further study how likely a spoofing device can be detected by our attack detector when it is at various distances from the original node in physical space. Fig. 7 presents the detection rate as a function of the distance between the spoofing node Pspoof and the original node Porg. We found that the further away Pspoof is from Porg, the higher the detection rate becomes. This observation is consistent with our theoretical analysis presented in Section 3.1. In particular, for the 802.11 network, the detection rate goes to over 90 percent when Pspoof is about 15 feet away from Porg when the false positive rate is 5 percent. While for the 802.15.4 network, the
detection rate is above 90 percent when the distance between Pspoof and Porg is about 20 feet by setting the false positive to 5 percent. This is in line with the average localization estimation errors using RSS [28] which are about 15 feet. When the nodes are less than 15 feet apart, they have a high likelihood of generating similar RSS readings, and thus the spoofing detection rate falls below 90 percent, but still greater than 70 percent. However, when Pspoof moves closer to Porg, the attacker also increases theprobability to expose itself. The detection rate goes to 100 percent when the spoofing node is about 45-50 feet away from the original node.
TABLE 1
Fig. 7. The detection rate as a function of the distance between the spoofing node and the original node
3.
DETERMINING THE NUMBER OF ATTACKERS
3.1 Problem Formulation
Inaccurate estimation of the number of attackers will cause failure in localizing the multiple adversaries. As we do not know how many adversaries will use the same node identity to launch attacks, determining the number of attackers becomes a multiclass detection problem and is similar to determining how many clusters exist in the RSS readings. If C is the set of all classes, i.e., all possible combination ofnumber of attackers. For instance, C¼ f1;2;3;4g. For a class of specific number of attackers ci, e.g., ci¼ 3, we define Pi as the positive class of ci and all other classes (i.e., all other number of attackers) as negative class Ni
Pi ¼ ci; ð11Þ
Ni ¼ cj 2 C: ð12Þ
j¼6i
[
Further, we are interested in the statistical characterization of the percentage that the number of attackers can be accurately determined over all possible testing attempts with mixed number of attackers. Associated with a specific number of
attackers, i, we define the Hit Rate HRi as HRi¼Ntrue where
Pi
Ntrueis the true positive detection of class ci. Let Nfalsebe thefalse detection of the class ci out of the negative class Ni that do not
N
trueð13Þ
Precision
i¼
Ntrue þ Nfalse :
F-measure. F-measure is originated from information retrieval and measures the accuracy of a test by considering both the Hit Rate and the Precision [29]
F -measurei ¼ 1 2 1 : ð14Þ
þ
Precisioni HitRatei
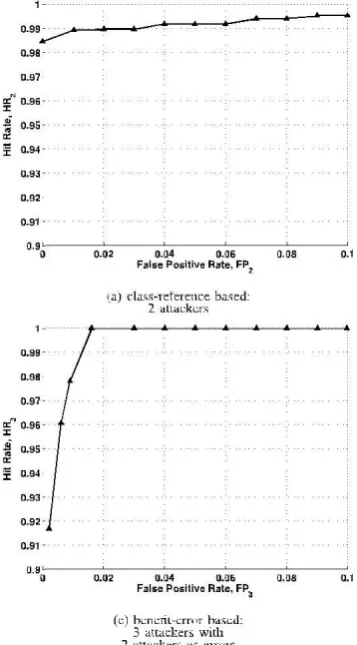
Multiclass ROC graph. We further use the multiclass ROC graph to measure the effectiveness of our mechanisms. Particularly, we use two methods [30]: class _ reference based and benefit _ error based. The class-reference-based formulation produces C
different ROC curves when hand-ling C classes based on Pi and Ni. Further, in the C-class detection problem, the traditional 2_2
confusion matrix, including True Positives, False Positives, False Negatives, and True Negatives, becomes an C_C matrix, which contains the C benefits (true positives) and C2_C possible errors (false positives). The benefit-error-based method is based on the C
_C matrix. For example, when C¼3 with possible number of attackers of f2;3;4g, the benefits are 3 and the possible errors are 6.
3.2 Silhouette Plot
3.2.1 Attacker Number Determination
A Silhouette Plot is a graphical representation of a cluster [31]. To determine the number of attackers, we construct Silhouettes in the following way: the RSS sample points S¼fs1; . . . ; sNg (with N as the total number of samples) are thedata set and we let C¼ ðc1;. . .; cKÞ be its clustering into K clusters, as shown in Fig. 8. Let dðsk;slÞ be the distancebetween sk and sl. Let cj¼ fsj1;. . . ;sjmjg be the jth cluster, j ¼ 1; . . . ; K, where mj ¼ jcjj.
Fig. 9. System evolution: detection of four adversaries masquerading the same node identity.
clusters is found in the data set: Koptimal¼K;ifEpðKÞ>EmðKÞ and EpðK þ 1Þ _ EmðK þ 1Þ.
Fig. 9 presents an example of using the System Evolution method to determine the number of attackers in the 802.11 network. It shows the energy calculation versus the number of clusters. The Koptimal is obtained when K¼4 with Epð4Þ >Emð4Þ and Ep ð5Þ < Emð5Þ indicating that there are fouradversaries in the network using the same identity to perform spoofing attacks.
3.3.2 Experimental Evaluation
In this section, we show our study of System Evolution using multiclass ROC graphs. We perform threshold _0 testing on EpðKÞ _
EmðKÞ. We can then obtain the number of attackers Koptimalbased on: Koptimal ¼ K, if EpðKÞ _ EmðKÞ > _0andEpðK þ 1Þ _
ROC graphs using both the class-reference-based method (i.e., the cases of two and four attackers) and the benefit-error-based method (i.e., the case of three attackers) by varying the threshold _0. Because of the overall higher Hit Rate under the 802.15.4 network, we only present the results of the 802.11 network in Fig. 10. By using the class-reference-based method, in Figs. 10a and 10b, we observed better performance of Hit Rate under the case of two attackers than the case of four attackers when the False Positive Rate decreases. Turning to examine the ROC graphs of the case of three attackers by using the benefit-error-based method as shown in Figs. 10c and 10d, we found that bounded by less than 10 percent False Positive Rate, the Hit Rate is lower when treating four attackers as errors than treating two attackers as errors. This indicates that the probability of misclassifying three attackers as four attackers is higher than that of misclassifying three attackers as two attackers.
3.3 The SILENCE Mechanism
The advantage of Silhouette Plot is that it is suitable for estimating the best partition. Whereas the System Evolution method performs well under difficult cases such as when there exists slightly overlapping between clusters and there are smaller clusters near larger clusters [32]. However, we observed that for both Silhouette Plot and System Evolution methods, the Hit Rate decreases as the number of attackers increases, although the Precision increases. This is because the clustering algorithms cannot tell the difference between real RSS clusters formed by attackers at different positions
Since the classification of the number of attackers is a if there are two attackers and a value of “_1” to label the multiclass problem, the original binary SVM classifier needs result if the number of attackers is not 2. Furthermore, the to be extended to a multiclass classifier. In the literature, features can be the difference of the partition energy and there are many approaches which can be used to combine the merge energy from System Evolution, or the minimum original binary SVM classifier to k-class classifiers [35], such distance between two clusters from SILENCE, or the as one-against-all and one-against-one. In our testing, we use combination of them. The goal of SVM is to produce a model the one-against-one method because it has shorter training from the training set to predict the target value of data time and better performance than one-against-all [36]. instances (i.e., the testing data).
The training data set can be obtained through regular network monitoring activities. Given a training set of instance-label pairs ðxi; yiÞ; i ¼ 1; . . . l, where xi 2 R
n
is the
n dimension features and yi 2 ½þ1; _1& is the label, the
support vector machines require the solution of the following optimization problem [33]:
1
w
Tw
l min þ C _ w;b;_ 2
i¼1 i
X
Subject to yiðw
T
ðxiÞ þ bÞ _ 1 _ _i;
_i _ 0:
Its dual is
1
min _T Q_
_
eT _
_ 2
Subject to yT _ ¼ 0;
0 _ _i _ C; i ¼ 1; . . . ; l;
where e is the vector of all ones, Q is an l by l positive semidefinite matrix, Q
¼ yyKx ; x jÞ
, and K x ; x jÞ ij i
T j ð i ð i
ðxiÞ ðxjÞ is called the kernel function. C > 0 is the penalty
parameter of the error term. The training vectors xi are
several kernels are being proposed by researchers, we use the
X
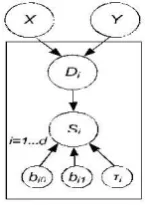
Gaussian distribution around the above propagation model, with variance _i: si_Nðb0iþb1ilogDi; _iÞ. Through Markov Chain Monte Carlo (MCMC) simulation, BN returns the sampling distribution of the possible location of X and Y as the localization result.
4.
Experimental Evaluation
Fig. 14 presents the localization error CDF when using the returned RSS medoids from SILENCE and the averaged RSS, respectively, for RADAR-Gridded, ABP, and Bayesian Net-works in two networks. We observed similar localization performance when using the returned RSS medoids to the traditional approaches using averaged RSS. Further, Fig. 15 presents the CDF of localization error of RADAR-Gridded and ABP when adversaries using different transmission power levels. To evaluate the performance of our approach by using the difference of returned medoids, three cases are
presented in Fig. 15: 1) Adversaries used the same transmis-sion power levels as the original node and the returned medoids are used; 2) Adversaries changed their transmission power level from 15 to 10 dB and the returned medoids are used; and 3) Adversaries changed their transmission power level from 15 to 10 dB and the difference of returned medoids are used. The key observation from Fig. 15 is that the performance of using the difference of returned medoids in handling adversaries using different transmission power levels is comparable to the results when adversaries used the same transmission power levels as the original node. Further, the localization performance is much worse than the traditional approaches if the difference of returned medoids is not used when localizing adversaries using different transmission power levels, shown as the case 2 above. In particular, when using our approach, we can achieve the median error of 13 feet for both RADAR-Gridded and ABP in case 3, a 40-50 percent performance improvement, compar-ing to the median errors of 20 and 19 feet for RADAR-Gridded and ABP, respectively, in case 2. Thus, IDOL is highly effective in localizing multiple adversaries with or without changing their transmission power levels.
5.
CONCLUSION
In this work, we proposed to use received signal strength-based spatial correlation, a physical property associated with each wireless device that is hard to falsify and not reliant on cryptography as the basis for detecting spoofing attacks in wireless networks. We provided theoretical analysis of using the spatial correlation of RSS inherited from wireless nodes for attack detection. We derived the test statistic based on the cluster analysis of RSS readings. Our approach can both detect the presence of attacks as well as determine the number of adversaries, spoofing the same node identity, so that we can localize any number of attackers and eliminate them. Determining the number of adversaries is a particu-larly challenging problem. We developed SILENCE, a mechanism that employs the minimum distance testing in addition to cluster analysis to achieve better accuracy of determining the number of attackers than other methods under study, such as Silhouette Plot and System Evolution, that use cluster analysis alone. Additionally, when the training data are available, we explored using Support Vector Machines-based mechanism to further improve the accuracy of determining the number of attackers present in the system.
Fig. 14. Comparison of localization errors between using medoids from cluster analysis and using averaged RSS.
Fig. 15. Localization errors when adversaries using different transmission power levels.
A
CKNOWLEDGEMENTSThis work is supported in part by the US National Science Foundation (NSF) Grants CNS-0954020, CCF-1018270. This work was done while J. Yang was at Stevens Institute of Technology.
REFERENCES
[1] J. Bellardo and S. Savage, “802.11 Denial-of-Service Attacks: Real Vulnerabilities and Practical Solutions,” Proc. USENIX
Security Symp., pp. 15-28, 2003.
[2] F. Ferreri, M. Bernaschi, and L. Valcamonici, “Access Points Vulnerabilities to Dos Attacks in 802.11 Networks,” Proc.
IEEE Wireless Comm. and Networking Conf., 2004.
[3] D. Faria and D. Cheriton, “Detecting Identity-Based Attacks in Wireless Networks Using Signalprints,” Proc. ACM
Workshop Wireless Security (WiSe), Sept. 2006.
[4] Q. Li and W. Trappe, “Relationship-Based Detection of Spoofing-Related Anomalous Traffic in Ad Hoc Networks,” Proc.
Ann. IEEE Comm. Soc. on IEEE and Sensor and Ad Hoc Comm. and Networks (SECON), 2006.
[5] B. Wu, J. Wu, E. Fernandez, and S. Magliveras, “Secure and Efficient Key Management in Mobile Ad Hoc Networks,”