Carbon-nanotube-based membranes for water
desalination by membrane distillation
By
Ludovic Francis Dumée (Ludo)
Master of material engineering - ENSISA - France
A thesis submitted to Victoria University, Melbourne - Australia
for the degree of Doctor in Philosophy
with the support of the
Commonwealth Scientific and Industrial Research
Organisation, Division of Materials Science and Engineering
&
The Institute for Sustainability and Innovation at Victoria
University
Melbourne Australia
3
Statement of originality
“I, Ludovic Dumée, declare that the PhD thesis entitled Carbon-nanotube- based membranes for water desalination by membrane distillation is no more than 100,000 words in length including quotes and exclusive of tables, figures, appendices, bibliography, references and footnotes. This thesis contains no material that has been submitted previously, in whole or in part, for the award of any other academic degree or diploma. Except where otherwise indicated, this thesis is my own work”.
Signature Date 28th of March 2011
Ludo Dumée, PhD candidate
4
Disclaimer
6
Acknowledgements
Merci beaucoup…
As per her support, fair judgement and advice over the past 3 years, I would like to heart fully thank Dr. Kallista Sears. Despite my tremendous character and wild imagination she managed to focus my brain on the main task to achieve, namely my PhD. Her advice, moral support and occasional cakes greatly helped me explore undiscovered features of the wondrous world of carbon nanotubes.
My most sincere gratitude goes to my academic supervisors and mentors, A/Prof Mikel Duke and Prof. Stephen Gray from Victoria University, for their professional advice and moral encouragement during my PhD research. Their comments, advice and ideas certainly greatly helped me focus and organize my experiments and thoughts over the past 3 years.
My appreciation and gratitude extends to those who, with their expert assistance, allowed me to work at the CSIRO, namely Dr. Jürg Schütz and Dr. Niall Finn. Their confidence, help and open-mindness gave me such a stunning opportunity to let my imagination flourish and my skills develop. To give me a chance to work and express myself in this wonderful facilities and laboratory, they are granted my eternal gratitude.
I would also like to express my gratitude to the Commonwealth Scientific Industrial and Research Organisation (CSIRO) for financial support of my scholarship and for funding, equipment, laboratory supply and travel during my PhD. This experience at the CSIRO has been very fruitful and certainly did extend the scope of my skills and open my mind on a different cultural research experience.
7
• Marta Redrado Notivoli, Chi Huynh and Dr. Stephen Hawkins for their considerable work on the growth of carbon nanotubes and for providing us with such a high quality material to fabricate our membranes (CSIRO MSE); • Mark Hickey, Jacinta Poole, Dr Yuan Gao and Dr. Mustafa Musameh for their numerous advice on technical matters and for giving me tricks on how to efficiently improve my writing skills (CSIRO MSE);
• Robin Cranston, Dr. Ron Denning, Dr. Geoff Naylor and Dr. Bill Humphries for their professional and financial support, and for giving me the opportunity to stay and work within their division and groups at the CSIRO over those past 3 years. Nothing would have worked out so well without funding and they have been very supportive and helpful in that regard;
• Mark Greaves and Dr. John Ward (CSIRO) … Dr. Sergey Rubanov (Bio 21) for their expert advice and help on SEM and TEM imaging;
• The CSIRO Belmont workshop staff, for their professionalism helpful advice and high quality workmanship;
• The CSIRO HSE committee for allowing me to work with carbon nanotubes in a safe environment;
• My colleagues in the Nanofibrous material group, Dr. Yen Truong, for granting me access to her goniometer and her porometer… Dr. Louis Kyriatzis for letting me use his electrospinning rigs… the CSIRO staff for their warm welcome and help over the past 3 years;
• Dr. Aaron Thornton for sharing a night shift on the Synchrotron and his advice on modelling… Dr. Paolo Falcaro and Dr. Dario Buso for fascinating ideas and discussions… Dr. Anita Hill for fruitful discussions and general advice on my PhD project… Zongli Xie and Lisa Wong for their help on the BET tests…Dr. Matthew Hill for his moral help, great discussions on gas adsorption, full support, and for granting access to his gas adsorption device; • Dr. Jianhua Zhang and Prof. Jun-de Li from Victoria University for fruitful discussions on thermal behaviours and membrane distillation process;
• Dr. Shane Cox and Dr. Pierre Le-Clech (UNSW), for granting me the access to their porometer in the early stage of my PhD and for wise advice over the end of it;
8
• Dr. Mary She and Dr. Lingxue Kong (Deakin University) for their help on the TEM 3D reconstruction and time in taking the micrographs at various tilt angle;
• Jos Campbell and Prof. Kourosh Kalantaar-Zadeh (RMIT) for access to their PTFE sputtering device;
• Steven Spoljaric and Prof. Robert Shanks (RMIT) for doing mt-Tm thermal expansion tests;
• Zach Sears for giving me a 6 month well deserved break;
• Stephen Wright (CSIRO PSE) for teaching me how to use his Anter laser flash thermal expansion device;
• The board of the Membrane Society of Australasia for granting me a travel award to attend AMS5 in Kobe, Japan in 2009; the European Union, through the Marie Curie funding scheme for financial support to attend the 2010 NanoMemPro course on Nano-structured materials and Membranes for Health and Sustainable Water;
• The board of the conferences I attended as presenter: ICOM08, AMS5, AMS6, the Australian Water desalination summit 2010, the AWA membrane specialty conference 09, ICONN10, the 1st Student Symposium of the MSA 2010…for giving me a chance to present my work and share with my fellow researchers;
• Prof Iijima for his work on carbon nanotubes in the 90’; Dr. Mainak Majumder, Prof Jason Holt and Prof Bruce Hinds for being pioneers in CNT membrane science and inspiring this project; the people I cite in my literature review as this work would not have been possible without their efforts over the past century and more…
• To the ones I forgot…
• Séda, my wife for cooking such great cakes. Pluche the cat for hugs and moral support;
10
Publications from this research
Published journal papers
[1] Sears, K., L. Dumée, J. Schütz, M. She, C. Huynh, S. Hawkins, M. Duke, and S. Gray, Recent Developments in Carbon Nanotube Membranes for Water Purification and Gas Separation. Materials, 2009. 3(1): p. 127-149. [2] Dumée, L.F., K. Sears, J. Schütz, N. Finn, C. Huynh, S. Hawkins, M. Duke, and S. Gray, Characterization and evaluation of carbon nanotube Bucky-Paper membranes for direct contact membrane distillation. Journal of
Membrane Science, 2010. 351(1-2): p. 36-43.
[3] Dumée, L., K. Sears, J. Schutz, N. Finn, M. Duke, and S. Gray, Carbon nanotube based composite membranes for water desalination by membrane distillation. Desalination and Water treatment, 2010. 17(1-3): p. 72-79.
[4] Dumee, L., L. Velleman, K. Sears, M. Hill, J. Schutz, N. Finn, M. Duke, and S. Gray, Control of Porosity and Pore Size of Metal Reinforced Carbon Nanotube Membranes. Membranes, 2010. 1(1): p. 25-36.
[5] Dumée, L., V. Germain, K. Sears, J. Schutz, N. Finn, M. Duke, D. Cornu and S. Gray, Enhanced durability and hydrophobic property of carbon nanotube bucky paper membranes by alkoxy-silanisation surface modification. Accepted by Desalination, March 2011
[6] Dumée, L., K. Sears, J. Campbell, J. Schutz, N. Finn, M. Duke, and S. Gray, Impact of the hydrophobicity and porosity of PTFE coated carbon nanotube bucky-paper membranes on their performance in membrane distillation. Accepted by Journal of Membrane Science, March 2011
11
Papers submitted or under writing process
[8] Dumée, L.F., Matthew Hill, Mikel Duke, Leonora Velleman, Kallista Sears, Jürg Schütz, Niall Finn, Stephen Gray, A route to the fabrication and activation of gold nanoparticles within carbon nanotube porous structures for gas storage application.
[9] Dumée, L., K. Sears, S. Wright, J. Schutz, N. Finn, M. Duke, and S. Gray, Thermal properties of carbon nanotube self-supporting bucky-papers.
[10] Dumée, L.F., Kallista Sears, Jürg Schütz, Niall Finn, Mikel Duke and Stephen Gray, Impact of the temperature of sonication on the dispersion of CVD grown multi-walled CNTs.
[11] Dumée, L., Thornton, A., L.F., Kallista Sears, Jürg Schütz, Niall Finn, Mikel Duke and Stephen Gray, The Orientation of Carbon Nanotube in macro structures: a Small Angle X-ray Scattering analysis of CNT yarns, bucky-paper, webs and forests.
[12] Dumée, L., Thornton, A., L.F., Kallista Sears, Jürg Schütz, Niall Finn, Mikel Duke and Stephen Gray, Thermal expansion of carbon nanotube based structures determined by Small Angle X-ray Scattering.
Selected presentations and talks
November 2010 Sydney, New South Wales - AUSTRALIA – International Membrane Science and Technology Conference - IMSTEC 10 in conjunction with the Aseanian Membrane Society 6 - AMS 6. Talk on the Properties of high gas adsorption capacity gold reinforced carbon nanotube bucky-paper hybrid membranes - Prize for the best student oral presentation
Poster on Functionalised carbon nanotube membranes for desalination: impact of hydrophobicity on the membrane performance
July 2010 New London, NH – USA – Gordon Research Conference (GRC): on Membrane: Materials and processes. Poster presentation on Alkoxysilane modified carbon nanotubes for increased
12
July 2010 Melbourne, Victoria - AUSTRALIA – Australian desalination summit 2010. Talk in plenary session on a Review of the use of carbon nanotube for separation and water purification
April 2010 Twente, the NETHERLANDS – European Union Marie Curie scholarship (2000AUD) to attend the NanoMemCourse on “Health and sustainable water”. Poster on the Performance of carbon nanotube based membranes for seawater desalination - a review
February 2010 Sydney, New South Wales - AUSTRALIA – International Congress on Nanotechnology and Nanosciences 2010 (ICONN10), talk on the Thermal properties of carbon nanotube macro-structures and poster on tuning the porosity of composite material carbon nanotube based membranes for water desalination
February 2010 Wollongong, New South Wales - AUSTRALIA – First Membrane Society of Australasia Student Symposium (MSASS1) talk on Performance of PTFE/carbon nanotube composites for water desalination by membrane distillation - Prize for Best Student Presentation
September 2009 Melbourne, Victoria - AUSTRALIA – Victoria University student symposium 2009, talk on a Review of my PhD work on integrating carbon nanotubes into membranes - Prize for Best Presentation
July 2009 Kobe, JAPAN – Aseanian Membrane Society conference 5, Co-winner of the Membrane Society of Australasia – Millipore travel grant (500AUD) to attend AMS5. Poster entitled Carbon Nanotube based composite membranes for water desalination by membrane distillation - Prize for Best Student Presentation
February 2009 Sydney, New South Wales - AUSTRALIA - Australian Water Association conference on Desalination and Membrane Technologies, Talk in plenary session at the on Advanced carbon nanotube membranes for direct contact membrane distillation
14
Abstract
“What makes the desert beautiful is that somewhere it hides a well.”
~Antoine de Saint-Exupery
More than 70% of the global community sources its fresh water from rivers, lakes and aquifers.. As the worldwide population approaches 9 billion by 2050 and the standard of living of fast developing countries, including Australia, increases, so does the demand for fresh water. Excessive exploitation of our finite fresh water resources has already impacted both eco-systems and global water reserves that are highly dependent on rainfall to regenerate and on geological hydrodynamics for storage.
To avoid further damaging and exploiting these dwindling natural resources, desalination appears to be a promising solution. Amongst the major processes that are commercially available on the market, the most common techniques are Multi-Stage Flash distillation and Reverse Osmosis (RO). Although commonly used, these two processes remain highly expensive because of both (i) the energy input required for either evaporating the water or overcoming its osmotic pressure and (ii) their high operating costs associated with maintenance and stress induced on the systems in harsh alkaline media.
15
made in Singapore and Amsterdam. Although the performance of these units, including commercial PVDF membranes were found satisfactory improved performance could be obtained for other membrane materials and module structures. Thus, to become competitive with other techniques, advanced membranes need to be designed that fit MD requirements.
Amongst the possible candidates, carbon nanotubes (CNTs) have shown interesting fluid transport characteristics and their intrinsic and semi 1D dimensional properties make them promising candidates for many separation and purification applications. Work has already demonstrated their potential for nanofiltration, bacteria removal, pervaporation and capacitive deionisation. Natural CNT properties, such as high hydrophobicity, chemical and thermal stability, make of them promising candidates for MD.
17
Introduction
‘Experience is the name everyone gives to their mistakes.’
~Mr Dumby in Lady Windermere's Fan, Act III, 1892 – Oscar Wilde
Water is the key to life on Earth. A biological, economical and social asset, it represents 70 % of the mass of our bodies, is required to grow crops and foster livestock, and an essential fluid in industries for cooling, lubricating, or use as solvent for chemical reactions. However, despite it’s prevalence in our life and its abundance on Earth, our society is facing global water stress. Population growth, increased standards of living and changing water distribution due to climate change are fast forcing us to change our habits and to adapt to new sources of clean fresh water. Furthermore, the energy crisis linked to the end of the oil era, and mankind’s desire to limit its carbon footprint on our environment, have changed people’s attitude and sustainability is now a key, long term societal development strategy. New methods to produce fresh water that require less energy and that can be applied over a large range of scales and under various economic conditions have to be developed.
18
Therefore, new desalination technologies are promising candidates to complement and assist existing techniques. New methods have to be able to benefit from low grade energy, be less sensitivity to fouling with reduced reliance on pre-treatments while being operable with less energy input or by combining them with existing energy systems thus making them free or cheap to run. Several techniques such as forward osmosis, relying solely on the using the osmotic pressure across a semi-dense membrane, capacitive deionisation where the ions are adsorbed into highly porous, conductive structures, or membrane distillation where water is evaporated at low temperature by creating a water vapor pressure gradient across a porous membrane, are promising candidates to be used either on small scale desalination or as complementary processes to existing reverse osmosis or thermal desalination plants.
19
configurations depending on the need for feed organic or volatile compounds recovery.
Despite those promising results, specific membranes need to be designed for MD to become more competitive and complementary with current techniques. As the diffusion regime across the air-gap largely depends on the pore size distribution, porosity and thickness of the membranes, a thorough control of these parameters is required to achieve high flux and selectivity. Several critical parameters such as the hydrophobicity, thermal conductivity and chemical stability must also be controlled to ensure long term stability of the material. In fact, to become more competitive over its desalination technologies counterparts, MD requires specifically engineered membranes with improved properties for enhanced performance.
Amongst the new and versatile materials that can be processed, nano-materials and nanotubes especially have already shown to be promising candidates in many separation applications. Intrinsic properties of nanotubes such as their frictionless surface properties, their low thermal conductivity in bundles, their very high thermal and chemical stability, as well as the opportunity to form very high porosity materials could be assets in MD and used to process improved membranes.
20
chemical or mechanical modifications to fit the needs of specific applications. The very high specific surface area of the CNTs can be, in the case of the BPs, preserved and used to make high adsorption and exchange capacity materials. Furthermore, as per the anisotropic CNT properties, thermal and electrical exchanges are made more difficult, thus making BPs promising low conductivity structures as opposed to their forests, webs or yarns counterparts. Processing BPs is usually performed by vacuum filtrating suspensions of CNTs and requires a deal of control over the CNT dispersion and suspension stability. It is however, a cheap and reliable method to process large surface areas with small amounts of CNTs, thus making BPs one of the most promising techniques to use CNTs on an industrial scale.
This work investigates ways to fabricate composite macro-structures made of carbon nanotubes in combination with polymers and metals to enhance membrane lifespan and performance. Carbon nanotube Bucky-papers were used as a template to engineer composite structures. The new materials have been thoroughly characterized for their thermal, structural and performance characteristics. The permeation and adsorption of gas and water vapor, as well as the membranes’ performance in desalination by direct contact membrane distillation, were tested and compared with polymeric benchmarks.
This thesis is structured into 6 chapters and 5 appendixes. A brief summary of each chapter is given in the following:
Chapter 1
Literature review
21
Chapter 2
Experimental techniques
This chapter covers all the experimental setups and techniques used in this research. Carbon nanotube growth and dispersion techniques are first described. Then the bucky-paper membrane characterisation techniques will be presented, including the investigation of their intrinsic properties (pore size, bubble point, porosity, thickness, BET surface area, contact angle…), and mechanical and thermal properties. Finally, the gas permeation and the Direct Contact Membrane Distillation setups, built for this work, are described.
Chapter 3
Carbon nanotube dispersion and bucky-paper processing
The rationale behind the technique used to disperse the chemical vapor deposition grown CNTs, as well as characterisation results of the suspension lifespan and quality will be given. The protocol for fabrication of the Bucky-paper membranes will also be described.
Chapter 4
Commercial membranes and self-supporting Bucky-paper membrane: setting up a benchmark
Commercial poly(vinyl-difluoride) and poly(tetra-fluoro ethylene) membranes were tested as a benchmark for the DCMD performance experiments. Preliminary results of water vapor permeation and salt rejection will also be presented for self-supporting carbon nanotube structures. This work was the starting point for the composite material processing undertaken in chapter 5.
Chapter 5
Composite BP membranes: improving the properties of self-supporting BPs for higher separation and adsorption efficiency
22
Chapter 6
Discussion on the membrane distillation results
In this final chapter the outcomes of the work on the direct contact membrane distillation results and the benefits from the carbon nanotube membranes will be discussed.
General conclusions
The outcomes of this thesis will be summarized and the main breakthrough and novel work identified. Some issues related to the use of CNTs are discussed while future opportunities for carbon nanotubes in separation technologies and other applications are described.
Appendix
Appendix 1 - Dispersion and CNT/solvent interaction
Supplementary materials on the CNT dispersion and information on a related study where isoporous membranes fabricated from carbon nanotube forests were processed.
Appendix 2 - Pore and surface characterisation
Supplementary materials on the surface and pore characterisation are provided in this section.
Appendix 3 – Direct Contact Membrane Distillation
Supplementary materials on the polymeric membranes characterisation and membrane distillation results as well as surface SEM images are displayed.
Appendix 4 – Bucky-paper thermal properties
23
Appendix 5 – Small Angle X-ray Scattering analysis
Example of preliminary results of the SAXS results obtained at the Australian Synchrotron are presented.
Appendix 6 – Tortuosity calculations
25
Table of Contents
Introduction ... 17 Table of figures ... 30 Table of tables ... 38 1 Literature Review: desalination techniques, membrane distillation and nano-materials in separation ... 45
1.1 Introduction ... 46 1.2 Main desalination techniques ... 50 1.2.1 General facts ... 50 1.2.2 Statistics on desalination techniques... 55 1.2.3 Conclusions ... 59 1.3 Membrane Distillation ... 60 1.3.1 Introduction ... 60 1.3.2 Membrane morphology ... 61 1.3.3 Membrane distillation configurations ... 65 1.3.4 Membrane Distillation: theory of heat and mass transfer ... 67 1.3.5 Two limitations of membrane distillation: module design and
26
2.1.2 Processing conditions ... 99 2.2 Nanotube characterisation ... 101 2.2.1 Transmission Electron Microscopy ... 101 2.2.2 Thermal Gravimetric Analysis ... 102 2.2.3 Fourier Transform Infra-Red & Energy Dispersive X-Ray Spectroscopy ... 103 2.2.4 X-Ray Photo-electron spectroscopy in Air ... 104 2.2.5 Raman spectroscopy ... 105 2.3 CNT dispersion characterisation ... 107 2.3.1 UV/visible spectroscopy ... 108 2.3.2 Nano-sizer ... 109 2.3.3 Optical imaging ... 110 2.4 Bucky-paper characterisation ... 111 2.4.1 Structural and surface properties ... 112 2.4.2 Goniometer ... 114 2.4.3 Small Angle X-Ray Scattering ... 114 2.4.4 Thermal properties of the BPs ... 115 2.4.5 Membrane properties ... 120
2.4.6 Composite materials processing techniques ... 126 2.5 Direct contact membrane distillation rig design ... 129 3 Dispersion of CNTs in solution and self-supporting BP processing
137
27
3.5 Dispersion protocol chosen for this study ... 164 3.6 Self-supporting Bucky-paper processing ... 164 3.7 Conclusions ... 167 4 PVDF, PTFE and self-supporting Bucky-paper membranes for Direct Contact Membrane Distillation: preliminary tests and benchmarks ... 171
4.1 Introduction ... 172 4.2 Membranes characterisation ... 173 4.2.1 Bucky-paper morphology ... 173 4.2.2 Pore size distribution ... 174 4.2.3 Porosity ... 181 4.2.4 Thickness ... 181 4.2.5 Specific surface area ... 183 4.2.6 Contact angle ... 185 4.2.7 Mechanical tensile behaviour ... 188 4.2.8 Thermal behaviour ... 189 4.3 Direct contact membrane distillation test ... 199 4.3.1 DCMD tests on reference membranes: benchmark ... 200 4.3.2 BP membranes: flux and permeability ... 202
4.3.3 Membrane integrity and lifespan during DCMD ... 206 4.3.4 Surface fouling ... 208
28
8 References ... 297 9 Appendix 1 to 6 ... 339 9.1 Appendix 1 - Dispersion and CNT/solvent interaction ... 340 9.1.1 Collapse of CNT forest under the influence of solvent evaporation
340
9.1.2 Spectro UV/visible spectroscopy results for the CVD dispersion 344
9.1.3 Zeta sizer data ... 345 9.1.4 E-SEM images and air bubble presence on the CCI CNTs in solution 346
30
Table of figures
Figure 1-1 Water volume on the Earth compared to the planet size ... 46 Figure 1-2 Breakdown of the water on Earth ... 47 Figure 1-3 Global water stress level-extracted from the IDA website – accessed 14th of May 2010; Un-labelled areas are considered to not be under water stress ... 48 Figure 1-4 Desalination capacity classified by technique used. More than 99.5% of the water being desalinated is being treated either by Multi Stage Flash desalination, Reverse Osmosis, Electrodyalisis, Multi-effect evaporation, or Vapor compression – data 2006. www.worldwater.org – accessed 16th of May 2010 ... 54 Figure 1-5 Main desalination plants classified by geographic area from 1960 to 2005 IDA website; www.worldwater.org – accessed 16th of May 2010 ... 55 Figure 1-6 Publications in various fields sorted out by geographic area; Data obtained from Science direct website publication analyser 2010 ... 56 Figure 1-7 Worldwide desalination capacity sorted by plant size; Data obtained from Science direct website publication analyser 2010 ... 57 Figure 1-8 Number of publications since 1985 on Reverse Osmosis (RO), Electrodialysis (ED) and Membrane Distillation (MD) - obtained from an analysis on Science Direct 2010 ... 58 Figure 1-9 Scientific fields where membrane research is being pursued – obtained from an analysis on Science Direct 2010 ... 59 Figure 1-10 MD concept; A membrane is used as a separation barrier between two independent streams ... 60 Figure 1-11 Various membrane morphologies. Top left: cellulose acetate membrane 0.8 µm pore size. Top right: PVDF membrane 0.22 µm pore size membrane; Bottom left: PTFE 0.45 µm pore size membrane; Bottom right: CNT BP 0.02 µm pore size membrane ... 62 Figure 1-12 Hollow fibre (left) and flat sheet (right) membranes [115-117] .... 65 Figure 1-13 The four different MD configurations; A, B C and D respectively refer to DCMD, VMD, AGMD and SWMD ... 66 Figure 1-14 Heat and mass transfer in MD for a counter flow configuration .. 68 Figure 1-15 Statistics on CNTs - number of publication for (i) CNT in general; (ii) CNT composite; (iii) CNT based membranes ... 75 Figure 1-16: Left: fullerene C60 and; right: Multi walled carbon nanotube ... 77
31
32
33
Figure 4-6 (A) Aspect ratio, (B) sphericity of the pores for the different ratios of CCI CNTs and (C) pore geometry related to the aspect ratio and sphericity for the same surface area ... 178 Figure 4-7 Pore size selectivity determined from particle exclusion tests .... 179 Figure 4-8 Pore size distribution for self-supporting BP obtained by porometry in wet-up/dry-up mode. Galwick was used as wetting liquid ... 180 Figure 4-9 Porometer pore size distribution for 4 PTFE membranes; the nominal pore size are respectively 0.02, 0.2, 0.45 and 1 µm ... 181 Figure 4-10 Altisurf thickness measurements. Top: CCI CNT BP; Bottom CVD CNT BP ... 182 Figure 4-11 Altisurf thickness mapping – blue and dark are the lowest profiles, while red and white show the highest profiles ... 183 Figure 4-12 BET surface area as a function of the wall number for the different CNTs in Table 4-2 ... 185 Figure 4-13 Deionised water contact angle on BPs. Left: 100% CCI; middle 50/50 CCI/CVD and right 100% CVD. ... 186 Figure 4-14 E-SEM micrograph showing water wetting at the surface of a CNT BP; the water pressure was increased from 0.1 to 0.3 kPa; the scale bar is given on the right image and the scale bar of the insert is 1 µm ... 187 Figure 4-15 E-SEM micrograph showing the hydrophobic nature of the BP (water vapor adsorbing) ... 187 Figure 4-16 Example of tensile test; the modulus is calculated from the tangent to the curve at "0" strain while the maximum load (here ~6.85 N) is given at the maximum strain before failure (0.545 mm) ... 189 Figure 4-17 Thermal diffusivity of a BP compared with a non-woven of carbon fibres fabricated from fibres purchased from Nanoshell ... 191 Figure 4-18 Thermal contraction of the BPs under different atmospheres ... 193 Figure 4-19 mt-Tm dimensional changes as a function of temperature ... 194 Figure 4-20 Thermal expansion with the mt-Tm method ... 194 Figure 4-21 SAXS diffraction patterns for various macrostructures made purely of CNTs; A: CVD CNT BP; B: CNT forest (on its silicon wafer); C: CNT yarn (pattern across its diameter); and D: CNT bucky-ribbon (10 webs condensed) ... 195 Figure 4-22 Scattering intensity of the signals at different temperatures ... 196 Figure 4-23 Luh graph plotted as a function of time; the time/frame dependence was defined by a 30 s interval between each shot ... 198 Figure 4-24 Impact of hot feed temperature change at constant cold temperature (5 ºC) with a PTFE 0.45 µm pore size membrane ... 200 Figure 4-25 Impact of average pore size on the water vapor flux ... 201 Figure 4-26 Left: Flux across a 40 µm thick BP membrane at Thot and Tcold
34
curves taken inside and well away from the crack. The right inset shows a low magnification view of the cross section ... 208 Figure 4-31 SEM images of surfaces after DCMD of a low concentration whey / water solution; The A series corresponds to 0.45 um pore size PTFE membranes while the B series to BPs ... 209 Figure 5-1 Representative SEM image of the structure of the PP support ... 217 Figure 5-2 Representative SEM image of at the surface of a PS infiltrated composite BP membrane; the scale bar corresponds to 500 nm ... 218 Figure 5-3 SEM micrographs of A: PTFE membrane; B: Bucky-paper and C&D: PTFE coated BP. The images were taken at 5 keV and 5 mm working distance after iridium sputtering. The scale bars of A, B and C correspond to 2
35
Figure 5-19 Scheme of the gold plating process; A: initial material; B: 1 h; C: 5 h and D: 10 h of plating. Gold nano-clusters form and grow on the CNT outer walls forming a homogeneous and continuous layer at long plating times ... 236 Figure 5-20 TGA analysis results ... 238 Figure 5-21 The porosity of the BPs was shown to continuously decrease with plating time whereas their specific surface area initially increased by up to 50 % of the reference value before dropping to 25 % of the reference value ... 239 Figure 5-22 Pore size distribution determined by porometry ... 240 Figure 5-23 Scanning Electron Micrographs taken on a Focus Ion Beam (FIB) SEM. Cross sections were performed at an intensity of 7 nA and images taken at a tilt angle of 53º. The working distance was 7.5 mm and the surface was not coated with any conducting metal ... 241 Figure 5-24 Flux as a function of vapor pressure difference (dP) across the membrane. The vapor pressure difference was controlled by varying the hot side temperature (20ºC; 35ºC; 50ºC; 65ºC; 85ºC 95ºC) while maintaining a constant cold side temperature of 5ºC ... 244 Figure 5-25 Flow across the membranes as a function of the vapor pressure difference (dP) across the membrane. Stream flow rates = 300 mL/min or 0.7 m/s. The hot stream temperature was varied between 55 and 95 ˚C while the cold stream was kept constant at 5˚C ... 246 Figure 5-26 Water vapor flux across the alkoxysilane modified CNT membranes in DCMD. The feed and permeate stream flowrates were 300 mL/min. Vapor pressure drops were estimated from temperature measurements at the inlets and outlets of the membrane module. The hot solution was a synthetic seawater solution (3.5 wt% NaCl) while the cold stream was deionised water. The time of ozone treatment is given as an indication of the relative given amount of alkoxysilane grafting (30 or 60 min) ... 248 Figure 5-27 Left: SEM image of a section milled with a Focus Ion Beam through a BP membrane after testing in the DCMD setup. Right: corresponding EDS analysis showing the presence of salts in the crack ... 251 Figure 5-28 Air permeation across the bead reinforced BPs ... 252 Figure 5-29 Dried air permeation across gold plated CNT BP. The corresponding plating times are given in hours in the legend ... 254 Figure 5-30 A: CO2 adsorption (volume) on the series of samples; and B: H2
volume adsorbed at 77 K for the 1 h and 5 h platted samples ... 256 Figure 5-31 Gas excess adsorption (A) and relative selectivity over CO2 (B)
for the 5 h plated sample ... 257 Figure 5-32 A: The 5h plated sample showed high enthalpy of adsorption of H2 (A). The large surface of gold exposed led to important activation of the
surface and of adsorption of CO2 for the shorter plating times (B) ... 258
Figure 5-33 A: Specific surface area as a function of the particle number related to 1000 nm; B: nano-particle specific surface area as a function of the particle diameter ... 260 Figure 6-1 Permeability as a function of the average pore size of the membranes. The theoretical curve as a function of pore size is shown and was calculated from Equation 6-3 (dashed dark blue line) ... 272 Figure 6-2 Relative position of the k(membrane) / k (PTFE20) values as a function of the theoretical values of PKn / PKn (PTFE20) calculated from the
36
37
38
Table of tables
Table 1-1 Properties of the membranes used in the previous techniques ... 59 Table 1-2 Fields of application in which MD technology has been used [82,84] ... 67 Table 1-3 Prices of CNTs on 4 different website suppliers on the 30/06/2010. All prices in USD ... 81 Table 2-1 Techniques and CNT properties related ... 101 Table 2-2 Materials properties ... 111 Table 2-3 Membrane properties ... 112 Table 3-1 Concentrations of the solutions ... 149 Table 3-2 Main absorption peaks found for the CCI CNTs (2.6mg/L) ... 151 Table 4-1 BP mean pore size and sample names. The three main samples studied are in bold ... 176 Table 4-2 BET values from literature and our group ... 184 Table 4-3 Thermal expansion coefficients from E-SEM analysis ... 193 Table 4-4 Permeabilities and permeances calculated from Figure 4-25 ... 201 Table 4-5 Membrane performance and properties ... 203 Table 4-6 Permeance and permeability of the BP and PTFE membranes ... 205 Table 5-1 Properties of the sandwiched and polymer infiltrated BPs ... 218 Table 5-2 PTFE coated membrane properties ... 220 Table 5-3 Bead reinforced composites properties ... 233 Table 5-4 Properties of the gold electroless plated samples ... 237 Table 5-5 Properties of BPs membranes and DCMD results. The thickness was estimated by SEM imaging ... 244 Table 5-6 Salt rejection and lifespan of sandwiched and infiltrated BPs ... 245 Table 5-7 Permeability and thickness of the membranes ... 246 Table 5-8 Salt rejection and lifespan of the PTFE coated BPs ... 247 Table 5-9 Properties of the membrane in DCMD. The standard deviation is given when data available. ... 248 Table 5-10 Properties of alkoxysilane modified BP ... 249 Table 5-11 Air permeability of the bead reinforced composites ... 252 Table 6-1 CNT BP tortuosity calculation for a 100 nm thick BP (Appendix 6) ... 269 Table 6-2 Knudsen pre-factor estimated from Equation 2; BP corresponds to a self-supporting structure without any surface modifications, while the data for the PTFE correspond to the values experimentally and theoretically obtained for commercial Pall membranes as presented in Chapter 4 and 5 ... 270 Table 6-3 Values of PKn calculated from Equation 6-1 and from experimentally
39
40
List of common abbreviations
Carbon nanotube CNT
Single Walled CNT SWNT
Chemical Vapor Deposition CVD
Catalyst Continuous Injection CCI
Nano-particle NP
Bucky-paper BP
Bucky-Ribbon BR
Membrane Distillation MD
Direct Contact Membrane Distillation DCMD
Reverse Osmosis RO
Nano-filtration NF
Electrodialysis ED
Electroless plating ES
Poly(tetra-fluoro-ethylene) PTFE Pall commercial 20 nm PTFE membrane PTFE20 Pall commercial 220 nm PTFE membrane PTFE220 Pall commercial 450 nm PTFE membrane PTFE450
Poly(vynil-difluorure) PVDF
Poly(styrene) PS
Poly(propylene) PP
Poly(ethylene) PE
Dimethylformamide DMF
Carbon dioxide CO2
Hydrogen H2
Methane CH4
Nitrogen N2
Nanometre nm
Micrometre µm
Microlitre µL
41
Volume percent v%
Scanning Electron Microscopy SEM
Transmission Electron Microscopy TEM Photo-Electron Spectroscopy in Air PESA
Thermo-gravimetric Analysis TGA
Fourier Transform Infra-Red FTIR
Electron Dispersion Spectroscopy EDS
Liquid Entry Pressure LEP
Kilo electron volt keV
Watts W
Commonwealth Scientific Industrial and Research Organisation CSIRO
Materials Science and Engineering MSE
Institute for Sustainability and Innovation ISI
Victoria University VU
The University of New South Wales UNSW
42
List of common symbols
Bolltzman Constant R
Molar mass M
Temperature T
Area (surface) A
Pressure variation ∆P
Density (greek RHO) ρ
Tortuosity (greek TAU) τ
Thickness t
Porosity (greek EPSILON) ε
Pore radius r
Pore diameter d
Permeation prefactor P
Flux J
Permeance f
Permeability k
Power (greek PIE) Π
Thermal conductivity (greek LAMBDA) λ
45
Chapter 1
1 Literature
Review:
desalination
techniques,
membrane
distillation and nano-materials in
46
1.1 Introduction
“Thousands have lived without love, but not one has lived without water.”
W.H. Auden
From the clouds of the sky to the tides on the shores, from the drops in the rain to the aquifers in the ground water lies everywhere on Earth. An impressive amount of ~1,400,000,000 km3 of water that boils, drops, flows and freezes. Water can be found in various forms: vapor in the clouds and atmosphere, liquid in the oceans, rivers, lakes and aquifers and solid in both glaciers and ice caps. But is it really that much? If one made a sphere out of this volume, it would have a diameter of only 1390 km and would not even entirely cover Europe or Australia (Figure 1-1) [1].
Figure 1-1 Water volume on the Earth compared to the planet size
47
Nowadays, fresh water is being produced and extracted for ~70% of human beings from rivers, lakes or aquifers. Population growth may reach 9 billion in 2050 [3] and the increasing standard of living of the various developing countries will require further development of fresh water production before reaching peak water use. Water stress, as emphasized in Figure 1-3 is a critical global issue. Entire parts of the world are being affected and more and more urban area might be subject to climate change effects [4].
0% 10% 20% 30% 40% 50% 60% 70% 80% 90% 100%
Total water Fresh water Fresh surface water Icecaps Salty water Lakes Freshwater Ground Surface Swamps Rivers 0% 10% 20% 30% 40% 50% 60% 70% 80% 90% 100%
Total water Fresh water Fresh surface water Icecaps Salty water Lakes Freshwater Ground Surface Swamps Rivers
Figure 1-2 Breakdown of the water on Earth
48
Low High Severe
Water stress level
Low High Severe
Water stress level
Figure 1-3 Global water stress level-extracted from the IDA website – accessed 14th of May 2010; Un-labelled areas are considered to not be under water stress
The scope of this PhD covers various fields of research and a comprehensive review was required to present its various dimensions. The general aim of this PhD was to engineer membranes for separations applications based on Carbon Nanotubes (CNT). The main focus of this work was to fabricate advanced composite membranes for membrane distillation as an alternative technique to desalinate water. The review will be divided up into three sections.
The first section focused on the major techniques available to desalinate water. Two very different approaches are currently being used: (i) thermal or (ii) membrane based techniques. The different techniques will be introduced and compared to present their main advantages and drawbacks. Membrane based desalination techniques, i.e. reverse osmosis, electrodialysis and membrane distillation will be presented and several examples of their performance and potential complementarities depicted. The properties of the membrane structures for the different techniques will be described to show where improvements are still required in membrane science.
49
our carbon dioxide emissions. The theory behind membrane distillation will be developed and both the limitations and the optimal properties that an adequate membrane for MD should have will be presented. To become more competitive and complementary over other desalination techniques, new membranes are required to offer a low energy route, high salt rejection and permeability for improved performance.
50
1.2 Main desalination techniques
1.2.1 General facts
Desalination of seawater appears today to be the most obvious solution to respond to fresh water stress and shortage. It does not impact highly on ecosystems and preserves natural resources. Desalination refers de facto to the removal of excess salts or minerals from soil or water [8]. In fact ,over 203 countries recognized by the UN 79% have open access to seawater which represents ~93% of the human population [9]. Despite the fact that most of the population is close by the sea and that research has been done on it over the last 50 years, desalination is still a costly and high energy consuming technique. Research is being carried out to reduce costs and new techniques are emerging to produce fresh water of high quality with less energy.
The most commonly used techniques worldwide [10] are thermally driven techniques where the feed of water to desalinate is evaporated, thus concentrating the salts in a brine waste stream while the water vapor is condensed in a separated cooling system. These techniques were developed in the 1940’s and present many conveniences, such as the simplicity of these systems and/or the quality of the final product. The installations are generally considered to be expensive to run as they require a lot of maintenance. This is the reason why alternative techniques requiring less energy and achieving better separation are being investigated.
51
systems in very alkaline solutions remain very high [10, 16]. Multiple-effect distillation (MED/ME) is another technique, where water and steam circuits are fed in parallel to each other, and steam generated in one stage is used to heat up the water in the next stage. Even though energy recovery improves the efficiency the energy costs remain high if free or waste heat is not available [17-19].
All those methods remain highly expensive because of their energy consumption, if no excess heat is input [20-22], and their high operating costs [23] linked to both maintenance and thermal stress induced in those working conditions [10]. Thus, alternative techniques based on membrane separation are being sought [24].
The second set of techniques can be either pressure, concentration, thermally or electrically driven. They are based on the separation of at least two streams of fluids by a third medium. These media, called membranes, are used as separation barriers between the streams. The membranes have different geometries and properties depending upon the application. Various desalination techniques where a membrane is involved are presented and compared.
52
similar to RO that also requires size and charge for separation of species. Generally NF and RO membranes are used at pressures ranging respectively between 10 and 20 bars, and 20 and 70 bars. The structure of the membranes varies from porous (pore range between 0.5 and 2 nm) in the case of NF to semi-dense (<0.5 nm) for RO membranes. The material properties also impact the performance, and most RO membranes are asymmetric with a bi-layer structure where a thin, dense, 100 nm layer is deposited onto a strong supporting layer. NF membranes can be either symmetric or asymmetric and present mono-disperse pore size distribution. RO membranes are classically polymeric and need to be hydrophilic to facilitate the water diffusion. These membranes, made of for example cellulose acetate, aromatic polyamides or polyimides and offer low solute permeability and high rejection factors.
53
Desalination efficiency and permeability are limited and the membranes tend to be more selective to monovalent ions.
Pervaporation is a concentration based technique where the feed is in direct contact with one side of the membrane while the other side is composed solely of the fluid vapor. A low vapor pressure is created on the permeate side and selectivity is achieved by a difference in the components vapor pressures by the solubility of components in the membrane and its desorption into a carrier medium (sweep gas or vacuum for example). Pervaporation is in fact more selective than MD because of the membrane characteristics [39-41]. A dense membrane acts as a barrier between the liquid and the vapor phase. The limiting factor is thus the solubility/diffusivity of the vapor in the membrane. Polymers classically used for desalination have to be hydrophilic and offer high solute permeability. In the case of water desalination, poly(vinyl-acetate) or polyamides are classically used and present good solubility/diffusivity ratios.
54
Other techniques, such as capacitive deionisation [42-47] and forward osmosis [48-54] are being developed and offer interesting alternative technologies but there is no large commercial development of these techniques on the market yet.
The global desalination market split over those techniques is dominated by Multi-stage Flash desalination (thermal technique) and Reverse Osmosis (membrane technique) as shown in Figure 1-4.
0.5%4.3% 4.1% 5.6% 41.1%
44.4% Multi Stage Flash
Reverse Osmosis Electrdialysis
Multi effect evaporation Vapor Compression Other
Figure 1-4 Desalination capacity classified by technique used. More than 99.5% of the water being desalinated is being treated either by Multi Stage Flash desalination, Reverse Osmosis, Electrodyalisis, Multi-effect evaporation, or Vapor compression – data 2006. www.worldwater.org – accessed 16th of May 2010
55
4.3% 4.16% 12.7% 71.85%
6.99% Asia
Middle East North America Europe Other
Figure 1-5 Main desalination plants classified by geographic area from 1960 to 2005 IDA website; www.worldwater.org – accessed 16th of May 2010
To face the new challenges that arise from developing and growing societies new complementary techniques need to be combined to address the rising energy consumption and environment concerns while sustaining the production of high water quality. One of the previously quoted techniques, Membrane Distillation offer several advantages, such as the possibility to work at low pressure and at very high salt concentration, over its counterparts and research is focused on establishing synergies between techniques to treat the water.
1.2.2 Statistics on desalination techniques
56
Furthermore, even though the average desalination plants treatment capacity is between 100,000 and 300,000 m3/day (Figure 1-7) the current trend is to build either much bigger plants to fulfil the needs of the major cities or smaller plants for remote small communities. This trend is particularly visible in Australia, where many small community projects are being funded in parallel to massive plants to provide water for the capital cities. Similarly, America has an average RO treatment capacity of only of 85,000 m3/day.
Better processes consuming less energy for the same output were required, which gave its chance to emerging technologies such as RO or ED. Both started to grow rapidly in the 1960’s exceeding thermal based techniques in the early 2000’s [25]. Both methods have been commercialised in either small portable units or large plants in the case of both RO and ED.
America Asia Europa Middle East Oceania
0 10 20 30 40 50 P e rc e n ta g e o f p u b lic a ti o n ( %) Geographic area Desalination RO MD ED PV
57
up to
500 0 5000 -10, 000 10,0 00-2 0,00 0 20,0 00-3 0,00 0 30,0 00-4 0,00 0 40,0 00-5 0,00 0 50,0 00-6 0,00 0 60,0 00-7 0,00 0 70,0 00-8 0,00 0 8000 0-90 ,000 90,0 00-1 00,0 00 100, 00 0-150, 000 150, 00 0-200, 000 200, 00 0-250, 000 250, 00 0-300, 000 300, 00 0-350, 000 350, 00 0-400, 000 400, 00 0-450, 000 450, 00 0-500, 000 500, 00 0-550, 000 550, 00 0-600, 000 600, 00 0-650, 000 650, 00 0-700, 000 700, 00 0-750, 000 750, 00 0-800, 000 800, 00 0-850, 000 850, 00 0-900, 000 0 2 4 6 8 10 12 14 16 W o rlw id e d e s a lin a ti o n c a p a c it y %
Plant capacity (m3/d)
Figure 1-7 Worldwide desalination capacity sorted by plant size; Data obtained from Science direct website publication analyser 2010
Furthermore, grafted onto these two techniques, alternative and complementary methods such as pervaporation and membrane distillation started to emerge. The number of publication from 1985 to 2010 shows clearly this diversification trend (Figure 1-8). Pilot plants using the membrane distillation setup have been built and are run in Amsterdam (the Netherlands) and Singapore [55-57]. It was proposed to benefit from the fact that MD is less sensitive to the salt concentration to post treat RO brine and benefit, by energy recovery of “free” energy from the RO plants. Studies showed that lost heat generated by plants could supply the energy to heat the water in MD, offering an alternate route to desalination at very low cost.
58
1985 1990 1995 2000 2005 2010
0 20 40 60 80 100 120 140 N u m b e r o f p u b li c a ti o n s i n e a c h c a te g o ry Publication Year RO ED MD
Figure 1-8 Number of publications since 1985 on Reverse Osmosis (RO), Electrodialysis (ED) and Membrane Distillation (MD) - obtained from an analysis on Science Direct 2010
This fact shows how important is the control and the modification of membrane properties. Membrane based techniques had to become economically sustainable only if the separation barrier was efficient and appropriate enough. Most of the work has then been focused on the membrane module design and on the chemistry of the active layers of the membranes to enhance their properties (Figure 1-9).
59
Chemical engineering Water resources Chemistry Polymer science
0 20 40 60 80 P e rc e n ta g e o f p u b lic a ti o n %
Area of expertise
ED RO PV MD
Figure 1-9 Scientific fields where membrane research is being pursued – obtained from an analysis on Science Direct 2010
Table 1-1 Properties of the membranes used in the previous techniques
Technique Density Pore size Material Cost
RO Semi dense <0.5 nm Resins (i.e. polyamide (PA), cellulose acetate)
High
NF Porous <1-2 nm PA High
ED Dense N/A Ion exchange resins
(Nafion, PE)
Medium to high
Pervaporation Dense N/A PVA Low
MD Porous <1 µm PTFE, PVDF, PP, PE Low to Medium
1.2.3 Conclusions
60
1.3 Membrane Distillation
1.3.1 Introduction
Direct Contact Membrane Distillation (DCMD) is a separation technique where a non-wettable porous membrane is used as a separation barrier between two independent streams [58-60]. The streams are circulating on both sides of the membrane at different temperatures creating a vapor pressure gradient. MD is a non-pressure driven separation technique since only liquid vapor is transported across the membrane due to differences in vapor pressure across the membrane (Figure 1-10).
Figure 1-10 MD concept; A membrane is used as a separation barrier between two independent streams
MD membranes need to match specific properties to achieve high performance in both permeation and selectivity. According to the ‘Terminology for membrane distillation’, MD membranes should match the following criteria [61]:
- be porous (present an air gap)
61
- must not alter the vapor liquid equilibrium of the different components in the process fluids
- no capillary condensation should take place within its structure
- one side of the membrane at least should be in direct contact with the process fluid and
- the driving force of the operation should be the partial pressure difference in the vapor phase
Industrially, MD is used for chemical separation in the pharmaceutical industry, degassing and volatile fluid removal in the mining industry and proteins or sugar concentration in the food industry. Amongst the possible applications where MD might bring benefits, fruit juice concentration [62, 63], de-nitrification of mining extracts and ammonium removal [64], alcohol-water and liquid mixtures separation [65-68], proteins concentration [69] and water desalination [70-80] have been demonstrated either in laboratory or pilot plant trials.
1.3.2 Membrane morphology
62
Cellulose – 0.8 µm PVDF – 0.22 µm
PTFE – 0.45 µm BP – 0.02 µm
Figure 1-11 Various membrane morphologies. Top left: cellulose acetate membrane 0.8 µm pore size. Top right: PVDF membrane 0.22 µm pore size membrane; Bottom left: PTFE 0.45 µm pore size membrane; Bottom right: CNT BP 0.02 µm pore size membrane
It is generally recognized that determining a real pore size is difficult and indirect measurements are often preferred through Liquid Entry Pressure (LEP) or porometry [61, 101, 102]. The most critical parameter in MD is the surface energy of the membrane as pore wetting by the processed liquids must be avoided. The Laplace equation gives us a relationship between the membrane's largest available (non-closed) pore size (rmax) and the operating
conditions (Equation 1). To work efficiently the LEP of the membrane, calculated from the Laplace equation, must remain higher than the gradient of pressure applied on the interface pore/liquid:
max int
cos
2
r
B
P
LEP
Lerface
θ
γ
−
=
∆
63
where B is a geometric factor determined by the pore structure, γL the liquid
surface tension and θ is the liquid/solid contact angle and rmax the largest
pores in the structure.
The diffusion mechanisms across the membrane are considered to follow gas diffusion theory and highly depend on its average pore size. Three different regimes can rule the diffusion mechanism depending on the mean free path of the molecules within the pores [58, 103-107] (Equation 2). A general law ruling gas diffusion is given in Equation 2. Typically diffusion is proportional to the average pore size distribution and porosity while inversely proportional to the thickness and tortuosity of the membrane.
α τ ε × × × = t r T K
f ( ) (1-2)
where f is the permeance of the membrane, K(T) is a function of temperature and molecular gas of the gas; r is the average radius of the pores, ε the porosity, t the thickness and τ the tortuosity of the membrane.
Furthermore, the power α will vary with the ratio of the mean free path, λ, with the average pore size of the membrane with three different scenarios:
- if λ/r > 1 then the mechanism is said to follow Knüdsen diffusion - if 0.5 < λ/r < 1 the regime is called transition regime - if λ/r < 0.5 the regime is called molecular diffusion
The mean free path is defined in Equation 3 as:
P d T kB × × Π × = 2 2
λ
(1-3)where kB the Boltzmann constant, T the temperature (K), d the average kinetic
diameter of the molecule and P the pressure.
64
A trade off is necessary and the pore size distribution needs to be narrow enough to address the wetting criterion while large enough to facilitate efficient vapor transport.
Both flat-sheet and hollow fibre membranes can be operated in MD [82, 86, 95, 108]. Figure 1-12 presents some geometrical differences between poly(vinyl-difluorure) (PVDF) flat sheet and hollow fibre 0.2 micron pore size membranes. Appropriate MD Membranes can be either symmetric or asymmetric with, respectively, one single thick active layer or a thin active layer reinforced on a support layer.
The active layer needs to be as thin as possible to enhance the permeance while presenting a low tortuosity path to the gas molecules (Equation 2). Membranes for MD generally have pore size distributions lying between 0.05 and 1 µm [59, 84, 109]. Typically, the porosity of commercially available membranes is often around 70% while the thickness of their active layer can vary from a few dozen up to a hundred microns.
65
Figure 1-12 Hollow fibre (left) and flat sheet (right) membranes [115-117]
1.3.3 Membrane distillation configurations
In MD, both feed and permeate come in contact with the membrane and infiltrate the surface of the pores [84, 109, 114]. The vapor pressure difference generates the driving force and water vapor is transferred across the membrane.
66
the membrane and a cold condensing plate on the permeate side [106, 126]. Figure 1-13 shows a schematic of the 4 different configurations.
Hot water stream Hot water stream
Hot water stream Cold plate
Hot water stream
Low pressure
Cold water stream
Condensation
Carrier gas
Humidity
Hot water stream Hot water stream
Hot water stream Cold plate
Hot water stream
Low pressure
Cold water stream
Condensation
Carrier gas
Humidity
Figure 1-13 The four different MD configurations; A, B C and D respectively refer to DCMD, VMD, AGMD and SWMD
67
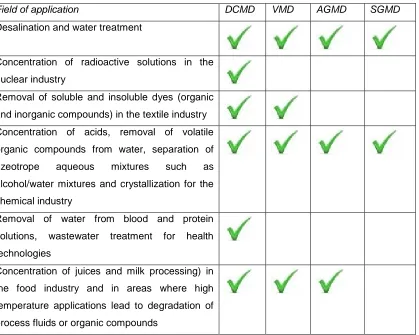
Table 1-2 Fields of application in which MD technology has been used [82, 84]
Field of application DCMD VMD AGMD SGMD
Desalination and water treatment
Concentration of radioactive solutions in the
nuclear industry
Removal of soluble and insoluble dyes (organic
and inorganic compounds) in the textile industry
Concentration of acids, removal of volatile
organic compounds from water, separation of
azeotrope aqueous mixtures such as
alcohol/water mixtures and crystallization for the
chemical industry
Removal of water from blood and protein
solutions, wastewater treatment for health
technologies
Concentration of juices and milk processing) in
the food industry and in areas where high
temperature applications lead to degradation of
process fluids or organic compounds
Although the criteria developed in this section [61] apply to the 4 configurations, DCMD is generally preferred since it provides higher flux by reducing the size of the air-gap of the process. The air-gap in DCMD is composed by solely the membrane thickness/porosity whereas because of the additional feature required to condense the water vapor, it is larger in the other setups. Furthermore the membrane is DCMD provides the highest resistance to permeability [84] therefore will more accurately identify membrane performance and be a convenient comparison technique to identify the best membrane or material amongst a series of samples.
68
Both heat and mass are transferred during a MD process. Controlling the temperatures of the feed, membrane surfaces and the bulk streams is fundamental to correctly master the process and calculate the permeance. Figure 1-14 shows the different parameters playing an important role in the process for a counter-flow configuration [100, 135-143].
Ti refers to the temperature, dTi the temperature variation, mi to the
mass, dmi the mass variation xi to the concentration and dxi the concentration
variation, while the indice F and D respectively refer to the feed and permeate and the indices 1 and 2 refer to the membrane surface on the hot and cold side. Furthermore, the membrane thickness is noted t and the stream velocities are vi. As seen in Figure 14, the temperature gradually decreases
on the feed side from the bulk value down to the membrane surface temperature (yellow curve), while it gradually increases on the permeate side because of water vapor condensing from the bulk permeate up to the membrane surface. Thus mass is transferred from the feed to the permeate side, while heat is transferred in the same direction [58, 144, 145].
tt
Figure 1-14 Heat and mass transfer in MD for a counter flow configuration
69
surface roughness and particularly simplify the complex pore structure of the membrane to cylindrical pores. Models have been written to take in consideration some of these parameters under specific conditions [86, 148-151].
Two properties, permeance, f, and permeability, k, are used to quantify mass transport across a membrane. The permeance is a true measurement of the amount of matter being transported across the membrane and for MD is a function of the processing parameters, while permeability enables comparison of membranes of different thicknesses. These two are respectively defined in Equations 4 and 5:
P A J f ∆ ×
= (1-4)
P A t J k ∆ × ×
= (1-5)
where J (kg/s) is the flux through the membrane, t (m) the membrane thickness, A (m2) the membrane area and, in the case of membrane distillation, ∆P (kPa) is the difference in vapor partial pressure across the membrane. The permeance can be determined by taking the gradient of a plot of flux against the vapor pressure difference, and dividing by the membrane area.
Furthermore, if the temperatures of the hot and cold streams are known, the vapor partial pressure can be calculated with Antoine’s equation:
− − = 45 3841 328 . 23 T e
P (1-6)
where the partial vapor pressure P is in Pa and the temperature T in Kelvin (K).


![Figure 1-12 Hollow fibre (left) and flat sheet (right) membranes [115-117]](https://thumb-us.123doks.com/thumbv2/123dok_us/7929470.1316656/65.595.90.298.76.440/figure-hollow-fibre-left-flat-sheet-right-membranes.webp)