O P T I M I S A T I O N A N D
I M P L E M E N T A T I O N OF FUZZY
C O N T R O L L E R S F O R P O W E R
S Y S T E M STABILISATION
by
M s Juan Shi, B.E.
A thesis submitted for the degree of
Doctor of Philosopliy
in the
Department of Electrical and Electronic Engineering
Faculty of Engineering
Victoria University of Technology
P.O.Box 14428, MMC, Melbourne
Victoria 3000, Australia
'FTS THESIS
621.31 SHI
30001004591220
Shi, Juan
Optimisation and
implementation of fuzzy
Contents
Contents
List of Figures I X
List of Tables xxui
List of Principal Symbols and Abbreviations X X V 1
Abstract xxxiv
s t a t e m e n t of Originality X X X V ] 1
Preface X X X V U I
Acknowledgements
xl
1 Introduction
1.1 Excitation Control and Its Role on Power S5^stem Stability L
1.2 The Definition of Power System Stabihty 1
1.3 The Application of Power System Stabihsers (PSSs)
Contents jj
1.5 Adaptive Power System Stabilisers 8
1.6 Fuz/>y Logic and Fuzzy Control 10
1.7 The Application of Fuzzy Controllers as PSSs 13
1.8 Motivation for the Thesis 14
1.9 Contributions of the Thesis 16
1.10 Organisation of the Thesis 17
2 E x p e r i m e n t a l S y s t e m s U s e d in t h e P o w e r L a b o r a t o r y 20
2.1 Introduction 20
2.2 Single-machine Infinite Bus Power System 20
2.3 Two-machine Infinite Bus Power System 23
3 E x c i t a t i o n Control S y s t e m D e s i g n 26
3.1 Introduction 2()
3.2 Mathematical Modelling of the Experimental System 27
3.3 Discrete-time Analytical Design Method 31
3.4 Digital Automatic Voltage Regulator (AVR) Design 34
3.5 Experimental Test Results 37
3.6 Concluding Remarks 39
4 P r o p o s e d D e s i g n of T w o F u z z y Control S c h e m e s 45
4.1 Introduction 45
Contents Hi
4.2.1 Structure of the FLC 45
4.2.2 D a t a B a s e 48
4.2.3 Rule Base 51
4.2.4 Defuzzification Strategies 5i}
4.2.5 Design Parameters of the FLC 55
4.3 Design of a FLC as a PSS 55
4.4 Design of the Proposed Fuzzy Logic Based PSS (FLBPSS) 64
4.5 Concluding Remarks 69
5 O p t i m i s a t i o n of t h e F u z z y Control S t r a t e g y 70
5.1 Introduction 70
5.2 Optimisation of the FLC by Observation of Model Behaviour 71
5.2.1 Optimisation of the FLC using Whole Overlap Ratio (WOR) . 71
5.2.2 Sensitivity to Nominal Parameter Variations and Robustness
to Operating Condition Variations 75
5.3 Optimal Setting of the FLBPSS Parameters and Sensitivity Analysis 80
5.3.1 Optimal Setting of the FLBPSS Parameters 80
5.3.2 Robustness to Operating Condition Variations and Sensitivity
to Nominal Parameter Variations 9;}
5.4 Comparison of the Proposed FLBPSS and Hassan's Self-tuned FLBPSS 96
5.4.1 Review of Hassan's Self-tuned FLBPSS (STFLBPSS) 96
Contents iv
5.4.3 Comparison of the Performance Index 98
5.4.'I Comparison of the Dynamic Response 9!)
5.5 Comparison Study of the Two Fuzzy Control Schemes 101
5.5.1 Comparison of the Performance Index 101
5.5.2 Comparison of the Dynamic Response 102
5.6 Concluding Remarks 102
6 I m p l e m e n t a t i o n S t u d y 112
6.1 Introduction 112
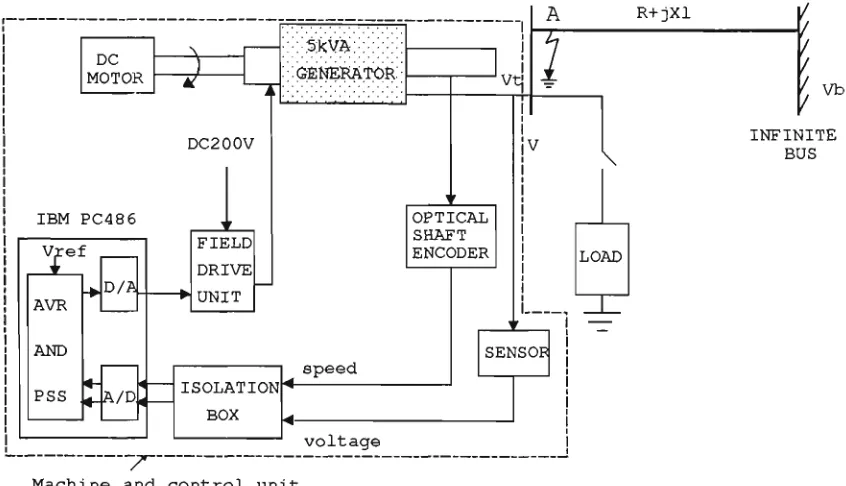
6.2 Hardware Development 113
6.2.1 Sensor 113
6.2.2 A / D and D / A Adapter 114
6.2.3 Field Drive Unit 114
6.2.'I Rotor Position Measurement by Using an Optical Shaft Encoder 114
6.3 Software Development 115
6.3.1 T h e M a i n Program 115
6.3.2 The Driver Routines 116
6.3.3 The Interrupt Set up and Handling Routines lit)
6.3.4 T h e FLBPSS Routine IK)
6.3.5 T h e AVR Routine 117
6.3.6 Screen Graphics 117
Contents v
6.3.8 The Block Diagram of the Software 117
6.4 Implementation Tests 117
6.4.1 Step Change in the Reference Voltage 119
6.4.2 Sudden Load Change 119
6.4.3 Three-phase to Ground Fault 121
6.5 Concluding Remarks 127
7 Application of the FLBPSS to Multi-machine Systems 131
7.1 Introduction 131
7.2 AVR Design 133
7.2.1 Design of the AVR for Generator 1 133
7.2.2 Design of the AVR for Generator 2 133
7.2.:i Practical Evaluation of the Designed AVRs 135
7.3 The Design and Optimisation of the FLBPSS 136
7.4 Simulation Results for the FLBPSS 136
7.5 Implementation and Test Results for the FLBPSS 137
7.5. i Step Change in the Reference Voltage at Generator 1 Side . . 137
7.5.2 Rated Load Change 137
7.5.3 Test Results Under Different Operating Conditions 148
7.5.4 Three-phase to Ground Fault 148
7.5.5 Transmission Line Loss Between Generators 1 and 2 157
Contents —— vi
8 Rules Reduction for the FLC Using Neural Networks 161
8.1 Introduction 161
8.2 Rul(?s Reduction for the FLC Using Neural Networks 163
8.3 Comparison Study 166
8.4 Concluding Remarks 170
9 Conclusions 171
9.1 A Retrospective Overview of the Thesis 171
9.2 Avenues to be Explored in Further Work 178
A Mathematical Model of the Synchronous Machine 181
A.l Mathematical Model of the Synchronous Machine 181
A.1.1 Flux Linkage Equations 182
A.1.2 Voltage Equations 184
A.1.3 Torque and Power Equations 185
A.1.4 Swing Equation 186
A.1.5 Load Equation 186
A.1.6 Formulation of State-Space Equations 187
A.1.7 Current Model 188
A.2 Linearisation of the Non-hnear Power System Model 191
A.2.1 Linearisation of the Generator State-Space Current Model . . 19L
A.2.2 Linearisation of the Load Equation for the Single-machine
Contents . vji
A.3 Simplified Linear Model 194
B Introduction to Fuzzy Set Theory 201
B.l Fuzzy Sets and Terminology 201
B.2 Fuzzy Set Theoretical Operations 203
B.3 Linguistic Variables and Linguistic Hedges 206
B.4 Fuzzy Inference and Composition 208
B.5 Fuzzy Logic and Approximate Reasoning 21'.?
C The Whole Overlap Ratio (WOR) 211
C.l The WOR for Linear Membership Functions 21't
C.2 The WOR for Quadratic Membership Functions 216
C.3 The WOR for Gaussian Membership Functions 219
D Mathematical Model for Multi-machine Power System 222
D.l Statement of the Problem 222
D.2 Conversion to a Common Reference Frame 224
D.3 Conversion of Machine Coordinates to System Reference 226
D.4 Linearised Model for the Network 228
D.5 Generator Equations 231
E The Input FPL File and the Generated Rule Base 232
E.l The Input FPL File 232
Contents . viii
F B i b l i o g r a p h y 241
G T u r b o Pascal Source C o d e For Single-Machine Infinite Bus Power
List of Figures
2.1 The overall view of the single-machine infinite bus experimental power
system 22
2.2 Experimental circuit configuration of single-machine infinite bus power
system 2.3
2.3 The overall view of the two-machine infinite bus experimental power
system 24
2.4 Two-machine infinite bus power system 25
3.1 Block diagram of the simplified linear model 2'.)
3.2 The voltage regulator loop 30
3.3 Unit step response of the voltage regulator loop 37
3.4 Terminal voltage corresponding to 1/2 sudden inductive load change
without and with the AVR, (a)-without AVR, (b)-with the designed
AVR 38
3.5 Terminal voltage corresponding to 3/4 sudden inductive load change
without and with the AVR, (a)-without AVR, (b)-with the designed
AVR 40
3.6 Terminal voltage corresponding to 1/2 sudden capacitive load change
without and with the AVR, (a)-without AVR, (b)-with the designed
List of Figures .\.
3.7 Terminal voltage corresponding to 3/4 sudden capacitive load change
without and with the AVR, (a)-without AVR, (b)-with the designed
AVR 41
3.8 Terminal voltage corresponding to 1/2 sudden resistive load change
without and with the AVR, (a)-without AVR, (b)-with the designed
AVR 41
3.9 Terminal voltage corresponding to 3/4 sudden resistive load change
without and with the AVR, (a)-without AVR, (b)-with the designed
AVR 42
3.10 Control signals corresponding to 1/2 and 3/4 sudden inductive load
changes with the AVR, ( a ) - l / 2 rated inductive load change, (b)-3/4
rated inductive load change 42
3.11 Control signals corresponding to 1/2 and 3/4 sudden capacitive load
changes with the AVR, ( a ) - l / 2 rated capacitive load change, (b)-3/4
rated capacitive load change 43
3.12 Control signals corresponding to 1/2 and 3/4 sudden resistive load
changes with the AVR, ( a ) - l / 2 rated resistive load change, (b)-3/4
rated resistive load change 4.3
3.13 Terminal voltage and control signal corresponding to a 10% step
in-crease in the reference voltage sustained for 7.5 seconds, (a)-terminal
voltage, (b)-control signal 44
3.14 Terminal voltage and control signal corresponding to a three-phase
to ground fault at A (Figure 2.2) sustained for 125 miUiseconds,
(a)-terminal voltage, (b)-control signal 44
4.1 Schematic diagram of a FLC 46
4.2 Inappropriate universe of discourse 57
List of Figures xi
4.4 Disproportionately large output membership function 59
4.5 Membership functions for both condition parts and consequent parts 60
4.6 Two sectors in the phase plane 65
4.7 T h e proposed non-linear membership functions 67
4.8 Gain factor related to distance D(k) 68
5.1 Membership functions after tuning 72
5.2 Performance index corresponding to a changes J — f(a) with
difter-ent Dj. values under the nominal operating condition for a 20% step
change in mechanical torque (/3 = —35) 81
5.3 Performance index corresponding to a changes J = f(a) with
differ-ent Or values under the nominal operating condition for a 20% step
change in mechanical torque (/3 = —38) 81
5.4 Performance index corresponding to a changes J = f(a) with
differ-ent Dr values under the nominal operating condition for a 20% step
change in mechanical torque (13 — —40) 82
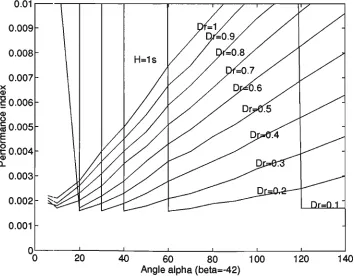
5.5 Performance index corresponding to a changes J = f(a) with
differ-ent Dr values under the nominal operating condition for a 20% step
change in mechanical torque (/S = —42) 82
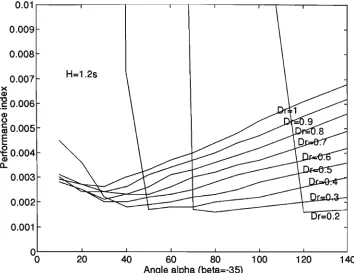
5.6 Performance index corresponding to a changes J = f(a) with
differ-ent Dr values under the nominal operating condition in response to
a three-phase to ground fault (/? = —35) 83
5.7 Performance index corresponding to a changes J = f{a) with
differ-ent Dr values under the nominal operating condition in response 1o
List of Figures xii
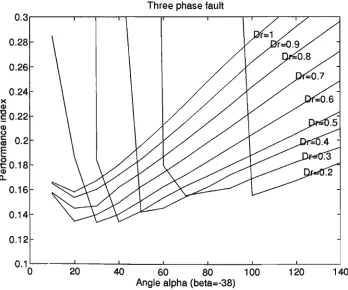
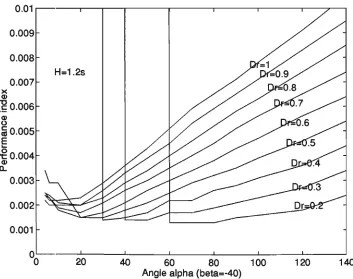
5.8 Performance index corresponding to o; changes J = f(a) with
differ-ent Dr values under the nominal operating condition in response to
a three-phase to ground fault (/5 = —40) 84
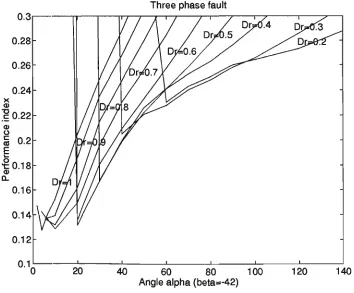
5.9 Performance index corresponding to a changes J = f(a) with
differ-ent Dr values under the nominal operating condition in response to
a three-phase to ground fault (/3 = —42) 84
5.10 Performance index corresponding to a changes J = f(a) with
differ-ent Dr values and -|-20% variation in inertia constant H for a 20%
step change in mechanical torque (iJ = 1.2s,^ =—35) 85
5.11 Performance index corresponding to a changes J = / ( a ) with
differ-ent Dr values and -|-20% variation in inertia constant H for a 20%
step change in mechanical torque (H = 1.2s., (3 = —38) 86
5.12 Performance index corresponding to a changes J = / ( « ) with
differ-ent Dr values and +20% variation in inertia constant H for a 20%
step change in mechanical torque (H = 1.2.5,/? = —40) 86
5.13 Performance index corresponding to a changes J = f(a) with
differ-ent Dr values and +20% variation in inertia constant H for a 20%
step change in mechanical torque (H ~ 1.1s, ^ — —42) 87
5.14 Performance index corresponding to a changes J = / ( a ) with
differ-ent Dr values and -20% variation in inertia constant H for a 20% step
change in mechanical torque (if = 0 . 8 s , ^ =—35) 87
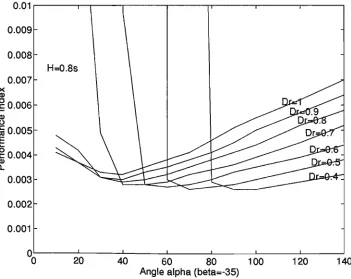
5.15 Performance index corresponding to a changes J = / ( a ) with
differ-ent Dr values and -20% variation in inertia constant H for a 20% step
change in mechanical torque (if = 0.85,/5 =—38) 88
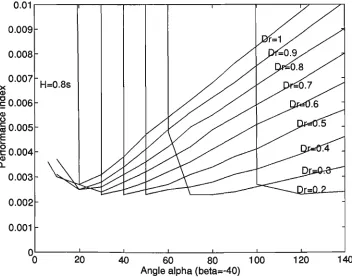
5.16 Performance index corresponding to a changes J = f(a) with
differ-ent Dr values and -20% variation in inertia constant E for a 20% step
List of Figures xiii
5.17 Performance index corresponding to a changes J — f(a) with
differ-ent Dr values and -20% variation in inertia constant H for a 20% step
change in mechanical torque (H = Q.8s, ^ = —42) 89
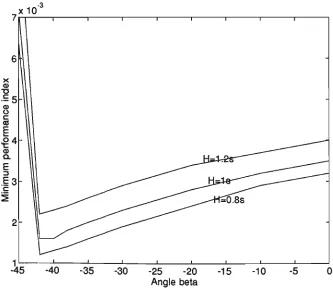
5.18 Minimum performance index corresponding to changes in ^ values
Jmiv = /(/^) (20 % step increase in mechanical torque) 8!)
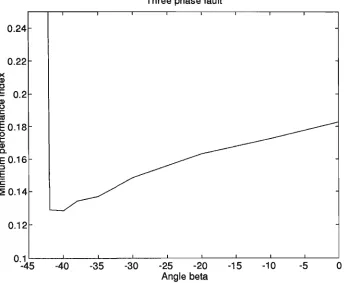
5.19 Minimum performance index corresponding to changes in f3 values
Jmiv = f{^) (three-phase to ground fault) 90
5.20 System response corresponding to a 20% step change in Tm under two
optimal settings 91
5.21 System response corresponding to a 20% step change in Tm and
a three-phase to ground fault, (a)-20% step increase in mechanical
torque, (b)-three-phase to ground fault 92
5.22 Performance index corresponding to changes in a J = /(<^) with
different Dr values in response to a 20% step increase in Tm under
operating condition P I (^ = —40) 93
5.23 Performance index corresponding to changes in a J = f(a) with
different Dr values in response to a three-phase fault under operating
condition P I (/? = - 4 0 ) 94
5.24 Performance index corresponding to changes in a J = f{a) with
different Dr values in response to a 20% step increase in Tm und(^r
operating condition P4 (^ = - 4 0 ) 94
5.25 Perlormance index corresponding to changes in a J = f(a) with
different Dr values in response to a three-phase fault under operating
comhtion P4 (f3 = - 4 0 ) 95
5.26 System responses at operating condition P4 with the corresponding
optimal settings (COS) and the nominal optimal settings (NOS),
(a)-20% step increase in mechanical torque, (b)-three-phase to ground
List of Figures xiv
5.27 System responses at PO with inertia constant parameter variation
H — 1.25 with the corresponding optimal settings (COS) and the
nominal optimal settings (NOS), (a)-20% step increase in mechanical
torque, (b)-three-phase to ground fault 105
5.28 System response corresponding to three-phase to ground fault
un-der different operating conditions with the nominal optimal settings
(NOS), (a)-operating conditions PO, P I , P2 and P4, (b)-operating
condition P 3 106
5.29 System response corresponding to a 20% step increase in mechanical
torque with the nominal optimal settings (NOS) for different system
parcimeter changes, (a)-±20% variation in if, (b)-±20% variation in
r'do 106
5.30 Membership functions used for the STFLBPSS 107
5.31 System response corresponding to a 20% step change in mechanical
torque and a three-phase fault under the nominal operating condition,
(a)-20% step increase in mechanical torque, (b)-three-phase fault . . 107
5.32 System response corresponding to a 20% step change in mechanical
torque under different operating conditions, (a)-(d) provide the speed
deviation responses under operating conditions P1-P4 respectively . . 108
5.33 System response corresponding to a three-phase to ground fault under
different operating conditions, (a)-(d) provide the speed deviation
responses under operating conditions P1-P4 respectively 108
5.34 Syst.em response corresponding to a 20% step change in mechanical
torque with ± 2 0 % variation in inertia constant H, (a)-if = 1.25,
(b)-if = l 5 , (c)-if = 0.8s 109
5.35 System response corresponding to a 20% step change in mechanical
torque with ± 2 0 % variation in TJ^Q, (a)-r^o = 0.414s, (b)-r^o = 0.3455,
List of Figures xv
5.36 System response corresponding to a 20% step change in mechanical
torque with ± 2 0 % variation in Xg, (a)-Xe = O.ASpu, (h)-Xe = O.Apxi,
{c)-Xe = 0.32pu n o
5.37 System response corresponding to a 20% step change in mechanical
torque and reference voltage change (without PSS) 110
5.38 System response corresponding to a 20% step change in mechanical
torque and reference voltage change (with the FLC) I l l
5.39 System response corresponding to a 20% step change in mechanical
torque and reference voltage change (with the FLBPSS) I l l
6.1 Sensor circuit of rectifier, potential divider and filter circuit 11;3
6.2 Software diagram (Part I) 118
6.3 Software diagram (Part II) 118
6.4 Rotor angle and speed deviation corresponding to a 10% step
in-crease in the reference voltage sustained for 7.5 seconds (without the
FLBPSS), (a)-rotor angle, (b)-speed deviation 120
6.5 Rotor angle and speed deviation corresponding to a 10% step increase
in the reference voltage sustained for 7.5 seconds (with the FLBPSS),
(a)-rotor angle, (b)-speed deviation 121
6.6 Control signal corresponding to a 10% step increase in the reference
voltage sustained for 7.5 seconds, (a)-without the FLBPSS and
(b)-with the FLBPSS 122
6.7 Rotor angle and speed deviation corresponding to sudden resistive
load change without the FLBPSS (operating condition O C l ) ,
List of Figures x\i
6.8 Rotor angle and speed deviation corresponding to sudden resisti\'e
load change with the FLBPSS (operating condition O C l ) , (a)-rotor
angle, (b)-speed deviation 123
6.9 Rotor angle and speed deviation corresponding to sudden inductive
load change without the FLBPSS (operating condition O C l ) ,
(a)-rotor angle, (b)-speed deviation 124
6.10 Rotor angle and speed deviation corresponding to sudden inductive
load change with the FLBPSS (operating condition O C l ) , (a)-rotor
angle, (b)-speed deviation 124
6.11 Rotor angle and speed deviation corresponding to sudden capacitive
load change without the FLBPSS (operating condition O C l ) ,
(a)-rotor angle, (b)-speed deviation 125
6.12 Rotor angle and speed deviation corresponding to sudden capaciti^^e
load change with the FLBPSS (operating condition O C l ) , (a)-rotor
angle, (b)-speed deviation 125
6.13 Rotor angle and speed deviation corresponding to sudden resistive
load change without the FLBPSS (operating condition 0 C 2 ) ,
(a)-rotor angle, (b)-speed deviation 126
6.14 Rotor angle and speed deviation corresponding to sudden resisti\'e
load change with the FLBPSS (operating condition 0 C 2 ) , (a)-rotor
angle, (b)-speed deviation 126
6.15 Rotor angle and speed deviation corresponding to sudden resistive
load change without the FLBPSS (operating condition 0 C 3 ) ,
(a)-rotor angle, (b)-speed deviation 128
6.16 Rotor angle and speed deviation corresponding to sudden resistive
load change with the FLBPSS (operating condition 0 C 3 ) , (a)-rotor
List of Figures xvii
6.17 Rotor angle and speed deviation corresponding to sudden resistive
load change without the FLBPSS (operating condition 0 C 4 ) ,
(a)-rotor angle, (b)-speed deviation 129
6.18 Rotor angle and speed deviation corresponding to sudden resisti^'e
load change with the FLBPSS (operating condition 0 C 4 ) , (a)-rotor
angle, (b)-speed deviation 129
6.19 Rotor angle and speed deviation corresponding to a three-phase fault
at A (Figure 2.2) sustained for 125 milliseconds (without the FLBPSS),
(a)-rotor angle, (b)-speed deviation 130
6.20 Rotor angle and speed deviation corresponding to a three-phase fault
at A (Figure 2.2) sustained for 125 milliseconds (with the FLBPSS),
(a)-rotor angle, (b)-speed deviation 130
7.1 Terminal voltage corresponding to a 10% step change in reference
voltage at generator 1 side, (a)-terminal voltage for generator 1,
(b)-terminal voltage for generator 2 139
7.2 Terminal voltage corresponding to 3/4 rated inductive load change,
(a)-terminal voltage for generator 1, (b)-terminal voltage for
genera-tor 2 139
7.3 Terminal voltage corresponding to 3/4 rated capacitive load change,
(a)-terminal voltage for generator 1, (b)-terminal voltage for
genera-tor 2 140
7.4 Terminal voltage corresponding to 3/4 rated resistive load change,
(a)-terminal voltage for generator 1, (b)-terminal voltage for
genera-tor 2 140
7.5 Terminal voltage corresponding to a three-phase to ground fault,
(a)-terminal voltage for generator 1, (b)-(a)-terminal voltage for generator
List of Figures — _ xviii
7.6 Excitation control signal corresponding to a three-phase to ground
fault, (a)-control signal for generator 1, (b)-control signal for
genera-tor 2 141
7.7 System response corresponding to a 10% step change in reference
voltage and mechanical torque without PSS, (a)-speed deviation for
generator 1, (b)-speed deviation for generator 2 142
7.8 System response corresponding to a 10% step change in reference
voltage and mechanical torque with the FLBPSS, (a)-speed deviation
for generator 1, (b)-speed deviation for generator 2 142
7.9 System response corresponding to a 20% step change in reference
volt-age and mechanical torque without the FLBPSS, (a)-speed deviation
for generator 1, (b)-speed deviation for generator 2 14:5
7.10 System response corresponding to a 20% step change in reference
voltage and mechanical torque with the FLBPSS, (a)-speed deviation
for generator 1, (b)-speed deviation for generator 2 143
7.11 Rotor angle and speed deviation for generator 1 corresponding to a
10% step increase in the reference voltage at generator 1 sustained for
7.5 seconds (without the FLBPSS), (a)-rotor angle, (b)-speed deviationl44
7.12 Rotor angle and speed deviation for generator 1 corresponding to a
10% step increase in the reference voltage at generator 1 sustained
for 7.5 seconds (with the FLBPSS), (a)-rotor angle, (b)-speed deviation 144
7.13 Rotor angle and speed deviation for generator 2 corresponding to a
10% step increase in the reference voltage at generator 1 sustained for
7.5 seconds (without the FLBPSS), (a)-rotor angle, (b)-speed deviation 145
7.14 Rotor angle and speed deviation for generator 2 corresponding to a
10% step increase in the reference voltage at generator 1 sustained
List of Figures _ _ ^ xix
7.15 Rotor angle and speed deviation for generator 1 corresponding to
sudden resistive load change (without the FLBPSS), (a)-rotor angle,
(b)-speed deviation 14()
7.16 Rotor angle and speed deviation for generator 1 corresponding to
3/4 rated sudden resistive load change (with the FLBPSS), (a)-rotor
angle, (b)-speed deviation 146
7.17 Rotor angle and speed deviation for generator 2 corresponding to 3/4
rated sudden resistive load change (without the FLBPSS), (a)-rotor
angle, (b)-speed deviation 147
7.18 Rotor angle and speed deviation for generator 2 corresponding to
3/4 rated sudden resistive load change (with the FLBPSS), (a)-rotor
angle, (b)-speed deviation 147
7.19 Rotor angle and speed deviation for generator 1 corresponding to 3/4
rated sudden inductive load change (without the FLBPSS), (a)-rotor
angle, (b)-speed deviation 149
7.20 Rotor angle and speed deviation for generator 2 corresponding to 3/4
rated sudden inductive load change (without the FLBPSS), (a)-rotor
angle, (b)-speed deviation 149
7.21 Rotor angle and speed deviation for generator 1 corresponding to 3/4
rated sudden inductive load change (with the FLBPSS), (a)-rotor
angle, (b)-speed deviation 150
7.22 Rotor angle and speed deviation for generator 2 corresponding to 3/4
rated sudden inductive load change (with the FLBPSS), (a)-rotor
angle, (b)-speed deviation 150
7.23 Rotor angle and speed deviation for generator 1 corresponding to 3/4
rated sudden capacitive load change (without the FLBPSS), (a)-rotor
List of Figures xx
7.24 Rotor angle and speed deviation for generator 2 corresponding to 3/4
rated sudden capacitive load change (without the FLBPSS), (a)-rotor
angle, (b)-speed deviation 151
7.25 Rotor angle and speed deviation for generator 1 corresponding to 3/4
rated sudden capacitive load change (with the FLBPSS), (a)-rotor
angle, (b)-speed deviation 152
7.26 Rotor angle and speed deviation for generator 2 corresponding to 3/4
rated sudden capacitive load change (with the FLBPSS), (a)-rotor
angle, (b)-speed deviation 152
7.27 Rotor angle and speed deviation for generator 1 corresponding to 3/4
rated sudden resistive load change without the FLBPSS (Operating
condition O C l ) , (a)-rotor angle, (b)-speed deviation 153
7.28 Rotor angle and speed deviation for generator 2 corresponding to 3/4
rated sudden resistive load change without the FLBPSS (Operating
condition O C l ) , (a)-rotor angle, (b)-speed deviation 15.3
7.29 Rotor angle and speed deviation for generator 1 corresponding to
3/4 rated sudden resistive load change with the FLBPSS (Operating
condition O C l ) , (a)-rotor angle, (b)-speed deviation 154
7.30 Rotor angle and speed deviation for generator 2 corresponding to
3/4 rated sudden resistive load change with the FLBPSS (Operating
condition O C l ) , (a)-rotor angle, (b)-speed deviation 154
7.31 Rotor angle and speed deviation for generator 1 corresponding to
a three-phase fault at B (Figure 2.4) sustained for 125 milliseconds
(without the FLBPSS), (a)-rotor angle, (b)-speed deviation 155
7.32 Rotor angle and speed deviation for generator 1 corresponding to
a three-phase fault at B (Figure 2.4) sustained for 125 miUiseconds
List of Figures xxi
7.33 Rotor angle and speed deviation for generator 2 corresponding to
a three-phase fault at B (Figure 2.4) sustained for 125 milliseconds
(without t h e FLBPSS), (a)-rotor angle, (b)-speed deviation 156
7.34 Rotor angle and speed deviation for generator 2 corresponding to
a three-phase fault at B (Figure 2.4) sustained for 125 milliseconds
(with t h e FLBPSS), (a)-rotor angle, (b)-speed deviation 156
7.35 Rotor angle and speed deviation for generator 1 corresponding to the
loss of the transmission line (without the FLBPSS), (a)-rotor angle,
(b)-speed deviation 157
7.36 Rotor angle and speed deviation for generator 2 corresponding to the
loss of the transmission line (without the FLBPSS), (a)-rotor angle,
(b)-speed deviation 158
7.37 Rotor angle and speed deviation for generator 1 corresponding to
t h e loss of the transmission line (with the FLBPSS), (a)-rotor angle,
(b)-speed deviation 158
7.38 Rotor angle and speed deviation for generator 2 corresponding to
the loss of the transmission line (with the FLBPSS), (a)-rotor angle,
(b)-speed deviation 159
8.1 Speed deviation and rotor angle corresponding to a 10% step increase
in mechanical torque followed by a 10% step increase in the reference
voltage sustained for 7.5 seconds with the original 49-rule FLC . . . 1 6 8
8.2 Speed deviation and rotor angle corresponding to a 10% step increase
in mechanical torque followed by a 10% step increase in the reference
voltage sustained for 7.5 seconds with the 24-rule FLC 168
8.3 Speed deviation and rotor angle corresponding to a 20% step increase
in mechanical torque followed by a 20% step increase in the reference
List of Figures xxii
8.4 Spe(>d deviation and rotor angle corresponding to a 20% step increase
in mechanical torque followed by a 20% step increase in the reference
voltage sustained for 7.5 seconds with the 24-rule FLC 169
C.l Two adjacent linear membership functions 215
C.2 Two adjacent quadratic membership functions 217
C.3 Two adjacent exponential membership functions 219
List of Tables
2.1 Ratings of the single-machine infinite bus power system 21
2.2 Generator parameters 21
2.3 Ratings of the two-machine infinite bus power system 23
2.4 Generator parameters 23
4.1 The decision table 62
4.2 Comparison of the defuzzification methods 64
5.1 Some usual membership functions and WOR evaluation formulas . . 73
5.2 The performance index corresponding to changes in WOR (10% step
change in Tm and Vref) 73
5.3 The performance index corresponding to changes in WOR (20% step
change in Tm and Ke/) 74
5.4 The performance index corresponding to changes in WOR with
dif-ferent defuzzification methods (20% step change in T^ ) 75
5.5 The performance index corresponding to changes in WOR with
dif-ferent defuzzification methods (three-phase to ground fault) 7
5.6 The performance index corresponding to changes in WOR (Mamdani,
List of Tables xxjv
5.7 The performance index corresponding to changes in WOR (Mamdani,
Means of maximum, 20% step increase in mechanical torque) 7()
5.8 The performance index corresponding to changes in WOR (Larseii,
Centroid, 20% step increase in mechanical torque) 77
5.9 The performance index corresponding to changes in WOR (Larsen,
Means of maximum, 20% step increase in mechanical torque) 77
5.10 The performance index corresponding to changes in WOR with
dif-ferent implication and defuzzification methods, three-phase to ground
fault 78
5.11 Operating conditions 78
5.12 Performance index corresponding to changes in WOR under different
operating conditions (Mamdani, Means of maximum or centroid, 20%
step increase in mechanical torque) 78
5.13 Performance index corresponding to changes in WOR under different
operating conditions (Larsen, Means of maximum or centroid, 20%
step increase in mechanical torque) 7!)
5.14 Performance index corresponding to changes in WOR under different
operating conditions (Mamdani, Centroid, three-phase to ground fault) 79
5.15 Perlormance index corresponding to changes in WOR under different
operating conditions (Mamdani, Means of maximum, three-phase to
ground fault) 79
5.16 Optimal settings of the FLBPSS for different operating conditions . . 95
5.17 Comparison of the performance index (small perturbation of a 20%
step change in mechanical torque Tm) 9!)
5.18 Comparison of the performance index (large perturbation of a
List of Tables xxv
5.19 Comparison of t h e performance index for parameter changes (small
perturbation of a 20% step change in mechanical torque Tm) 99
5.20 Comparison of the performance index for parameter changes (large
perturbation of a three-phase fault at A of Figure (2.2) sustained for
125 miUiseconds) 100
5.21 Comparison of the performance index (small perturbation of a 20%
step change in mechanical torque Tm) 100
5.22 Comparison of the performance index (large perturbation of a
three-phase fault at A of Figure (2.2) sustained for 125 milliseconds) . . . . 100
5.23 Comparison of the performance index of the FLC and the FLBPSS
(small perturbation of a 20% step increase in mechanical torque) . . . 101
5.24 Comparison of the performance index of the FLC and the FLBPSS
(large perturbation of a three-phase to ground fault) 102
6.1 Operating conditions for single-machine infinite bus power system . . 119
7.1 Operating conditions for two-machine infinite bus power system . . . 148
8.1 T h e decision table after learning 166
8.2 The performance index corresponding to changes in W O R (20% step
increase in mechanical torque followed by a 10% step increase in the
reference voltage sustained for 7.5 seconds) 167
8.3 The performance index corresponding to different mechanical torque
xxvi
List of Principal Symbols and
Abbreviations
Unless otherwise stated, the following definitions of the notation are applied
through-out this thesis.
Symbol or Abbreviation A a,b,c A,B,C A,B AC A/D a 6s arg AVQ AVR B CON COS CPSS D D-D' D/A d-axis D(k),Dr DC DIL EMF Epoit) EFDA{t) Description
field drive unit gain
phase identification
phase identification
linear continuous time system state matrix
Alternative Current
Analog to Digital
absolute value
argument
Adaptive Vector Quantisation
Automatic Voltage Regulator
voltage sensor gain
Concentration
Corresponding Optimal Setting
Conventional Power System Stabiliser
Damping constant
generator damper winding
Digital to Analog
direct axis
distance parameter
Direct Current
Dilation
Electromotive Force
generator stator EMF
linearised generator stator EMF
List of Principal Symbols and Abbreviations xxvn e(t),e(kT) E,{t) Edit)
E'Me'^it)
E'At)
E[Af
F F-F' FLC FLBPSS FNN FPL F(t) F(z) F F-a G(k) Gs{s) G(z) GAVR{Z) H h height{F) I/O INTiit)
iait),ib{t),ic[t) ipit)error signal 3.3
generator q-axis component of stator EMF App.A
generator d-axis component of stator EMF App.A
generator q-axis transient stator EMF App.A
generator d-axis transient stator EMF App.A
steady-state value of E'g(t) App.A
linearised generator q-axis transient stator EMF 3.2
a set of non-linear function App.A
Fuzzy set App.B
generator field winding App.A
Fuzzy Logic Controller 1.7, 4.2
Fuzzy Logic Based Power System Stabiliser 1.7, 4.4
Fuzzy Neural Networks 9.2
Fuzzy Programming Language 8.2, App.E
restore force of an inverted pendulum 8.1
desired close loop pulse transfer function 3.3
a-cut of fuzzy set F App.B
strong a-cut of fuzzy set F App.B
gain factor 4.4
continuous time power system stabiliser
transfer function 1.4
z transform of the plant Gp(s) 3.3
discrete time transfer function of the AVR 3.3
generator inertia constant 2.2
maximum height of the intersection between
two adjacent MFs App.C
height of a fuzzy set F App.B
Input Output port 6.1
Intensification App.B
generator current App.A
generator three-phase stator current App.A
List of Principal Symbols and Abbreviations xxvni ipAit) iD{t),iQ{t)
io^it)
idit)
idAit)Hi)
hit)
iqAit)m)
iqAit)m
I A I J "min K KA K B Ko KKi '^ Ke
L
L
Le
m , m i , m 2
MAX, max MIN
M F
M I M O
MISO
linearised generator field current App.A
generator damper winding current App.A
linearised generator damper winding current App.A
generator d-axis stator current App.A
linearised generator d-axis stator current App.A
generator d-axis stator current App.A
generator q-axis stator current App.A
linearised generator q-axis stator current App.A
generator q-axis stator current App.A
linearised generator damper winding current App.A
generator terminal current App.A
complex current vector for multi-machine system App.D
complex current vector use common reference frame App.D
performance index 5.1
minimum performance index 5.3
generator DC gain 3.2
voltage regulator gain 1.1
Knowledge Base 4.2
conventional power system stabiliser DC gain 1.4
number of required sample period 3.4
coefficient of single-machine infinite bus
power system 3.1, App.A
transportation lag 3.3
switching line in the phase plane 4.4
transmission line inductance App.A
generator self or mutual inductance App.A
parameters of two adjacent MFs App.C
m a x i m u m 4.2, App.C;
minimum App.C
Membership Function 4.4
Multi-Input Multi-Output 1.6
XXIX M fhij NiOiik)} NB NM NN NOS NS
O C l ~ 0 C 4
P
P B
Piik)
PO - Pi Peit) PF P M Pmit) PS PSS pu P{6.ik)] q-axis R,S r r Re R\o-,Ri2i R20 RB RG Ri -ftm Rs
matrix for linearised multi-machine system
general t e r m of the matrix M
membership function for the FLBPSS
Negative Big
Negative Medium
Neural Networks
Nominal Optimal Setting
Negative Small
Operating Conditions
real power
Positive Big
a point in the phase plane
operating conditions electrical power Power Factor Positive Medium mechanical power Positive Small
Power System Stabiliser
per unit
membership function for the FLBPSS
quadrature axis
fuzzy relation
generator winding resistance
number of elements
transmission line resistance
transmission line resistance
Boolean fuzzy implication
Goguen's fuzzy implication
Larson's product operation of fuzzy implication
Mamdani's mini operation of fuzzy implication
standard fuzzy implication
X X X
P^Za
RZm
^ 1 ? • • • 5 ^ n
Si^ sup
SECV
SISO
SMIB
STFLBPSS
U-)
Ut)
Tmit)
T
TmAit)
Tait)
tr ATsu(kT)
u uU
U,V,W
'-J max Usv(t)
Vdit) VdAit)Vdit)
VFit) VFAit)v,it)
VgAit)sequence fuzzy implication
Zadeh's max-min rule of implication
linguistic variables
linguistic values of the linguistic variables
supremum
State Electricity Commission Victoria
Single-Input Single-Output
Single-Machine Infinite Bus
Self-tuned Fuzzy Logic Based PSS
damping torque
electrical torque
mechanical torque
mechanical torque
linearised mechanical torque
accelerating torque
rising time
synchronising component of the electrical torque
control signal
driving function
a generic element in a universe of discourse
control signal
universe of discourse
m a x i m u m stabilising signal
stabilising signal
generator voltage
generator d-axis stator voltage
linearised generator d-axis stator voltage
generator d-axis stator voltage
generator field voltage
linearised generator field voltage
generator q-axis stator voltage
linearised generator q-axis stator voltage
List of Principal Symbols and Abbreviations xxxi
Vqit) generator q-axis stator voltage App.A
K e / 5 K e / ( 0 reference voltage 1.4,3.2
Viit) generator terminal voltage 3.2, App.A
VtAit) linearised generator terminal voltage 3.2
VS Very SmaU 4.3
Vca infinite bus voltage App.A V complex voltage vector for multi-machine system App.D
A
V complex voltage vector use common reference frame App.D
W O R Whole Overlap Ratio 1.10, 5.2
X state variable App.A Xd generator d-axis component of synchronous reactance 2.2, 2.3
Xq generator q-axis component of synchronous reactance 2.2, 2.3 x'j^ generator d-axis transient reactance 2.2, 2.3 x' generator q-axis transient reactance 2.2, 2.3
Xe transmission line reactance 2.3
^10,-^12,^20 transmission line reactance 2.3
xit), Oit) linear and angular position of an inverted pendulum 8.1
V short circuit state admittance matrix App.D Z open circuit state impedance matrix App.D
ZR Zero 4.3
a infinite bus voltage angle App.A a threshold level which forms a parameter varying
as [0,1] 4.2
a, /3 parameters in the phase plane for FLBPSS 4.4
r voltage sensor time constant 3.2
To ~ T4 time constant of conventional PSS 1.4
T^Q d-axis open circuit transient time constant 2.2, 3.2
TA conventional analog AVR time constant 1.1
angular velocity 1.1
rated synchronous generator speed 3.2
synchronous speed 2.2
syn
U)Ait) 6
m
SAit) AT Aio Aoj 6ij ^ijAm
Xdit)Mt)
Xrit)
Kit)
AQ(0e
Oiik) 00 l^Priu)
f^A^PBu
n
• 0n
*+
+
© i±) Alinearised generator speed
distance parameter between two adjacent MFs
generator rotor angle
linearised generator rotor angle
sampling interval
speed deviation
acceleration
rotor angle between machine i and j
linearised value of Sij
flux linkage of the synchronous generator
generator d-axis stator flux linkage
generator d-axis damper winding flux linkage
generator field winding flux linkage
generator q-axis stator flux linkage
generator q-axis damper winding flux linkage
rotor position
phase angle in the phase plane
initial angle
fuzzy membership function
membership function of a fuzzy set F
membership function for two fuzzy sets A and B
List of Principal Symbols and Abbreviations xxxiii
App.B
App.B
5.1, App.D V
A
E
max
min
xxxiv
Abstract
This thesis investigated t h e application of fuzzy controllers as real-time power
system stabilisers for single-machine and two-machine infinite bus power systems.
T h e advantages of using t h e - s t a t e - o f - t h e - a r t power system stabilisers to
d a m p low-frequency oscillation in power systems is well known. T h e most widely
used conventional power system stabiliser is the lead-lag compensator where the
gain settings are fixed at certain values and determined for a particular operating
condition. The design of the conventional power system stabiliser is based on a
lin-ear approximation of the non-linlin-ear power plant. This means that the conventional
power system stabiliser can provide the optimal performance only for t h a t particular
operating point. Since the operating point of a power system drifts as a result of
continuous load changes or unpredictable major disturbances such as a three-phase
fault, the fixed gain conventional power system stabiliser can not adapt the
sta-biliser parameters in real time based on on-line measurements. Although general
parameters can be decided for a conventional power system stabiliser according to
a particular range of operating conditions, the design procedure is very complex.
For multi-machine systems, individual machine may have different requirements of
damping torque and synchronising torque, and multi-machine multi-mode power
system stabilisation techniques must be sought, especially when many conventional
power system stabilisers are used in the system and their coordination has to be
taken into consideration. These constraints made the design of the conventional
power system stabiliser even more complex.
Self-tuning and adaptive power system stabilisers have been employed to adapt
the stabiliser parameters to maintain good dynamic performance over a wide range
of operating conditions. However, self-tuning and adaptive power system stabilisers
suffer from a major drawback of requiring model identification in real-time which is
very t i m e cojisuming and computational intensive. Therefore, self-tuning and
adap-tive power system stabilisers are difficult to realise because they require parameter
identification, state observation and feedback gain computation.
Abstract xxxv
schemes for [)ower system stabilisation. Two fuzzy control schemes are proposed
and explored in the thesis. One of the fuzzy control schemes involves a f u z z y logic
c o n t r o l l e r ( F L C ) being applied to a power system as a power system stabiliser.
T h e core of t h e FLC is a set of linguistic control rules related by the dual concepts of
fuzzy implication and the compositional rule of inference. In essence, the FLC
pro-vides an algorithm which can convert the linguistic control strategy based on expert
knowledge into an automatic control strategy. The second fuzzy control scheme
involves the development of a F u z z y Logic B a s e d P o w e r S y s t e m S t a b i l i s e r
( F L B P S S ) based on fuzzy set theory. The stabilising signal is computed according
to t h e proposed new non-linear fuzzy membership functions depending on the speed
and acceleration states of the synchronous generator. These fuzzy control schemes
are very suitable for on-line control due to their lower computational burden,
sim-plicity and robustness. T h e design frame work of these control schemes does not
necessitate the use of a mathematical model to describe the dynamics of the
con-trol system. Comprehensive sensitivity analysis has been carried out to assess the
robustness of the FLC and FLBPSS for changes in system parameters and under
different operating conditions for both small and large perturbations. The input and
output membership functions of the FLC were adjusted according to an evaluation
index in order to achieve the optimal performance. The initial FLC design with a
complete filled rule table (49 rules) have been reduced using neural network
tech-niques to improve the dynamic performance. Optimisation of the two fuzzy control
schemes is carried out through digital simulation using a performance index.
In ordei- to carry out an investigation into the design, optimisation and
im-plementation of the two fuzzy control schemes, it is essential to design a digital
a u t o m a t i c v o l t a g e r e g u l a t o r ( A V R ) . A discrete-time analytical design method
is employed. T h e effectiveness of the designed automatic voltage regulator is
demon-strated through simulation and implementation.
The optimised fuzzy controller has also been implemented in real-time for
on-line control of both single-machine and two-machine infinite bus power systems. T h e
effectiveness of the fuzzy controller was experimentally confirmed by observing the
Abstract xxxvi
to ground fault. Numbers of tests have also been conducted at various operating
conditions. A very oscillatory generator rotor angle and speed deviation were
ob-served without any stabilisation control when the system is subjected to the above
disturbances. The oscillation of rotor angle and speed deviation were substantially
damped out with the fuzzy controller in operation. The simulation and experimental
results reveal that the optimised fuzzy controller has enhanced the damping of both
the dynamic and transient stability of the single-machine and two-machine infinite
X X X V J J
s t a t e m e n t of Originality
I hereby certify t h a t the work embodied in this thesis is the result
of original research and has not been submitted for a higher degree to
any other University or Institution.
This thesis may be made available for consultation within the
Uni-versity Library and may be photocopied or lent to other libraries for the
purposes of consultation if accepted for the award of the degree.
^Jc^^n--:;
(Signed)
XXXViJJ
Preface
This thesis examines the optimisation and implementation of fuzzy controllers
for power system stabilisation. An optimal fuzzy controller has been used on-line
in real time for both single-machine and two-machine infinite bus power systems.
A digital automatic voltage regulator has also been designed. A listing of all the
relevant publications [Shi, Herron and Kalam, 1992; Shi, Herron and Kalam, 1993
and Shi, Herron and Kalam, 1994] is provided here:
1. J.Shi, L.H.Herron, A.Kalam," Design and Implementation of a Fuzzy
Logic Based Power System Stabilizer "AMSE periodicals: ADVANCES
IN MODELLING and ANALYSIS, C. AMSE Press, Vol. 42, N0.4, 1994,
pp. 39-52.
2. J.Shi, L.H.Herron, A.Kalam, "Optimization of Fuzzy Controllers as
Real-time Power System Stabilizers ", Accepted for publication in the
spe-cial issue on "Control Applications of Fuzzy Logic" of the International
Journal for Engineering Applications of Artificial Intelligence, Pergamon
Press, 1994.
3. J.Shi, L.H.Herron, A.Kalam, "Comparison of Fuzzy Logic Based and Rule
Based Power System Stabilizer", The first IEEE Conference on Control
Applications, September 13-16, 1992, Stouffer Center Plaza Hotel,
Day-ton, Ohio, USA, pp. 692-697.
4. J.Shi, L.H.Herron, A.Kalam, "Application of Fuzzy Logic Based Power
S}'stem Stabilizer for a Synchronous Machine", Australasia UniA^ersities
Power and Control Engineering Conference, 1-2 October, 1992, Brisbane,
AustraMa, pp. 285-290.
5. J.Shi, L.H.Herron, A.Kalam, "A Fuzzy Logic Controller Applied to Power
SA'stem Stabilizer for a synchronous Machine Power System", IEEE
Re-gion 10 Conference, TENCON'92, llth-13th November, 1992, Melbourne,
Australia, pp. 346-350.
Preface xxxix
Power System Stabihzation", IEEE Region 10 Conference, TENCON'93,
18-22 October, 1993, Beijing , China, Vol.5, pp. 200-204.
7. J.Shi, L.H.Herron, A.Kalam, "Simulation Study and Application of A
Fuzzy Logic Controller for Power System Stabihzation", The 2nd
In-ternational Conference on Modelling and Simulation, July 12-14, 1993,
Melbourne, Austraha, Vol.2, pp. 725-734.
8. L.Reznik, J.Shi, "Simulation Study of the Choice of A Membership
Func-tion Model For Control ApplicaFunc-tions", The 2nd InternaFunc-tional Conference
on ModeUing and Simulation, July 12-14, 1993, Melbourne, Austraha,
Vol.1, pp. 209-217.
9. J.Shi, L.H.Herron, A.Kalam, " Design and Implementation of a P(> Based
Automatic Voltage Regulator and Fuzzy Logic Power System Stabilizer",
lEE International Conference on Advances in Power System Control,
Op-eration and Management, 7-10 Dec, 1993, Hong Kong, pp. 293-298.
10. J.Shi, L.H.Herron, A.Kalam, " Design and Implementation of a Fuzzy
Logic Controller for Power System Stabilization ", The 2nd IEEE
Confer-ence on Control Applications, Le Meridien Vancouver Hotel, Vancouvei,
Acknowledgements
First of all, I would like to thank my principal supervisor. Dr. Len H. Herron,
for his invaluable support and encouragement throughout this research. I am very
grateful to his help in administrative as well as financial matters.
I would also like to express my gratitude to my co-supervisor, Dr. Akhtar
Kalam, for his guidance and support during this research and in the writing of this
thesis.
My acknowledgement and gratitude also go to Mr. Ralph Phillips for his skillful
assistance in setting up the equipment in the Power Laboratory. Thanks also go to
Mr. Neil Hxmter who helped me set up A / D and D / A converters for my digital
controller.
I have received generous assistance from other staff members in the
Depart-m e n t . My gratitude goes to Dr. Lige Xiafor initial assistance in using the MatrixX
software package and his advice on the controller design. I would also like to thank
Dr. Qin Jiang for providing me with her work and for being an excellent host in a
very helpful visit to the Power Laboratory at Monash University, Clayton. I would
like to thank Dr. Leon Reznik and Mr. Adrian Stoica for many helpful discussions
on neural nee works and fuzzy set theory.
I sincerely thank my colleagues Mr. Zejian Chen and Mr. Huang Ming Li for
advice on set ting up the single-machine infinite bus power system.
I appreciate t h e financial support from the Department of Electrical and
Elec-tronic Engineering at Victoria University of Technology. The department also
pro-vided m e wil.h financial assistance to participate in international and national
con-ferences in which I exchanged information with other colleagues in the area. I have
also been financially supported by a Special Overseas Postgraduate Fund
Scholar-ship provided by Department of Employment, Education and Training for which I
a m thankful.
Acknowledgements xli
up with all the love, understanding and wisdom for which I am greatly indebted.
I would also like to express my gratitude to my husband Les Nakonieczny for his
encouragement and support to accomplish my education. My gratitude also extends
to my brother and sister, my friend Yiqiu Li and Jian Wang for their encouragement
Chapter 1
Introduction
1.1 Excitation Control and Its Role on Power
Sys-tem stability
In the last few decades, considerable attention has been given to the excitation
sys-t e m and isys-ts role in improving power syssys-tem ssys-tabilisys-ty. Because of sys-the small effecsys-tive
t i m e constants in the excitation control loop, it was assumed t h a t a large control
effort could be expanded through excitation control with a relatively small input of
control energy. By the use of a voltage regulator in the excitation control system,
t h e output of t h e exciter can be adjusted so that the generated voltage and reactive
power change in a desired way. In early systems, the voltage regulator was entirely
manual. In modern control systems the voltage regulator is an automatic controller
t h a t senses t h e generator output voltage as a feedback signal then adjusts the
gen-erator excitation level in the desired direction. This kind of voltage regulator has
been known as an Automatic Voltage Regulator or A V R .
Early investigators realised that the so-called "steady-state" power Umits of
power networks could be increased by using the high-gain AVRs [Concordia, 1944].
A high-gain AVR was also recommended for reducing the steady state error of the
system output. Although modern voltage regulators and excitation systems with
Chapter 1. Introduction
transient stability (defined in Section 1.2) by increasing the synchronising torque
of the machine, their effects on the damping torque are rather small. It was also
recognised t h a t the voltage regulator gain requirement was different at no-load
con-ditions from that needed for good performance under load. For different stability
(transient or dynamic) control problems, the requirements on the excitation
con-trol system may be significantly different. In transient stability studies, a very fast
and high-ceiling voltage control action from the excitation control system is needed
to reduce the amplitude of the first oscillatory swing and to help the generator to
maintain its synchronism. Due to this reason, a fast excitation system with a
high-gain AVR is beneficial to the control of the system transient stability. However,
in the case where the system may operate with negative damping characteristics
the high-gain excitation control system aggravates the situation by increasing the
negative damping and hence instability may result in the system [DeMello, 1969],
[Heffron, 1952], [Anderson, 1977]. This can be analysed in dynamic stability studies
by using the small signal linearised system model given in Section A.3 of Appendix
A, with constant reference signals [Heffron, 1952], [DeMello, 1969]. For a system
without the AVR regulation, the damping torque component of the electrical torque
at frequency oo is given by
lAK^r',,^u:^'
ATdiu^) = ' ' ^ , ] f A8(u^) (1.1)
Since the parameters ii'2, i^s, and ii'4 are all positive, the damping torque given
by equation (1.1) is positive. However, for a system with the AVR in operation, the
damping torque component of the electrical torque can be expressed approximately
as follows:
where ATdi^^) has the same sign as K^. At low frequencies, the synchronising
component of the electrical torque is described approximately by
Chapter 1. Introduction
At some operating conditions such as for moderate to high system transfer
impedances, and heavy loadings, the parameter K5 can be negative [DeMello, 1969],
[El-Sherbiny. 1973]. In these cases the damping torque in equation (1.2) becomes
negative. Thus it can be assumed that the voltage regulator in the excitation system
introduces negative damping when Ks is negative.
In the 1950s engineers became aware of the instabilities introduced by the
(then) modern voltage regulators, and stabilising feedback circuits came into
com-mon use [Craxg, 1950].
In t h e 1960s large interconnected systems experienced growing oscillations t h a t
disrupted parallel operation of large systems [Ellis, 1966], [Schleif, 1966], [Byerlj-,
1967], [Schleif, 1967], [Hanson, 1968], [Dandeno, 1968], [Shier, 1968], [DeMello,
1969], [Schleif, 1969]. The first example of inter-system low-frequency oscillations
was observed during a WSCC (Western Systems Coordinating Council) in the
USA [Schleif, 1966]. The interconnected system operated satisfactorily for a while,
but low-frequency oscillations at about 6 cycles per minute developed. The
inter-connection was then tripped off, leaving the Northwest Power Pool oscillating about
3 cycles per minute and the Southwest Power Pool oscillating at about 11 cycles per
minute.
A number of minor oscillations of system frequency were also observed in the
South East j\.ustralian interconnected system [Bolden, 1982]. This system is
char-acterised by having two main generator centres of La Trobe Valley in Victoria, and
the Snowy Mountains Hydro-electric Scheme, each connected to Melbourne (load
centre) by links of length 120 and 360 km respectively.
W i t h more and more experience accumulated from interconnected electrical
power system operation, power system engineers are now convinced that the
low-frequency oscillations are due to the inherently weak natural damping of large and
weakly coupled systems. The situations of negative damping were further
aggra-vated by t h e regulator gain [Klopfenstein, 1971]. Engineers learned that the system
damping could be enhanced by artificial signals introduced through the excitation
Chapter 1. Introduction 4
problems ex])erienced in the power systems. As a result, the use of power system
stabiliser (PSS) to dampen the oscillations in the power system was introduced.
1.2 T h e Definition of Power System Stability
T h e definition of power system stability is as follows [Anderson, 1977]:
• P o w e r S y s t e m S t a b i l i t y . If the oscillatory response of a power system
dur-ing the transient period followdur-ing a disturbance is damped, and the system
settles in a finite time to a new steady operating condition at constant
fre-quency, the system is said to be stable. If the system is not stable according
to this definition, then it is considered unstable.
Power system stability is further classified into two categories: dynamic stability
due to small disturbances, and transient stability due to large disturbances. It
should be noted that this classification is not universally used. For example, in
some different classifications, the dynamic stability is called steady-state stability.
• D y n a m i c S t a b i l i t y . Dynamic stability refers to the stability of a, power
system subject to small and sudden perturbations.
Typical perturbations under this category may be small, randomly occurring
changes in load or small alterations in reference voltage settings. If the system
is dynamically stable, it is expected that after a temporary small disturbance the
system wiU i eturn to its initial state, while for a permanent small disturbaQce the
system will acquire a new operating point after a transient period [Anderson, 1977].
In both case.5 the synchronism of the system should not be lost. The size of small
disturbances may be measured by the criterion that the perturbed system can be
stabilised in an approximately linear region [Anderson, 1977].
• T r a n s i e n t S t a b i l i t y . Transient stability refers to the stabihty of power
Chapter 1. Introduction
causes a significant reduction in the machine terminal voltage and the ability
to transfer power.
T h e severe disturbances which cause transient stability problems may typically
be large changes in load, three-phase faults or transmission line switching. It is
usually assumed t h a t the system under study is stable before a large disturbance
happens. If the system is transiently stable, the system oscillations resulting from
large disturbances are damped. However, transient stability of the system depends
very much on the initial operating condition of the system and the nature (i.e.,
the type, magnitude, duration, and location, etc.) of the large disturbances that
are applied to the system [Anderson, 1977], as well as on the post-fault system
configuration.
For successful operation and control of power systems, the dynamic .'stability
and transient stability of the system must be carefully considered.
1.3 T h e Application of Power System Stabilisers
(PSSs)
T h e application of a power system stabiliser (PSS) is to generate a supplementary
stabilising signal, which is applied to the excitation control loop of a generating unit,
to introduce a positive damping torque. By using the supplementary stabilising
signal, the negative damping effect of the AVR regulation can be cancelled, at the
same time, the positive damping effect of the system can also be increased so t h a t
t h e system can operate even beyond the steady-state stability limit.
Stabilising signals are introduced in excitation systems at the summing
junc-tion where the reference voltage and the signal produced from the terminal voltage
are added to obtain the error signal fed to the regulator-exciter system. The
stabil-ising signal Vs is usually obtained from speed or a related signal such as the rotor
speed, bus frequency and electrical power [DeMello, 1969], [Keay, 1971], [IEEE,
Chapter 1. Introduction
phase relationship. Other input signals, such as the accelerating power [Bayne,
1977], [DeMello, 1978], [Lee, 1981] have also been used. During the last decade, the
deviation on equivalent rotor speed (Acugg) derived from the shaft speed and integral
of change in terminal electrical power has been used [Lee, 1981], [Kundur, 1989].
In the analysis and control of power system stability, two distinct types of
system oscillations are usually recognised [Kundur, 1989]. One type is associated
with units at a generating station swinging with respect to the rest of the power
system. Such oscillations are referred to as local plant m o d e o s c i l l a t i o n s . The
frequencies of these oscillations are typically in the range of 0.8 to 2.0 Hz. The
second t y p e of oscillation is associated with the swinging of many machines in one
part of the system against machines in other parts. These are referred to as
inter-a r e inter-a m o d e oscillinter-ations. The frequencies of the second type oscillinter-ations inter-are in the
range of 0.1 to 0.7 Hz. T h e basic function of the PSS is to add damping to both
types of system oscillations.
T h e ovcjrall excitation control system with PSS in operation is designed so as
to :
• maximise the damping of local mode as well as inter-area mode oscillations
without compromising the stability of other mode;
• enhance both the steady state stability or dynamic stability, and transient
stability of the power system;
• not adversely affect system performance during major system upsets which
cause large frequency excursions;
• minimise the consequences of excitation system malfunction due to component
Chapter 1. Introduction
1.4 Conventional Power System Stabilisers (CPSSs)
Power System Stabilisers designed using classical control theory can be called
con-ventional power system stabilisers (CPSSs). T h e CPSS which is a feedback element
from t h e shaft speed and is often given in the form [DeMello, 1969]:
_ KpTpS ( l + r i s ) ( l + T3s)
^'^'^ - r T ^ f ( l + r.s)(l + r,s)J ^'-^^
T h e first term in equation (1.4) is a reset term that is used to "wash out" the
compensation effect after a time lag TQ, with typical values of 4 seconds [DeMello,
1969] to 20 seconds or 30 seconds [Schleif, 1969]. The use of reset control will assure
no permanent offset in the terminal voltage due to a prolonged error in frequenc)^,
such as might occur in an overload or islanding condition. The second term in Gsis)
is a lead compensation pair that can be used to improve the phase lag through the
system from Vref to Auj at the power system frequency of oscillation.
T h e settings of the time constants of the phase compensating lead-lag functions
of t h e stabiliser can be determined by several techniques ([Schleif, 1968], [DeMello,
1969], [Schleif, 1969], [Warchol, 1971], [Gerheart, 1971], [Hayes, 1973], [Bollinger,
1975]) once the frequency response of the excitation control system has been known
[Yu, 1971], [Vaahedi, 1986], [Arnautovic, 1987], [Chow, 1989], [Bollinger, 1975].
T h e design of the most widely used CPSS is based on linearised fixed-parameter
models of the non-linear power system which are derived from the linearisation of
t h e system at a given operating point. The parameters of the CPSSs are fixed at
certain values which are determined under this particular operating point. Since the
operating point of a power system drifts as a result of continuous load changes or
unpredictable major disturbances such as a three-phase fault, the fixed parameter
CPSSs can not adapt the stabiliser parameters in real time based on on-line
mea-surements, i.e., they can not track the variations in the system operating conditions
over a wide range of operating conditions. Therefore, they can not provide the best