Thermal modifications of charmonia and bottomonia from
spa-tial correlation functions
Heng-TongDing1,OlafKaczmarek1,2,Anna-lenaKruse2,SwagatoMukherjee3,HiroshiOhno3,4,
HaukeSandmeyer2, andHai-TaoShu1,
1Central China Normal University, Wuhan 430079, China
2Fakultät für Physik, Universität Bielefeld, 33615 Bielefeld, Germany
3Physics Department, Brookhaven National Laboratory, Upton, NY 11973, USA
4Center for Computational Sciences, University of Tsukuba, Tsukuba, Ibaraki 305-8577, Japan
Abstract.We present our study on the thermal modifications of charmonia and bottomo-nia from spatial correlation functions at zero and nonzero momenta in quenched QCD. To accommodate the heavy quarks on the lattice we performed simulations on very fine lat-tices at a fixed beta value corresponding to a lattice spacinga−1=22.8 GeV on 1923×32, 1923×48, 1923×56, 1923×64 and 1923×96 lattices using clover-improved Wilson fermions. These lattices correspond to temperatures of 2.25Tc, 1.50Tc, 1.25Tc, 1.10Tc and 0.75Tc. To increase the signal to noise ratio in the axial-vector and scalar channels we used multi-sources for the measurement of spatial correlation functions. By investigating on the differences between spatial and temporal correlators as well as the temperature de-pendence of screening masses we will discuss the thermal effects in different channels of quarkonium states. Besides this the dispersion relation of the screening mass at different momenta is also discussed.
1 Introduction
In heavy-ion physics much effort is put into investigating the properties of quark-gluon plasma (QGP)
formed after the collision. Heavy quarkonium states, which serve as a good QGP thermometer [1], are powerful probes to study the properties of the hot medium. In recent years enormous progress has been made experimentally in exploring the fate of heavy quarkonia embedded in the thermal medium. For instance, the Pb-Pb collisions carried out at CMS with √sNN = 2.76 TeV show a significant
sequential suppression for bottomonium compared with that in the p-p collision [2]. This phenomenon is believed to signal the presence of QGP. To have a better understanding of such a phenomenon, a detailed theoretical study on the behavior of the quarkonium states and their dissociation temperatures is needed. Currently there are two different strategies dealing with this problem [3]. One strategy is
to study the spectral functions (SPFs) either extracted from correlation functions calculated on the lattice or obtained by solving a non-relativistic Schr¨odinger equation withqq¯potential in lattice QCD simulations. However, studies using internal energy [4] and free energy [5] as the potential give different dissociation temperatures for quarkonia. Other studies suggest that the potential could be
complex [6–8], but the real part and imaginary part are still not well determined (see [9]). SPFs can be extracted from the temporal correlation functions in Euclidean space-time calculated on the lattice by inversion methods [10–14]. But due to the fact that the extraction is ill-posed one needs extra prior information about the SPF, which can introduce some uncertainties.
The other strategy is to study the temperature dependence of the screening mass. Quarkonia living in the hot medium are subject to the color screening effect and their thermal modifications
can be reflected by the so-called screening mass. By examining the screening masses at different
temperatures, the study of thermal effects on the quarkonia is available. One should note another
important fact that the quarkonia produced in heavy-ion collisions are not at rest with respect to the medium usually. For exampleJ/ψdoes not flow with the medium untilp⊥ ∼8 GeV/c [15]. Thus, it is
necessary to carry out the study on the momentum dependence as well. Studies on this using effective
theories or AdS/CFT can be found in [16,17]. There are also lattice studies on non-zero momentum
effects, see [18–21]. In this paper, the results based on lattice QCD calculations on large quenched
lattices are presented.
2 Euclidean Spatial Correlator and Screening Mass
Integrating the current-current correlation functions overx,yandτdirections gives the spatial corre-lation functionGH(z,p⊥, ωn) which can be calculated directly on the lattice
GH(z,p⊥, ωn)=
x,y,τ
exp(−i˜p·˜x)JH(0,0)JH†(τ,x), (1)
wherep⊥=(px,py),ωn=2nπTand˜p=(p⊥, ωn). Here the current is defined as
JH(τ,x)=ψ¯(τ,x)ΓHψ(τ,x), (2)
whereΓH =γ5, γµ, , γ5γµcorresponds to pseudo-scalar (P), vector (V), scalar (S) and axial-vector
(A) channel, respectively. As the temporal dimension in lattice QCD is bound to 1/T, it is reasonable to look at the spatial direction. The relation between the spatial correlation function and the spectral function is
GH(z,p⊥, ωn)=
∞
−∞
dpz
2π exp(ipzz)
∞
0 dω
π ρH(ω,p,T) ω ω2+ω2n
, (3)
wherep = (px,py,pz). The spectral function appeared here is the same as the one which can be
extracted from the temporal correlation function, but its extraction from the spatial correlation function is almost impossible because of the complexity. However, with little effort one could find that at large
distancez → ∞, the spatial correlation shows an exponential decay behavior characterized by an energyEscr
GH(z,p⊥, ωn)∼exp(−zEscr), (4)
whereEscris given by
E2
scr=A(T)˜p2+M2scr(T) (5)
which is inspired from the finite-temperature field theory calculation result
E2
complex [6–8], but the real part and imaginary part are still not well determined (see [9]). SPFs can be extracted from the temporal correlation functions in Euclidean space-time calculated on the lattice by inversion methods [10–14]. But due to the fact that the extraction is ill-posed one needs extra prior information about the SPF, which can introduce some uncertainties.
The other strategy is to study the temperature dependence of the screening mass. Quarkonia living in the hot medium are subject to the color screening effect and their thermal modifications
can be reflected by the so-called screening mass. By examining the screening masses at different
temperatures, the study of thermal effects on the quarkonia is available. One should note another
important fact that the quarkonia produced in heavy-ion collisions are not at rest with respect to the medium usually. For exampleJ/ψdoes not flow with the medium untilp⊥∼8 GeV/c [15]. Thus, it is
necessary to carry out the study on the momentum dependence as well. Studies on this using effective
theories or AdS/CFT can be found in [16,17]. There are also lattice studies on non-zero momentum
effects, see [18–21]. In this paper, the results based on lattice QCD calculations on large quenched
lattices are presented.
2 Euclidean Spatial Correlator and Screening Mass
Integrating the current-current correlation functions overx,yandτdirections gives the spatial corre-lation functionGH(z,p⊥, ωn) which can be calculated directly on the lattice
GH(z,p⊥, ωn)=
x,y,τ
exp(−i˜p·˜x)JH(0,0)JH†(τ,x), (1)
wherep⊥ =(px,py),ωn=2nπTand˜p=(p⊥, ωn). Here the current is defined as
JH(τ,x)=ψ¯(τ,x)ΓHψ(τ,x), (2)
whereΓH =γ5, γµ, , γ5γµcorresponds to pseudo-scalar (P), vector (V), scalar (S) and axial-vector
(A) channel, respectively. As the temporal dimension in lattice QCD is bound to 1/T, it is reasonable to look at the spatial direction. The relation between the spatial correlation function and the spectral function is
GH(z,p⊥, ωn)=
∞
−∞
dpz
2π exp(ipzz)
∞
0 dω
π ρH(ω,p,T) ω ω2+ω2n
, (3)
wherep = (px,py,pz). The spectral function appeared here is the same as the one which can be
extracted from the temporal correlation function, but its extraction from the spatial correlation function is almost impossible because of the complexity. However, with little effort one could find that at large
distancez → ∞, the spatial correlation shows an exponential decay behavior characterized by an energyEscr
GH(z,p⊥, ωn)∼exp(−zEscr), (4)
whereEscris given by
E2
scr=A(T)˜p2+M2scr(T) (5)
which is inspired from the finite-temperature field theory calculation result
E2
scr=˜p2+M2scr(T)+ Π(˜p,T) (6)
by absorbing the self-energy termΠ(˜p,T) into aT-dependent coefficientA(T). At vanishing
momen-tum limit ˜p = 0, Escris nothing but the screening mass Mscr(T) and at zero temperatureT = 0, it
is the same as the pole mass. In the limit ofT → ∞, the heavy quarkonia are dissolved and can be considered as a pair of free quark and its anti-quark. Then, the screening masses in this limit can be calculated in the non-interacting limit [22]
Mscrf ree=2
(πT)2+m2
q. (7)
The exponential decay behavior mentioned above becomes cosh-dependence onzif a periodic boundary condition is adopted. In lattice QCD,Escrcan be obtained by fitting to the spatial correlation
according to Eq. (4). The details of this procedure will be discussed in Sec.4.2. After determining
Escrin different channels at different temperatures and momenta, the in-medium dispersion relation
can be studied.
3 Lattice Setup
To calculate the spatial correlation functions of charmonia and bottomonia, we performed simulations on isotropic large quenched lattices with quite small lattice spacing a−1 = 22.8 GeV. The lattice spacinga is determined by using Sommer parameter r0 [23]. The spatial extent Nσ is set to 192,
which is large enough to make the fit of screening mass reliable. Temporal extent is widely ranged corresponding to temperatures from 0.75Tcto 2.25Tc. We used non-perturbatively Clover-improved
Wilson fermions [24] and quark masses are tuned to reproduce nearly physicalJ/ψmass andΥmass
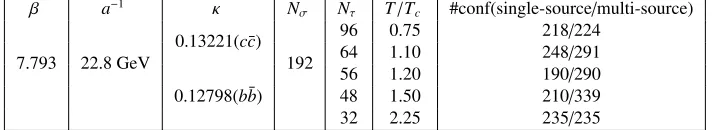
(see Fig. 5). To study the momentum dependence of the dispersion relation, the momentum is set in a range from 0∼3.17 GeV. To increase the signal-to-noise ratio at zero momentum, we increase the statistics by using multiple sources (with mostly 5 source points for each gauge configuration), which reduces the relative errorδG/G¯ by approximately a factor of 2 compared with single source. At non-zero momenta, we use a single source andδG/G¯ ∼ 1.5% at the middle point in the vector channel. The details of our simulations are summarized in Table.1.
β a−1 κ N
σ Nτ T/Tc #conf(single-source/multi-source)
7.793 22.8 GeV
0.13221(cc¯) 192
96 0.75 218/224
64 1.10 248/291
56 1.20 190/290
0.12798(bb¯) 48 1.50 210/339
32 2.25 235/235
Table 1: Lattice spacing, quark mass, spatial extent, temperatures and statistics of configurations performed in this lattice simulations.
4 Results
4.1 Ratios of Correlators
ground state. Any temperature dependent change of the quarkonium state will be reflected on the variation of the correlation functions. Given two different temperatures, we can check whether the
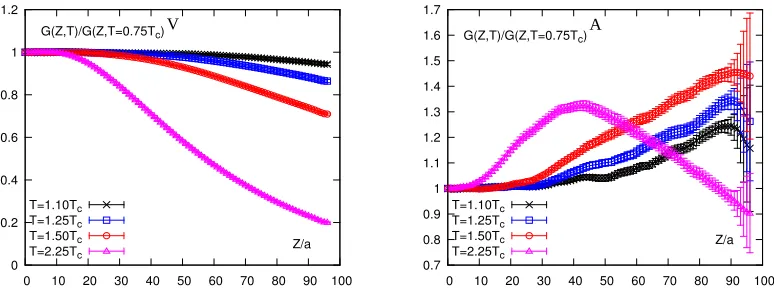
ratio of the correlators at these two temperatures is decreasing or increasing inz-direction. By making use of Eq. (4), one is able to know at which temperature the screening mass is larger. Since the screen-ing mass characterizes the long distance behavior we only focus on the large distance. As a simple example we compare the vector and axial-vector correlation functions forbb¯at zero momentum. For a better illustration we only show the ratio of correlators at temperatureT >Tcto that atT =0.75Tc.
0 0.2 0.4 0.6 0.8 1 1.2
0 10 20 30 40 50 60 70 80 90 100 G(Z,T)/G(Z,T=0.75Tc)
Z/a
V
T=1.10Tc
T=1.25Tc
T=1.50Tc
T=2.25Tc
0.7 0.8 0.9 1 1.1 1.2 1.3 1.4 1.5 1.6 1.7
0 10 20 30 40 50 60 70 80 90 100 G(Z,T)/G(Z,T=0.75Tc)
Z/a
A
T=1.10Tc
T=1.25Tc
T=1.50Tc
T=2.25Tc
Figure 1: The ratios of bottomonia correlation functions at different temperatures aboveTcto that at
temperatureT =0.75Tcin the vector channel (Left) and axial-vector channel (Right).
First let us look at the vector channel shown in the left panel of Fig.1. We can see that the ratios are smaller than unity at all temperatures and decrease faster at higher temperature as a function of
z. From the discussion above we easily know that the screening mass becomes larger as temperature increases. As for the axial-vector channel shown in the right panel, we find that the screening mass decreases at temperatures 1.10Tc, 1.25Tcand 1.50Tc. While at 2.25Tc the ratio has a non-monotonic
behavior as a function of z which may indicate the largest thermal modification to the bound states. Though not shown here, in our analysis we have found that the vector and axial-vector channel of
cc¯behave similar tobb¯in the vector channel but the deviation of the ratios from unity is much larger. This indicates that charmonia suffer from more thermal modification than bottomonia in the medium.
4.2 Fitting the Correlators
In this section we consider how to extract the energyEscr from the spatial correlation function. To
separate the contribution from different states we adopt a two-state fit ansatz
G(nσ)=A1cosh[Escr2−state1 (nσ−Nσ/2)]+A2cosh[Escr2−2state(nσ−Nσ/2)]. (8)
HereEscr denotes the energy to be extracted in lattice unit andnσ =Z/a. With this ansatzEscr can
be obtained by performing a correlatedχ2-fitting in the range [nmin,nmax]. nmaxis determined by an
empirical formula which gives optimal fit results.nminis varied successively from a small number to nmax−4 (we have 4 fit parameters) to generate different fit windows. By checking theχ2/d.o.f in
ground state. Any temperature dependent change of the quarkonium state will be reflected on the variation of the correlation functions. Given two different temperatures, we can check whether the
ratio of the correlators at these two temperatures is decreasing or increasing inz-direction. By making use of Eq. (4), one is able to know at which temperature the screening mass is larger. Since the screen-ing mass characterizes the long distance behavior we only focus on the large distance. As a simple example we compare the vector and axial-vector correlation functions forbb¯at zero momentum. For a better illustration we only show the ratio of correlators at temperatureT >Tcto that atT =0.75Tc.
0 0.2 0.4 0.6 0.8 1 1.2
0 10 20 30 40 50 60 70 80 90 100 G(Z,T)/G(Z,T=0.75Tc)
Z/a V T=1.10Tc T=1.25Tc T=1.50Tc T=2.25Tc 0.7 0.8 0.9 1 1.1 1.2 1.3 1.4 1.5 1.6 1.7
0 10 20 30 40 50 60 70 80 90 100 G(Z,T)/G(Z,T=0.75Tc)
Z/a A T=1.10Tc T=1.25Tc T=1.50Tc T=2.25Tc
Figure 1: The ratios of bottomonia correlation functions at different temperatures aboveTcto that at
temperatureT =0.75Tcin the vector channel (Left) and axial-vector channel (Right).
First let us look at the vector channel shown in the left panel of Fig.1. We can see that the ratios are smaller than unity at all temperatures and decrease faster at higher temperature as a function of
z. From the discussion above we easily know that the screening mass becomes larger as temperature increases. As for the axial-vector channel shown in the right panel, we find that the screening mass decreases at temperatures 1.10Tc, 1.25Tcand 1.50Tc. While at 2.25Tc the ratio has a non-monotonic
behavior as a function of z which may indicate the largest thermal modification to the bound states. Though not shown here, in our analysis we have found that the vector and axial-vector channel of
cc¯behave similar tobb¯in the vector channel but the deviation of the ratios from unity is much larger. This indicates that charmonia suffer from more thermal modification than bottomonia in the medium.
4.2 Fitting the Correlators
In this section we consider how to extract the energyEscr from the spatial correlation function. To
separate the contribution from different states we adopt a two-state fit ansatz
G(nσ)=A1cosh[Escr2−state1 (nσ−Nσ/2)]+A2cosh[E2scr−state2 (nσ−Nσ/2)]. (8)
HereEscrdenotes the energy to be extracted in lattice unit andnσ =Z/a. With this ansatzEscrcan
be obtained by performing a correlatedχ2-fitting in the range [nmin,nmax]. nmaxis determined by an
empirical formula which gives optimal fit results.nminis varied successively from a small number to nmax−4 (we have 4 fit parameters) to generate different fit windows. By checking theχ2/d.o.f in
different windows, the best fit interval can be found whenχ2/d.o.f ∼1 and a clear plateau inE2−state scr2 can be seen in such an interval with a proper initial guess for fit parameters. Then the final results are obtained by averaging the data points in this interval.
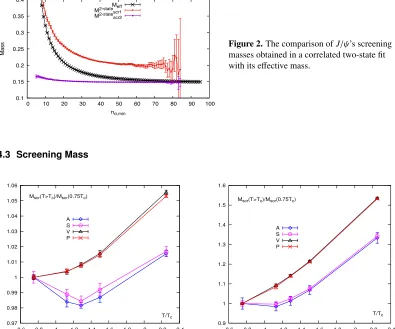
As an example, we applied the correlated two-state fit into theJ/ψspatial correlation functions at
Nτ=96 with zero momentum, where the energyEscrbecomes the screening massMscr. Fig.2shows
the screening masses and also the effective mass Me f f (equal toEe f f at zero momentum) which is
obtained by solving the following equation
G(nσ) G(nσ+1)
= cosh[Ee f f(nσ−Nσ/2)]
cosh[Ee f f(nσ−Nσ/2+1)]
. (9)
We see that a clear plateau appears inM2−state
scr2 and is close toMe f f at the largest distance.
��� ���� ��� ���� ��� ���� ��� � �� �� �� �� �� �� �� �� �� ��� ���� ������ ���� ������������ ������������
Figure 2.The comparison ofJ/ψ’s screening masses obtained in a correlated two-state fit with its effective mass.
4.3 Screening Mass
0.97 0.98 0.99 1 1.01 1.02 1.03 1.04 1.05 1.06
0.6 0.8 1 1.2 1.4 1.6 1.8 2 2.2 2.4 T/Tc Mscr(T>Tc)/Mscr(0.75Tc)
A S V P 0.9 1 1.1 1.2 1.3 1.4 1.5 1.6
0.6 0.8 1 1.2 1.4 1.6 1.8 2 2.2 2.4 T/Tc Mscr(T>Tc)/Mscr(0.75Tc)
A S V P
Figure 3: Ratios of screening masses at different temperatures to that at temperatureT =0.75Tcin
different channels. The label “A”, “S”, “P”, “V” denote axial-vector, scalar, pseudo-scalar, vector
channel, respectively.Left:Results of bottomonia.Right:Results of charmonia.
In this section we discuss the temperature dependence of the screening mass. Instead of showing the screening mass itself, we show the ratios of screening masses at different temperatures to that at
temperatureT =0.75Tc, which gives better demonstration of how the screening mass changes with
The left panel of Fig. 3 shows the results for bottomonia. We can see that the ratios in theS
andPchannels are similar to those in theAandV channels, respectively. The screening masses of S-wave states increase monotonically by∼5.6% at 2.25Tcwhile for P-wave states they drop first and
then go up. The right panel shows that a similar behavior is observed for charmonia as bottomonia. But the screening masses of S-wave states increase by∼54% at 2.25Tc, much larger than that in the
case of bottomonia. Similarly, for the P-wave states, the screening masses of charmonia also increase more than bottomonia at 2.25Tc. We conclude that charmonia suffer from more thermal effects than
bottomonia in the medium. The discussions above verified our statements given in Sec.4.1from our analysis of the correlation functions.
0.9 1 1.1 1.2 1.3 1.4 1.5 1.6 1.7 1.8
100 200 300 400 500 600 700 800 T[MeV] Mscr(T)/Mscr(Tmin)
dynamical: A S V P quenched: A S V P
0.9 1 1.1 1.2 1.3 1.4 1.5 1.6 1.7 1.8
1 1.5 2 2.5 3 3.5 4 4.5 5 T/Tc Mscr(T)/Mscr(Tmin)
dynamical: A S V P
quenched: A S V P
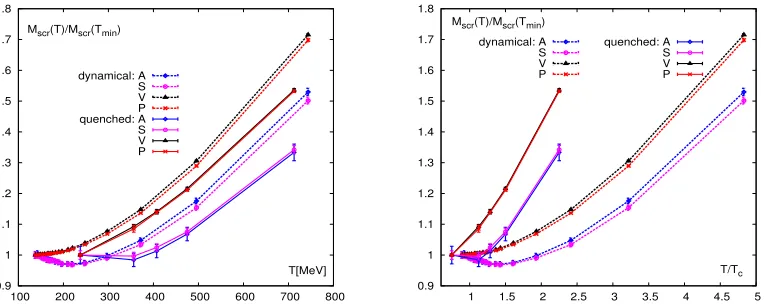
Figure 4: Comparison of the screening mass of charmonia from this study with that from 2+1 flavor
HISQ simulations [25]. The data points connected with solid lines are the results from our quenched simulations while the dashed lines are for the HISQ simulations. The left panel and right panel are the same except that the X-axis in the left panel is temperatureT while in the right panel it isT/Tc. Tcis 313.7 MeV [26] for quenched and 154 MeV [27] for 2+1 flavor QCD.Tminin the Y-axis means
the lowest temperature in the simulations.
We also compare the results of our quenched calculations with those obtained fromNf =2+1
lattice QCD calculations using the HISQ action [25]. As shown in Fig. 4, the screening masses of charmonia for both quenched and theNf =2+1 cases show the similarT-dependence: (I) for the
S-wave states, they increase monotonically in temperature; (II) for the P-wave states, they decrease first and then go up as temperature increases. The difference is that in our quenched calculations, the
screening masses for P-wave states have a dip at 1.10Tcfor P-waves while in dynamic QCD the dip
is at 1.43Tc.
4.4 Dispersion Relation
We also check the dispersion relation in the P and V channels for both charmonia and bottomonia. To do so we calculate the correlation functions at momentum (px,py) ranged in [(0,0),(1,0), . . . ,(3,3)]×
2π/(aNσ) and simultaneouslyωn =0, corresponding to|p⊥| ∈[0,3.17] GeV. From the top two panels
The left panel of Fig. 3 shows the results for bottomonia. We can see that the ratios in the S
andPchannels are similar to those in theAandV channels, respectively. The screening masses of S-wave states increase monotonically by∼5.6% at 2.25Tcwhile for P-wave states they drop first and
then go up. The right panel shows that a similar behavior is observed for charmonia as bottomonia. But the screening masses of S-wave states increase by∼54% at 2.25Tc, much larger than that in the
case of bottomonia. Similarly, for the P-wave states, the screening masses of charmonia also increase more than bottomonia at 2.25Tc. We conclude that charmonia suffer from more thermal effects than
bottomonia in the medium. The discussions above verified our statements given in Sec.4.1from our analysis of the correlation functions.
0.9 1 1.1 1.2 1.3 1.4 1.5 1.6 1.7 1.8
100 200 300 400 500 600 700 800 T[MeV] Mscr(T)/Mscr(Tmin)
dynamical: A S V P quenched: A S V P 0.9 1 1.1 1.2 1.3 1.4 1.5 1.6 1.7 1.8
1 1.5 2 2.5 3 3.5 4 4.5 5 T/Tc Mscr(T)/Mscr(Tmin)
dynamical: A S V P quenched: A S V P
Figure 4: Comparison of the screening mass of charmonia from this study with that from 2+1 flavor
HISQ simulations [25]. The data points connected with solid lines are the results from our quenched simulations while the dashed lines are for the HISQ simulations. The left panel and right panel are the same except that the X-axis in the left panel is temperatureT while in the right panel it isT/Tc. Tcis 313.7 MeV [26] for quenched and 154 MeV [27] for 2+1 flavor QCD.Tminin the Y-axis means
the lowest temperature in the simulations.
We also compare the results of our quenched calculations with those obtained fromNf =2+1
lattice QCD calculations using the HISQ action [25]. As shown in Fig. 4, the screening masses of charmonia for both quenched and theNf = 2+1 cases show the similarT-dependence: (I) for the
S-wave states, they increase monotonically in temperature; (II) for the P-wave states, they decrease first and then go up as temperature increases. The difference is that in our quenched calculations, the
screening masses for P-wave states have a dip at 1.10Tcfor P-waves while in dynamic QCD the dip
is at 1.43Tc.
4.4 Dispersion Relation
We also check the dispersion relation in the P and V channels for both charmonia and bottomonia. To do so we calculate the correlation functions at momentum (px,py) ranged in [(0,0),(1,0), . . . ,(3,3)]×
2π/(aNσ) and simultaneouslyωn=0, corresponding to|p⊥| ∈[0,3.17] GeV. From the top two panels
of Fig. 5we find that for bottomonia the dispersion relation remains linear andA(T) ∼ 1 (see Eq. (5)). A similar result using non-relativistic quarks can be found in [18]. As for charmonia shown on the bottom panel of Fig.5, a similar situation has been observed as in the case of bottomonia, where
105 110 115 120 125 130 135
0 2 4 6 8 10 12
|p→ |2 [GeV2] E2(p→ )[GeV2]
P T=2.25Tc T=1.50Tc T=1.25Tc T=1.10Tc T=0.75Tc 105 110 115 120 125 130 135
0 2 4 6 8 10 12
|p→ |2 [GeV2] E2(p→ )[GeV2]
V T=2.25Tc T=1.50Tc T=1.25Tc T=1.10Tc T=0.75Tc 10 15 20 25 30 35
0 1 2 3 4 5 6
|p→ |2 [GeV2] E2(p→ )[GeV2]
P T=2.25Tc T=1.50Tc T=1.25Tc T=1.10Tc T=0.75Tc 10 15 20 25 30 35
0 1 2 3 4 5 6
|p→ |2 [GeV2] E2(p→ )[GeV2]
V T=2.25Tc T=1.50Tc T=1.25Tc T=1.10Tc T=0.75Tc
Figure 5: Dispersion relation for botomonia (Top) and charmonia (Bottom) at different temperatures
in the pseudo-scalar channel (Left) and the vector channel (Right).
the dispersion relation remains unmodified, which is consistent with [19,21]. The reason could be that the largest momentum 3.17 GeV is still of the order of charmonium masses and less than those of bottomonia.
5 Summary
We have performed simulations on large quenched isotropic lattices to calculate the spatial Euclidean correlation functions. Applying correlatedχ2-fitting we are able to extract reliable screening masses from these correlation functions. By checking the screening masses at different temperatures and
zero momenta, we find that the screening masses of S-wave states for both bottomonia and charmo-nia increase monotonically in temperature. For bottomocharmo-nia,Esrc(2.25Tc)/Esrc(0.75Tc)−1 is 5.6%
while for charmonia 54%. The screening masses of P-wave states for both bottomonia and charmonia increase non-monotonically in temperature. Our quenched calculations and 2+1 flavor HISQ
calcu-lations show the similar change tendency of the screening masses. In both our quenched simucalcu-lations and 2+1 HISQ simulations,Esrcof P-wave states have a dip but they appear at different temperatures.
not modified in the medium. The reason could be that the momentum of the quarkonium state is less than its mass at rest.
6 Acknowledgement
HTS is grateful to members of HotQCD collaboration for many useful suggestions. This work is supported by the National Natural Science Foundation of China under grant numbers 11535012 and 11521064, the Deutsche Forschungsgemeinschaft (DFG) through the grant CRC-TR 211 ”Strong-interaction matter under extreme conditions” and the U.S. Department of Energy, Office of Science,
Office of Nuclear Physics, through Contract No. DE-SC001270. The computations in this work were
performed on the Aachen, Bielefeld, Juelich and Paderborn machines.
References
[1] T. Matsui, H. Satz, Phys. Lett.B178, 416 (1986)
[2] S. Chatrchyan et al. (CMS), Phys. Rev. Lett.109, 222301 (2012),1208.2826
[3] H.T. Ding, F. Karsch, S. Mukherjee, Int. J. Mod. Phys.E24, 1530007 (2015),1504.05274 [4] H. Satz, Journal of Physics G: Nuclear and Particle Physics32, R25 (2006)
[5] A. Mocsy, P. Petreczky, Phys. Rev.D77, 014501 (2008),0705.2559
[6] M. Laine, O. Philipsen, P. Romatschke, M. Tassler, JHEP03, 054 (2007),hep-ph/0611300 [7] N. Brambilla, J. Ghiglieri, A. Vairo, P. Petreczky, Phys. Rev.D78, 014017 (2008),0804.0993 [8] A. Beraudo, J.P. Blaizot, C. Ratti, Nucl. Phys.A806, 312 (2008),0712.4394
[9] Y. Burnier, O. Kaczmarek, A. Rothkopf, Phys. Rev. Lett.114, 082001 (2015),1410.2546 [10] M. Asakawa, T. Hatsuda, Y. Nakahara, Prog. Part. Nucl. Phys. 46, 459 (2001),
hep-lat/0011040
[11] Y. Burnier, A. Rothkopf, Phys. Rev. Lett.111, 182003 (2013),1307.6106
[12] B.B. Brandt, A. Francis, B. Jager, H.B. Meyer, Phys. Rev.D93, 054510 (2016),1512.07249 [13] H. Ohno, PoSLATTICE2015, 175 (2016)
[14] H.T. Shu, H.T. Ding, O. Kaczmarek, S. Mukherjee, H. Ohno, PoSLATTICE2015, 180 (2016), 1510.02901
[15] Z. Tang (STAR), J. Phys.G38, 124107 (2011),1107.0532
[16] M.A. Escobedo, J. Soto, M. Mannarelli, Phys. Rev.D84, 016008 (2011),1105.1249
[17] H. Liu, K. Rajagopal, U.A. Wiedemann, Phys. Rev. Lett.98, 182301 (2007),hep-ph/0607062 [18] G. Aarts, C. Allton, S. Kim, M.P. Lombardo, M.B. Oktay, S.M. Ryan, D.K. Sinclair, J.I.
Skullerud, JHEP03, 084 (2013),1210.2903
[19] A. Ikeda, M. Asakawa, M. Kitazawa, Phys. Rev.D95, 014504 (2017),1610.07787 [20] M.B. Oktay, J.I. Skullerud (2010),1005.1209
[21] H.T. Ding, Nucl. Phys.A904-905, 619c (2013),1210.5442 [22] W. Florkowski, B.L. Friman, Z. Phys.A347, 271 (1994) [23] R. Sommer, Nucl. Phys.B411, 839 (1994),hep-lat/9310022 [24] B. Sheikholeslami, R. Wohlert, Nucl. Phys.B259, 572 (1985)
[25] A. Bazavov, F. Karsch, Y. Maezawa, S. Mukherjee, P. Petreczky, Phys. Rev.D91, 054503 (2015), 1411.3018
[26] A. Francis, O. Kaczmarek, M. Laine, T. Neuhaus, H. Ohno, Phys. Rev.D91, 096002 (2015), 1503.05652
![Figure 4: Comparison of the screening mass of charmonia from this study with that from 2+1 flavorHISQ simulations [25]](https://thumb-us.123doks.com/thumbv2/123dok_us/8054859.1342257/7.482.45.440.81.382/figure-comparison-screening-mass-charmonia-study-avorhisq-simulations.webp)
