Available Online atwww.ijcsmc.com
International Journal of Computer Science and Mobile Computing
A Monthly Journal of Computer Science and Information Technology
ISSN 2320–088X
IJCSMC, Vol. 4, Issue. 10, October 2015, pg.364 – 376
RESEARCH ARTICLE
Modify k-medoids Algorithm with
New Efficiency Method for
Biometric Database Classification
Shaker K. Ali
1, Zainab Naser Azeez
2¹Department of Computer Science& University of Thi-Qar, Iraq ²Department of Computer Science & University of Thi-Qar, Iraq
1 [email protected]; 2[email protected]
Abstract— K-medoids algorithm modified by changing the condition factor. Largest cluster elements number is used instead of the cluster number. The modified algorithm is applied to images data base of the human face with different environment (direction, angles... etc.). These data were collected from different resource (ORL site and real images collected from random sample from Thi_Qar city population of lraq). Our algorithm has been implemented on three types of distance to calculate the minimum distance between points (Euclidean, Correlation and Minkowski distance) .The efficiency ratio of modified algorithm has varied according to the data, the efficiency of our (90%) which is higher than the other clustering algorithms.Matlab (2014) was used in programming of all programs used.
Keywords— Biometric, Clustering, K-medoids, distance_Euclidean, distance_correlation, distance_Minkowski
I. INTRODUCTION
Cluster analysis is based on partitioning a collection of data points into a number of clusters, where the points inside a cluster show a certain degree of closeness or similarity. It has been the subject of wide research arising in many application domains in engineering, business, medical, and social sciences. Clustering methods can be considered as either hard (crisp)\or fuzzy depending on whether a pattern belongs exclusively to a single cluster or to several clusters with different degrees. In hard clustering each point of the dataset belongs to exactly one cluster, a membership value of zero or one is assigned to each pattern, whereas in fuzzy clustering, a value between zero and one is assigned to each pattern by a membership function [1].
Fig1. Steps of clustering process
The clustering process may result in different partitioning of a data set, depending on the specific criterion used for clustering. Thus, there is a need of pre-processing before we assume a clustering task in a data set. The basic steps to develop clustering process are presented in figure (1) and can be summarized as follows [3]:
1. Feature selection:The goal is to select properly the features on which clustering is to be performed
so as to encode as much information as possible concerning the task of our interest. Thus, preprocessing of data may be necessary prior to their utilization in clustering task.
2. Clustering algorithm: This step refers to the choice of an algorithm that results in the definition of a
good clustering scheme for a data set. A proximity measure and a clustering criterion mainly characterize a clustering algorithm as well as its efficiency to define a clustering scheme that fits the data set.
Proximity measure is a measure that quantifies how ―similar‖ two data points (i.e. feature
vectors) are. In most of the cases we have to ensure that all selected features contribute equally to the computation of the proximity measure and there are no features that dominate others.
Clustering criterion. In this step, we have to define the clustering criterion, which can be
expressed via a cost function or some other type of rules. We should stress that we have to take into account the type of clusters that are expected to occur in the data set. Thus, we may define a ―good‖ clustering criterion, leading to a partitioning that fits well the data set.
3. Validation of the results: The correctness of clustering algorithm results is verified using appropriate
criteria and techniques. Since clustering algorithms define clusters that are not known a priori, irrespective of the clustering methods, the final partition of data requires some kind of evaluation in most applications.
4. Interpretation of the results:In many cases, the experts in the application area have to integrate the
clustering results with other experimental evidence and analysis in order to draw the right conclusion.
II. BIOMETRICS TECHNIQUES
Biometrics refers to the use of physiological or biological characteristics to measure the identity of an individual. These features are unique to each individual and remain unaltered during a person’s lifetime. These features make biometrics a promising solution to find security. Automated biometrics recognition systems can be classified into two main categories: identification and verification. In the first category, identification systems try to identify a person which belongs to a group that previously has been enrolled. On the second category, verification systems match a biometric sample with a single template, which belongs to a previously declared user. Both categories of systems have two main stepq: enrolment and verification; during enrolment the biometric of the subject is stored in a database, and during verification the biometric information of the subject is detected and compared [4].
The qualities of a good biometric are:
1. Uniqueness: The trait should be as unique as possible, so as to say that the same feature does not
appear in any two different individuals.
2. Universality: The biometric trait should be present in as many different individuals as possible.
3. Permanence: The trait should have little or no change with age.
4. Measurability: The trait should be measurable by relatively simple methods.
5. Collectability: The users of the biometric system should find it easy to present the biometric for measurement.
III.FACERECOGNITION
The face is an obvious choice for a biometric as it is the physiological characteristic used every day by humans in order to identify others. Face recognition is considered less invasive than other biometrics and generally has a higher level of user acceptance. However it is also more challenging technologically and face recognition has lower accuracy rates than other biometric modalities such as iris or fingerprint recognition. Having been chosen by the ICAO as the primary biometric identifier for travel documents, face recognition is guaranteed a wide level of implementation in the future [6]
IV.SIMILARITY MEASURES
As previously mentioned, clustering is the process of recognizing natural groupings or clusters in multidimensional data based on some similarity measures. Hence, defining an appropriate similarity measure plays a fundamental role in clustering. The most popular way to evaluate similarity between two patterns amounts to the use of a distance measure [7].
The most widely used distance measure is the Euclidean distance, which between any two d-dimensional
patterns and is given by
= (1)
The Euclidean distance measure is a special case (when a =2) of the Minkowski metric [8] which is defined as
= = (2)
The Minkowski metric is usually not efficient for clustering data of high dimensionality, as the distance between the patterns increases with the growth of dimensionality. Hence, the concepts of near and far become weaker. Furthermore [3], for the Minkowski metric, the large scale features tend to dominate over the other features. This can be solved by normalizing the features over a common range. One way to do the same is by using the cosine distance (or vector dot product), which is defined as [7]:
(3)
V. DATABASES USED
Proposed algorithm has been used different database for face (half face and complete face), these databases are collected from many different resources as following:
A. ORL DATABASE
B. KADHEM MAHDI DATABASE
This data contains (more than 600) images. Which are collected from Thi-Qar University (Iraq). Five face images for each person the total images used are 400 image for (80) person. With different position (vertically and horizontally) and a rotation angle, the database contains face images of both gender with different orientation and simple facial expressions. Some of them are with different facial details [10].
C. OUR DATABASE
Our database contain only half face image collected from the computer science and mathematical college Iraq. For 144 persons with different ages and gender, five image for each person with different directions, facial expressions (open and closed eyes, smiling or not … ect) and different facial details (glasses and not, makeup … ect).
VI.CLUSTERING ALGORITHM
There are two types of clustering algorithms, automatic clustering algorithms in this type of clustering, the number of clusters is not given a priori, and it is automatically determinated by the used clustering algorithms. And non-automatic clustering algorithms in this type of clustering, the number of clusters must be given a priori by the programmer. The K-medoid clustering algorithm is a sample of this type. The accuracy of the obtained results depends on the predicted number of clusters chosen by the user when this algorithm is implemented on real dataset [11]
A.K-Medoid clustering algorithm
K-Medoids clustering is one such algorithm. Rather than using conventional mean/centroid, it uses medoids to represent the clusters. The medoid is a statistic, which represents that data member of a data set whose average dissimilarity to all the other members of the set is minimal. Therefore, a medoid unlike mean is always a member of the data set. It represents the most centrally located data item of the data set. The working of K-Medoids clustering algorithm is similar to K-Means clustering .It also begins with randomly selecting k data items as initial medoids to represent the k clusters. All the other remaining items are included in a cluster, which has its medoid closest to them [12]. Thereafter a new medoid is determined, which can represent the cluster better. All the remaining data items are yet again assigned to the clusters having closest medoid. In each iteration, the medoids alter their location. The method minimizes the sum of the dissimilarities between each data item and its corresponding medoid. This cycle is repeated till no medoid changes its placement. This marks the end of the process and we have the resultant final clusters with their medoids defined. K clusters are formed which are centered on the medoids and all the data members are placed in the appropriate cluster based on nearest medoid [13, 14].
ALGORITHM1: K-Medoid Clustering: Input:
k: number of clusters
D: the data set containing n items
Output:
A set of k clusters that minimizes the sum of the dissimilarities of all the objects to their nearest medoids.
(4)
Z: Sum of absolute error for all items in the data set x: the data point in the space representing a data item
: is the medoid of cluster Ci
Steps:
1.Arbitrarily choose k data items as the initial medoids.
2.Assign each remaining data item to a cluster with the nearest medoid.
3.Randomly select a non-medoid data item and compute the total cost of swapping old
4.If the total cost of swapping is less than zero, then perform the swap operation to generate the new set of k-medoids.
5.Repeat steps 2, 3 and 4 till the medoids stabilize their locations.
B.The Development K-Medoids Algorithm
Algorithm k-mean as well as the k-medoids are Based on the idea of dividing a set of points to k groups by selecting k of the centers for each group then calculate the sum of the distances for each group and then change the center and repeat this process to get to minimum possible total distance for each group. Algorithm k-mean different from algorithm for k-medoids that the first algorithm choose random points as a center for each group. The second algorithm, whereupon the selection of random points as well to be the center of each group but on the condition that these centers are among the points to be divided.
It can use the same algorithm, but the limiting factor is not the cluster number, but the largest number of points within the cluster and we repetitive change the number cluster every time until reaching the required number and thus combine the medoids closest and among the highest number within cluster not fixed cluster number
ALGORITHM2
Input:
k: number of clusters
D: the data set containing n items Output:
A set of k clusters that minimizes the sum of the dissimilarities of all the objects to their nearest medoids.
(5) Z: Sum of absolute error for all items in the data set
x: the data point in the space representing a data item : is the medoid of cluster Ci
Steps:
1. Arbitrarily choose k data items as the initial medoids.
2. Assign each remaining data item to a cluster with the nearest medoid.
3. Randomly select a non-medoid data item and compute the total cost of swapping old
medoid data item with the currently selected non-medoid data item.
4. If the total cost of swapping is less than zero, then perform the swap operation to generate
5. Repeat steps 2, 3 and 4 till the medoids stabilize their locations
6. Calculate the maximum number of points in the clusters.
7. Check if the maximum we need equal to the calculated maximum then Finish else
increment k and back to step2.
VII. CALCULATE THE EFFICIENCY
To calculate the efficiency of any calculated values must be compared with the real or ideal values. The difference between these two values is the error magnitude. To calculate the efficiency, the error magnitude is divided by the real or ideal values, then the results will subtract from (1). In case of calculating the efficiency of clustering, the calculated values are mean the elements of each cluster. The ideal clustering, which contained a 100 % efficiency ratio of and each cluster all numbers of elements without an increase or decrease. Comparison between the calculated clusters and ideal clusters by calculating the difference between all clusters and lowest difference to reach the correspond ideal cluster of clusters calculated. Therefore, the larger number of common elements between the calculated ideal cluster and the cluster represents the number of real numbers of elements in the cluster and otherwise the values is error. Calculating the amount of error by dividing the mount of error by the total number of elements and subtract the result from (1) to calculate the efficiency.
And calculating is the difference between the calculated cluster and ideal cluster by calculating the number of common elements between two clusters and subtracted it from the summation of elements of two clusters without repetition, and the difference is divided by (2), the efficiency can be calculate by using the following equations:
(6)
(7)
(8)
(9)
VIII. THRESHOLD AND EFFECT ON EFFICIENCY
The threshold value multiplied by the average values of the distance matrix, then compare with distance, if the distance was greater than the threshold, which multiplied by the average values, that means the element is not in the cluster and otherwise the distance is small that means the element will be within the cluster.
In other words, it can be regarded the threshold as the radius of the cluster. Therefore, the increase in the threshold leads to increase the number of elements of the cluster and reduce the threshold to reduce the number of elements of the cluster.
If the threshold value multiplied by the average values becomes greater or equal to the maximum value in the distance matrix, then all elements will be in one cluster and if the threshold value multiplied by the average values becomes smaller than the minimum value in the distance matrix then each element will be a cluster alone. So moderate threshold value must be selected according to the value of clustering efficiency.
IX.PROPOSED ALGORITHM
The proposed algorithm is consist from 4-steps as following:
1. Data acquisition
Several data were taken from several database as mentioned in section5 there are approximately 400-600 image of each database used for both gender and of all ages for implementation and comparison between algorithms.
2. Pre-processing
Pre-processing step includes reducing the size of image, removing noise and adjust image
intensity values to obtain enhanced image that will be suitable for clustering.
3. Calculation distance matrix
In this step, the image is converted from two-dimensional matrix into one dimensional matrix then calculating the distance between each image (test image and target image) to obtain the matrix distance depending on three types of distance as described in section (4).
4. Clustering
X. EXPERIMENTAL RESULTS
The results obtained from the clustering algorithm, of different databases and comparing the results from the proposed algorithm with the results from two clustering algorithm are as the following:
1. Using database1 and algorithm1
By using Euclidean distance, Correlation distance, and minkowski distance for the database1 the result are shown in table 1.
Table.1 efficiency algorthim1 Experiment
No.
No. of image
Efficiency of correlation
dist.
Efficiency of Euclidean
dist.
Efficiency of minkowski
dist. 1st
experiment
100 82.5% 95% 84%
2nd experiment
100 85.5% 85% 85%
3th experiment
100 84.5% 90% 85%
4th experiment
100 79% 85% 85%
5th experiment
400 77.5 % 74% 73.250%
The results from table 1 show the implementation of the algorithm1 (k-medoids) by using the database1. By using correlation , Euclidean, and minkowski distance applied to 100 image of 10 persons for each experiment except experiment 5 which used total number of data base image(400). The efficiency from 5 experiments shows that it depends on using correlation distance, Euclidean distance, and minkowski distance. As shown in table1 and fig2. The best efficiency is reached by using Euclidean distance.
Fig2. Comparison between correlation, minkowski and Euclidean distance
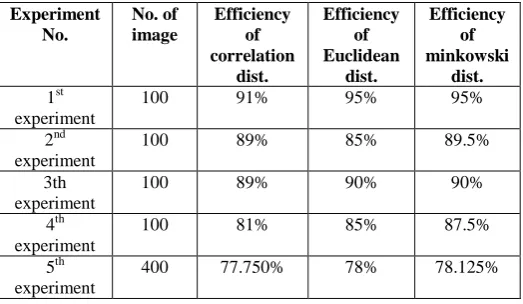
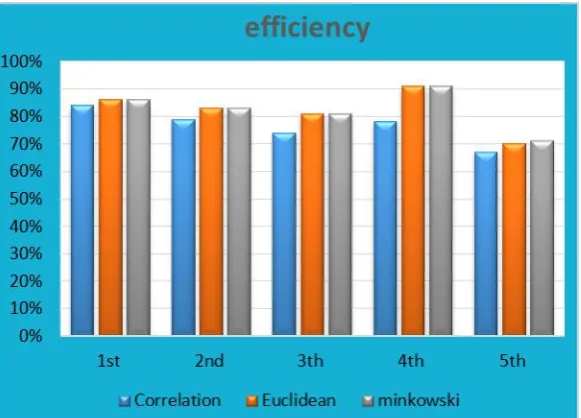
2. Using database1 and algorithm 2.
Experiment No. No. of image Efficiency of correlation dist. Efficiency of Euclidean dist. Efficiency of minkowski dist. 1st experiment
100 91% 95% 95%
2nd experiment
100 89% 85% 89.5%
3th experiment
100 89% 90% 90%
4th experiment
100 81% 85% 87.5%
5th experiment
400 77.750% 78% 78.125%
The results from table (2) show the implementation of the algorithm2 by using the database1. By using correlation , Euclidean, and minkowski distance applied to 100 images of 10 persons for each experiment except experiment 5 which used total number of data base image(400). The efficiency from 5 experiments shows that it depends on using correlation or Euclidean, or minkowski distance. As shown in table2 and fig 3. The best efficiency is by using minkowski distance.
Fig 3.Comparison between Euclidean, correlation and minkowski dist. 3. Using database2 and algorithm 1(k-medoid algorithm)
By using Euclidean, Correlation, and minkowski distance for the database2 the results are shown in table 3
Table.3 efficiency algorithm1 Experiment No. No. Of image Efficiency of Correlatio n dist. Efficiency of Euclidean dist. Efficiency of minkowski dist. 1st experiment
100 78% 77.5% 75.5%
2nd experiment
100 65.5% 71.5% 72.5%
3th experiment
100 74% 73.5% 74.5%
4th experiment
100 75% 80% 79%
5th experiment
Table3 shows the results from algorithm1 and database2. 5 experiments were implemented for 20 persons, each person has 5 images for each experiment except experiment 5 which used total number of data base image (400). By using (correlation, Euclidean and minkowski distance), the efficiency from these experiments shows that the result from Euclidean gives the best efficiency as shown in fig 4.
Fig 4. Comparison between correlation, minkowski and Euclidean distance
4. Using database2 and algorithm 2(modify k-medoid algorithm)
By using Euclidean, Correlation distance, and minkowski distance and the implementation algorithm2 for the database2, the results are shown in table 4.
Table.4 efficiency algorithm2 on database2 Experiment
No.
No. Of image
Efficiency of Correlation
dist.
Efficiency of Euclidean
dist.
Efficiency of minkowski
dist. 1st
experiment
100 84% 86% 86%
2nd experiment
100 79% 82.5% 83%
3th experiment
100 74% 80.5% 80.5%
4th experiment
100 78% 91% 91%
5th experiment
400 67% 70% 70.75%
Fig 5. Comparison between correlation, minkowski and Euclidean distance
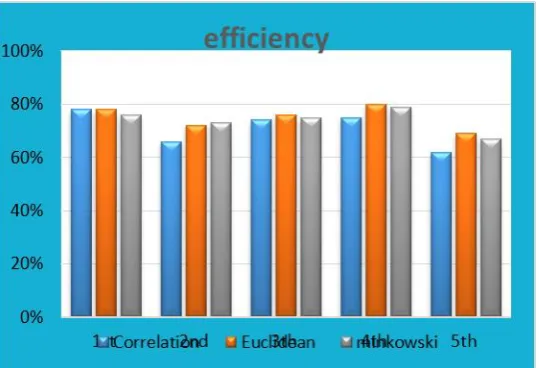
5. Using database3 and algorithm 1 (k-medoid algorithm)
By using Euclidean, Correlation, and minkowski distance and the implementation of algorithm1 for the database3, the results are shown in table5.
Table.5 efficiency of algorithm1 Experiment No. No. Of
image
Efficiency of Correlation
dist.
Efficiency of Euclidean
dist.
Efficiency of minkowski
dist.
1st experiment 100 72% 72.5% 85%
2nd experiment 100 68% 69.5% 85% 3th experiment 100 69.5% 75.5% 87.5%
4th experiment 100 74% 76% 85% 5th experiment 100 69% 70.5% 60.5%
6th experiment 100 69.4% 77% 57% 7th experiment 100 63.6842% 74.736% 75%
8th experiment 700 60.34% 62.2302 % 62.2302 %
Fig 6. Comparison between correlation, Euclidean and minkowski distance
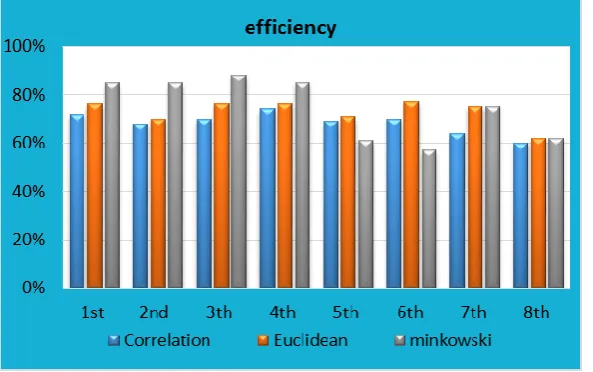
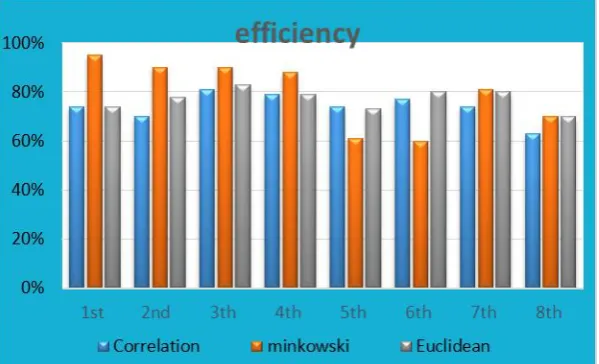
6. Using database3 and algorithm 2(modify of k-medoid algorithm)
By using Euclidean, Correlation, and minkowski distance and the implementation of algorithm2 for the database3, the results are shown in table6.
Table.6 efficiency of algorithm2 Experiment
No.
No. Of image
Efficiency of Correlation
dist.
Efficiency of minkowski
dist.
Efficiency of Euclidean
dist. 1st
experiment
100 74% 95% 73.5%
2nd experiment
100 69.5% 89.5% 77.5%
3th experiment
100 80.5% 90% 83%
4th experiment
100 78.5% 87.5% 78.5%
5th experiment
100 74% 60.5% 73%
6th experiment
100 77% 60% 80%
7th experiment
100 73.6842% 80.5263% 80%
8th experiment
700 63.479% 69.856% 69.8561 %
Fig 7.Comparison between correlation, Euclidean and minkowski distance
XI.CONCLUSIONS
The efficiency from results of k-medoids algorithm is changed because selecting random centers for clusters, which will not give the same efficiency for the same sample of images while the overlapping and dispersion in the clusters in this algorithm will cause the luck of efficiency. This algorithm has the best results when the database is small, but if the database is big, it will be slower and give bad efficiency.
But the efficiency from algorithm2 (modify of k-medoids) has best result and more efficiency from algorithm1 when the database is big, when the database is small, it will be same the result algorithm1. Because the results most be less overlapping and more dispersion.
There are many reasons for effect the efficiency depends on a database, where increasing the size of clustering will increase the probability of scattering (dispersion), increase the number of images will increase the overlap between clusters.
The defects of a data base image are coming from the differences in contrast, background of the image and face angle (rotated by angle).
These defects will effect by increasing the distance in one cluster and others clustering (which will make overlapped) or increase the distance between the same clustering (dispersion).
REFERENCES
[1] Moumen El-Melegy"On Cluster Validity Indexes in Fuzzy and Hard Clustering Algorithms for
Image Segmentation" IEEE 1-4244-1437-7/07.2007.
[2] Maria Halkidi, Y. Batistakis and M. Vazirgiannis" On Clustering Validation Techniques" Journal
of Intelligent Information Systems, 17:2/3, 107–145, 2001.
[3] Cem Iyigun"Probabilistic Distance Clustering"The State University of New Jersey, November,
2007.
[4] Saraf Ashish" Design of a Hand Geometry Based Recognition System" Department of Computer
Science & Engineering Indian Institute of Technology Kanpur, Jan 2007.
[5] Raida Hentati, Manel Hentati, and Mohamed Abid"Development a New Algorithm for Iris
Biometric Recognition" International Journal of Computer and Communication Engineering, Vol. 1, No. 3, September 2012.
[6] Ioannis Maghiros" Biometrics at the frontiers: Assessing the impact on Society" European
Communities, 2005.
[7] Swagatam Das, Ajith Abraham and Senior Member"Automatic Clustering Using an Improved
Differential Evolution Algorithm " IEEE Transactions on Systems, Man, And Cybernetics—Part
A: Systems and Humans, VOL. 38, NO. 1, January 2008.
[8] Rasha F. Kashef"Cooperative Clustering Model and Its Applications" D.Ph. The University of
Waterloo, 2008.
[9] http://www.cl.cam.ac.uk/Research/DTG/attarchive/pub/data/att_faces.tar.Z.(Data base for image).
[10] Kadhem M. Hashem "A New Face Recognition Approach using Half Face" Ph.D. University of
[11] Xiao Y. Wang " Fuzzy Clustering in the Analysis of Fourier Transform Infrared Spectra for Cancer Diagnosis" University of Nottingham, September 2006
[12] Aruna Bhat "k-medoids clustering using partitioning around medoids for performing face
recognition"International Journal of Soft Computing, Mathematics and Control (IJSCMC), Vol. 3, No. 3, August 2014.
[13] Gopi gandhi" analysis and implementation of modified k-medoids Algorithm to increase
scalability and efficiency for large dataset" international journal of research in engineering and technology, volume: 03, jun-2014.