University of Windsor University of Windsor
Scholarship at UWindsor
Scholarship at UWindsor
Electronic Theses and Dissertations Theses, Dissertations, and Major Papers
9-28-2018
Quantifying the Isometric Handgrip Exercise Stimulus: Are Less
Quantifying the Isometric Handgrip Exercise Stimulus: Are Less
Expensive Alternatives Comparable to Computerized
Expensive Alternatives Comparable to Computerized
Dynamometers?
Dynamometers?
Nic James Caruana
University of Windsor
Follow this and additional works at: https://scholar.uwindsor.ca/etd
Recommended Citation Recommended Citation
Caruana, Nic James, "Quantifying the Isometric Handgrip Exercise Stimulus: Are Less Expensive
Alternatives Comparable to Computerized Dynamometers?" (2018). Electronic Theses and Dissertations. 7504.
https://scholar.uwindsor.ca/etd/7504
This online database contains the full-text of PhD dissertations and Masters’ theses of University of Windsor students from 1954 forward. These documents are made available for personal study and research purposes only, in accordance with the Canadian Copyright Act and the Creative Commons license—CC BY-NC-ND (Attribution, Non-Commercial, No Derivative Works). Under this license, works must always be attributed to the copyright holder (original author), cannot be used for any commercial purposes, and may not be altered. Any other use would require the permission of the copyright holder. Students may inquire about withdrawing their dissertation and/or thesis from this database. For additional inquiries, please contact the repository administrator via email
Quantifying the Isometric Handgrip Exercise Stimulus: Are Less Expensive Alternatives
Comparable to Computerized Dynamometers?
By:
Nicholas Caruana
A Thesis
Submitted to the Faculty of Graduate Studies
through the Department of Kinesiology
in Partial Fulfillment of the Requirements for
the Degree of Master of Human Kinetics
at the University of Windsor
Windsor, Ontario, Canada
2018
Quantifying the Isometric Handgrip Exercise Stimulus: Are Less Expensive Alternatives
Comparable to Computerized Dynamometers?
By:
Nicholas Caruana
APPROVED BY:
______________________________________________
J. Crawley
Faculty of Nursing
______________________________________________
D. Andrews
Department of Kinesiology
______________________________________________
C. McGowan, Co-Advisor
Department of Kinesiology
______________________________________________
K. Milne, Co-Advisor
Department of Kinesiology
iii
Declaration of Originality
I hereby certify that I am the sole author of this thesis and that no part of this thesis
has been published or submitted for publication. I certify that, to the best of my knowledge, my
thesis does not infringe upon anyone’s copyright nor violate any proprietary rights and that any
ideas, techniques, quotations, or any other material from the work of other people included in my
thesis, published or otherwise, are fully acknowledged in accordance with the standard
referencing practices. Furthermore, to the extent that I have included copyrighted material that
surpasses the bounds of fair dealing within the meaning of the Canada Copyright Act, I certify
that I have obtained a written permission from the copyright owner(s) to include such material(s)
in my thesis and have included copies of such copyright clearances to my appendix.
I declare that this is a true copy of my thesis, including any final revisions, as approved
by my thesis committee and the Graduate Studies office, and that this thesis has not been
iv Abstract
Isometric handgrip (IHG) training lowers resting blood pressure (BP), but the high cost of
traditional computerized IHG devices can be a barrier to use. Inexpensive mechanical IHG
devices could address the cost barrier, but the acute stimulus of such devices must be
determined. This study compared changes in systolic and diastolic BP, heart rate (HR), muscular
activation, ratings of perceived exertion (RPE), and pain between a computerized and a
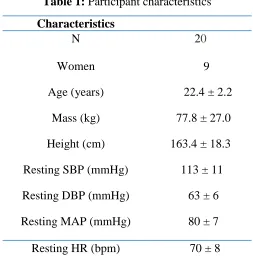
mechanical IHG device during an IHG bout. Twenty healthy adults (X ± SD; Age: 22.4 ± 2.2
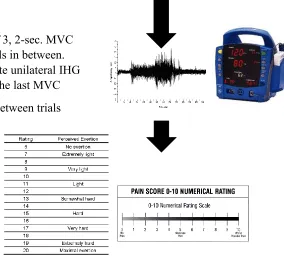
yrs.; ♀= 9; BP: 114/64 ± 11/7 mmHg) randomly performed an IHG bout (4, 2-min IHG
contractions at 30% of maximum voluntary contraction, separated by 4-mins rest) on each
device. BP, HR, and forearm surface EMG data of the non-dominant arm were collected
throughout. RPE and pain were acquired at the end of each contraction.
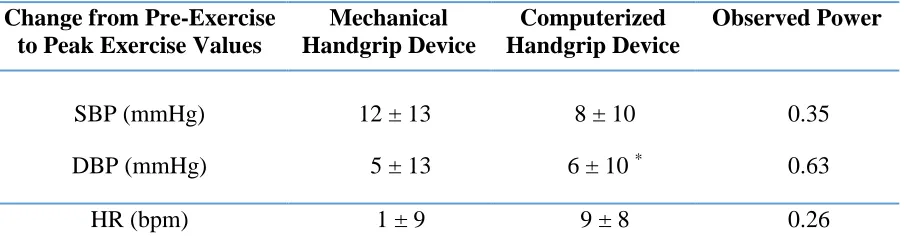
SBP, HR, RPE and NRS-Pain scores did not differ between devices (p > 0.05)>
However, statistically significant differences in DBP were observed (p < 0.05), whereby the
computerized device elicited a higher DBP response than did the mechanical device.
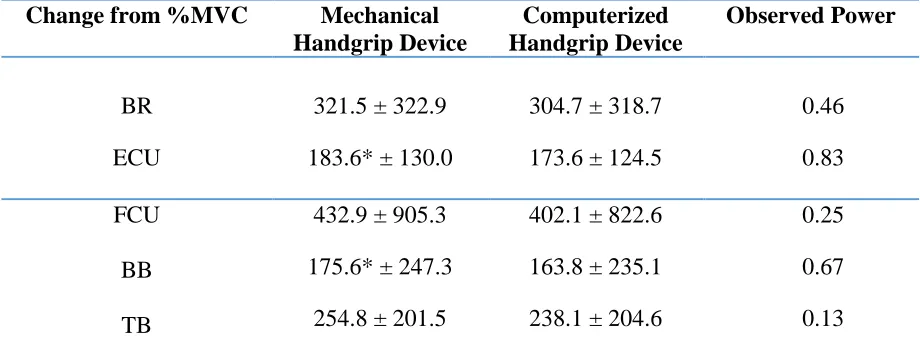
Furthermore, significant elevations in muscular activation for only the biceps brachii and
extensor carpi ulnaris were observed in the mechanical handgrip device (p < 0.05).
The mechanical IHG induced similar acute SBP, HR, RPE and NRS-pain scores as well as
similar muscular activation for 3 of the 5 muscles tested as the traditional computerized device.
These findings suggest that perhaps this inexpensive alternative device could be a feasible
equivalent to the traditional computerized device during acute exercise. Future studies should
examine whether this inexpensive handgrip device can elicit similar training-induced reductions
v
Acknowledgments
The completion of this thesis was made possible through the help and support of the
following incredible individuals:
Firstly, I would like to thank my two wonderful co-advisors Dr(s) Cheri McGowan and
Kevin Milne. Cheri, you have not only helped me grow as a researcher, but you have helped me
grow as a person. Thank you for the countless meetings, phone calls, Skype sessions, text
messages and support through these past 6 years. Words ca not express how grateful I am for all
that you have done for me both academically and personally. But most of all I wanted to thank
you for always believing in me and for taking a chance on me and including me in the PACR lab
family. Kevin, thank you for always forcing me to think outside of the box. You seem to have a
way to help me work through a problem by guiding my own thought processes to the answer.
Thank you for being in my corner and for always taking the time to drop everything and help me.
I would like to thank Dr. David Andrews, for always taking the time out of you grueling
schedule to meet with me and discuss my project and to help provide insight into the
biomechanics realm of my project. It may have been outside my comfort zone but with your
support I was able to gain invaluable skills that I will transfer into future projects and into life
itself.
Thank you, Dr. Jamie Crawley, for being on my committee and for always providing
such positivity into this project and my life in general. You go out of your way to make me feel
vi
To Dr(s), Paula van Wyke, Kenji Kenno and Matt Krause, thank you for always being
around to provide your support both personally and professionally!
Thank you to my PACR lab family, this project truly could not have happened without all
of your help and support. We have not only formed a great professional relationship, but I have
truly made some of my best friendships throughout my time in the lab. Thank you for all that you
have done and continue to do!
Finally, I would like to thank all my friends and family for sticking by me throughout this
process. You are truly my backbone and support system. I couldn’t have become the person I am
vii
Table of Contents
Declaration of Originality ... iii
Abstract ... iv
Acknowledgments ... v
List of Tables ... ix
List of Figures ... x
List of Abbreviations ... xi
Chapter 1: Literature Review ... 1
1.1 Cardiovascular Disease ... 2
1.2 Hypertension ... 3
1.2.1 Defining Hypertension ... 3
1.2.2 Prevalence of Hypertension ... 5
1.2.3 Blood Pressure Regulation ... 5
1.2.3.1 Neurological Regulation of Blood Pressure ... 6
1.2.3.2 Hormonal Regulation of Blood Pressure ... 8
1.2.3.3 Local Blood Pressure Control ... 11
1.2.4 Blood Pressure Measurement ... 13
1.2.4.1 Auscultatory Sphygmomanometry ... 13
1.2.4.2 Oscillometry ... 15
1.2.4.3 Ambulatory Blood Pressure ... 16
1.2.5 Pathophysiology of Hypertension ... 17
1.2.6 Hypertension Treatment and Management ... 20
1.3 Exercise Training ... 24
1.3.1 Acute Effects of Aerobic Exercise on Blood Pressure ... 25
1.3.2 Chronic Effects of Aerobic Exercise on Blood Pressure ... 26
1.3.3 Acute Effects of Dynamic Resistance Exercise on Blood Pressure ... 28
1.3.4 Chronic Effects of Dynamic Resistance Exercise on Blood Pressure ... 29
1.4 Isometric Resistance Exercise (IRE) ... 30
1.4.1 Acute Effects of Isometric Resistance Exercise on Blood Pressure ... 30
1.4.2 Chronic Effects of Isometric Resistance Exercise on Blood Pressure ... 31
1.4.3 Surface Electromyography in Isometric Resistance Exercise ... 32
viii
1.4.5 Gaps in the Existing Isometric Resistance Exercise Literature ... 36
1.5 References ... 39
Chapter 2: Research Project ... 61
2.1 Introduction ... 62
2.2 Research Questions ... 64
2.3 General Methodology ... 64
2.3.1 Study Participants ... 64
2.3.2 Study Design ... 65
Overview: ... 65
Eligibility and Familiarization Session: ... 66
2.3.3 Statistical Analysis ... 76
2.4 Results ... 76
2.4.1 Comparison of Acute Effects of Isometric Handgrip Exercise on Blood Pressure and Heart Rate Between Handgrip Devices ... 77
2.4.2 Comparison of Acute Effects of Isometric Handgrip Exercise on Muscular Activation Between Handgrip Devices ... 78
2.4.3 Comparison of Acute Effects of Isometric Handgrip Exercise on Subjective Ratings of Perceived Exertion and Pain Between Handgrip Devices ... 79
2.5 Discussion... 80
2.6 References ... 84
Appendix A: Recruitment Poster and Email Template: ... 88
Appendix B: Computerized Handgrip Device ... 90
Appendix C: Mechanical Handgrip Device ... 91
Appendix D: Informed Consent ... 92
Appendix E: Letter of Information ... 98
Appendix F: Intake Medical Questionnaire and Physical Activity Readiness Questionnaire (PAR-Q) ... 104
Appendix G: Blood Pressure Oscillometric Device ... 108
Appendix H: EMG Equipment and Electrodes ... 109
Appendix I: Borg Rating of Perceived Exertion Scale (RPE) ... 110
Appendix J: Pain Assessment: Numerical Rating Scale for Pain (NRS Pain) ... 111
Appendix K: Statistical Data for Chapter 2 ... 112
ix List of Tables
Table 1: Participant characteristics………...77
Table 2: Acute cardiovascular effects of isometric handgrip exercise utilizing the mechanical and computerized devices………..78
x
List of Figures
Figure 1. Study design……….………...71
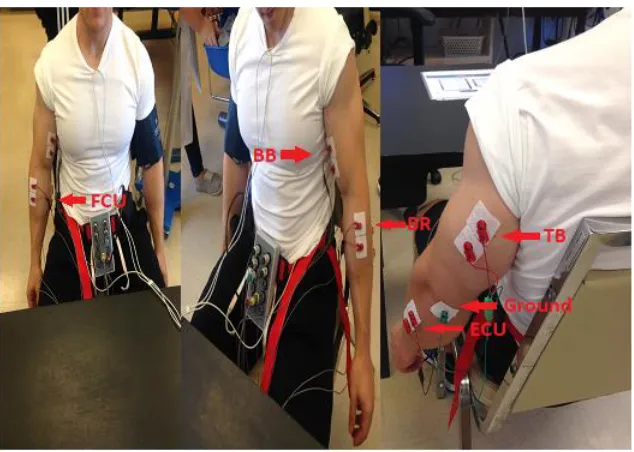
Figure 2: EMG electrode placement………..74
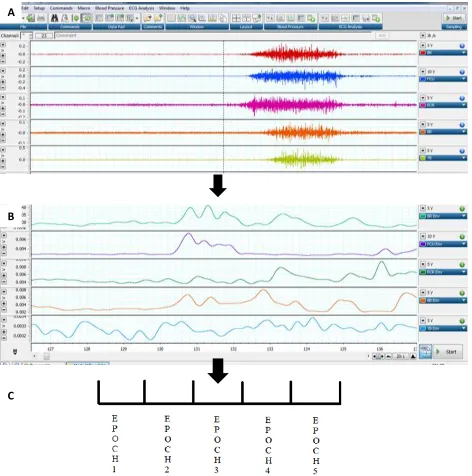
Figure 3: EMG data analysis protocol………...75
xi
List of Abbreviations [H+] – Hydrogen Ion Concentration
1RM – 1 Repetition Max
ABPM – Ambulatory Blood Pressure Monitoring
ACh – Acetylcholine
ADP – Adenosine Diphosphate
AHA – American Heart Association
ABPM – Ambulatory Blood Pressure
AMP – Adenosine Monophosphate
ANP – Atrial Natriuretic Peptide
ANS – Autonomic Nervous System
AOBP – Automated Blood Pressure Device
ATP – Adenosine Triphosphate
AV – Arginine Vasopressin
BP – Blood Pressure
Ca+ – Calcium
CC – Central Control
CCC – Cardiovascular Control Center
CCN – Cardiac Care Network of Ontario
xii DASH – Dietary Approaches to Stop Hypertension
DBP – Diastolic Blood Pressure
E – Epinephrine
EMG – Electromyography
ET-1 – Edothelin-1
EPR – Exercise Pressor Reflex
HMP – Hypertension Management Program
HR – Heart Rate
HTN – Hypertension
IHG – Isometric Handgrip
IRE – Isometric Resistance Exercise
K+ – Potassium
MAP – Mean Arterial Pressure
MEP – Motor End Plate
MUAP – Motor Unit Action Potential
MVC – Maximum Voluntary Contraction
Na+ – Sodium
Na+/K+ Pump – Sodium Potassium Pump
xiii NO – Nitric Oxide
OBP – Office Blood Pressure
PaCO2 – Partial Pressure of Carbon Dioxide
PaO2 – Partial Pressure of Oxygen
PEH – Post Exercise Hypotension
PNS – Parasympathetic Nervous System
Pre-HTN – Prehypertension
Q – Cardiac Output
RAAS – Renin-Angiotensin-Aldosterone System
RPE – Rating of Perceived Exertion
SA – Sinoatrial Node
SBP – Systolic Blood Pressure
SNS – Sympathetic Nervous system
SV – Stroke Volume
TPR – Total Peripheral Resistance
2 1.1 Cardiovascular Disease
Non-communicable diseases, such as cardiovascular disease (CVD), are now the main cause
of mortality worldwide (WHO 2013). CVD is an umbrella term for a group of diseases that
include coronary heart disease, cerebrovascular disease, hypertension (HTN), peripheral vascular
disease, heart failure, rheumatic heart disease, congenital heart disease and cardiomyopathies
(WHO, 2013). CVD is the leading cause of death globally (WHO, 2013).
In 2008, CVD contributed to nearly 17.3 million deaths worldwide and is projected to reach
23.6 million deaths by the year 2030 (WHO, 2013). Nationally, nearly 62 thousand deaths/year
were considered CVD-related in 2012 (Statistics Canada, 2015). More locally, CVD contributes
to the deaths of nearly 1225 residents of Windsor-Essex County each year (Windsor-Essex
County Health Unit, 2015).
Fortunately, advances in modern medicine have extended the lives of individuals with CVD
through effective disease management and treatment. However, CVD places a substantial
financial burden on the economy. In Canada, CVD was responsible for $20.9 billion dollars in
direct and indirect health care expenses such as hospitalization, lost wages and disability in 2008,
and healthcare-related expenses are expected to reach nearly $28.3 billion by the year 2020
(Theriault et al., 2010). Accordingly, the World Health Organization (WHO) deems CVD a
global health crisis, and places an importance on primary prevention (WHO, 2013). The WHO
recommends the adoption of a healthy lifestyle including the limitation of alcohol and tobacco
consumption, adopting healthy dietary habits, lowering sodium intake, increasing physical
activity, maintaining a healthy bodyweight and lowering high cholesterol (WHO, 2013).
Recognizing the importance of preventing the progression of CVD, the government of Ontario
has provided funding to programs such as the Cardiac Care Network of Ontario (CCN), one of
3
cardiovascular services in Ontario (CCN, 2017). Additionally, the Hypertension Management
Program (HMP), was created to improve detection, diagnosis, treatment and prevention of HTN
(Ontario Stroke Network, 2015).
1.2 Hypertension
1.2.1 Defining Hypertension
Hypertension (HTN) or chronic elevations in resting and/or ambulatory arterial blood
pressure (BP), is both a type of CVD and the leading modifiable risk factor for CVD (WHO,
2013). Arterial BP is represented by two measurements: systolic BP (SBP) representing the
pressure exerted onto the arterial walls when the ventricle contracts during the cardiac cycle, and
diastolic BP (DBP) representing the pressure exerted onto the arterial walls during the portion of
the cardiac cycle where the ventricles are relaxing, and the atria are filling (Herd, 1970).
Normal BP is indicated by a mean resting SBP of <120 mmHg and DBP of <80 mmHg
(Nerenberg et al., 2018; Whelton et al., 2017; Heart and Stroke, 2017). Furthermore, measures
between 120-129 mmHg SBP and or values >80 mmHg DBP are considered to be elevated or
“pre-hypertensive” (Pre-HTN) (Whelton et al., 2017; Heart and Stroke; 2017; Guo et al., 2011).
Pre-HTN individuals have been shown to be at greater risk of developing CVD than those with
lower BP (Guo et al., 2011). Currently, HTN is classified as resting office SBP of >130 mmHg, a
DBP >80 mm and/or prescribed anti-hypertensive medication (see below: Section 1.2.4; Whelton
et al., 2017; Myers et al., 2015). Furthermore, individuals can be diagnosed as having HTN by
using ambulatory blood pressure monitoring (ABPM) devices if they have day time BP values
>135/85 mmHg, a nighttime BP >120/80 mmHg or a 24-hour average BP >130/ 80 mmHg
(Nerenberg et al., 2018). HTN is further categorized into stages depending on whether a
particular threshold of BP is reached. Traditionally, HTN has been defined as Stage 1 HTN as
4
Canadian and American guidelines endorse more conservative stages, with Canada identifying
Stage 1 HTN as those individuals with arterial BP of 135-139/85-89 mmHg, and Stage 2 HTN as
those with arterial BP of >140/90 mmHg (Nerenberg et al., 2018). The American guidelines
offer even more conservative staging, with elevated BP ranging from 120-129/ <80 mmHg,
Stage 1 HTN between 130-139/80-89 mmHg, and Stage 2 HTN ≥140/ ≥90 mmHg, Whelton et
al., 2017). Furthermore, a diagnosis of hypertensive urgency HTN can be given if an individual
has a BP exceeding 180/120 mmHg (Whelton et al., 2017). Finally, a diagnosis of hypertensive
emergency can be given if the BP exceeds 180/120 mmHg and includes the presence of target
organ damage (Whelton et al., 2017).
With advancements in BP measurement technology (see Section 1.2.4), HTN can now be
more accurately diagnosed. For instance, AOBP devices provide more accurate representations
of BP compared with traditional manual measurements and allow for a diagnosis of HTN to be
made if an individual has a resting BP >135/85 mmHg (Myers et al., 2010; Nerenberg et al.,
2018). New research suggests that the superior method for determining BP is through the use of
ambulatory BP monitoring (ABPM), which provides insight into BP fluctuations over a 24-hour
duration (Pickering et al., 2006). Individuals can be diagnosed as having HTN using ABPM
devices if they have day time BP values >135/85 mmHg, a night time BP >120/80 mmHg or a
24-hour average BP >130/80 mmHg (Nerenberg et al., 2018).
HTN can also be categorized based on the origin of the elevations in BP as either primary
(essential) or secondary HTN. Secondary HTN is characterized by elevations in BP that can be
directly attributed to another disease such as renal failure, renovascular disease, aldosteronism
and pheochromocytoma and accounts for only 5% of all HTN cases (Gupta-Malhotra et al.,
5
can be identified but is suspected to be linked to numerous factors such as having a genetic
predisposition to HTN as well as lifestyle factors such as sedentary behavior, alcohol and
tobacco use, a nutritionally deficient diet, high stress and obesity (Gupta-Malhotra et al., 2014;
Carretero et al., 2000). Unfortunately, primary HTN makes up 95% of all HTN cases
(Gupta-Malhotra et al., 2014; Carretero et al., 2000). Consequently, prevention of HTN should be
targeted through the modification of the lifestyle factors listed above (WHO, 2013).
1.2.2 Prevalence of Hypertension
Of the 17.2 million CVD-related deaths in Canada in 2012, 9.4 million of these are the
result of BP-related complications due to HTN (WHO, 2013). The worldwide prevalence of
HTN is steadily rising; in 2000, nearly 600 million people were diagnosed with HTN and this
number rose to 1 billion by the year 2010 (Mills et al., 2016). In Canada, nearly 5.3 million
Canadians were diagnosed with HTN in 2014, which equates to about 1 in every 5 Canadians as
having HTN (Statistics Canada, 2016). More locally, 19% of people ages 12 years and older are
diagnosed with HTN in Windsor-Essex County, which equated to nearly 74 000 people in 2011
(Windsor-Essex County Health Unit, 2014). Therefore, immediate action must be taken in
primary prevention and disease management to prevent the growing rates of both HTN and
CVD.
1.2.3 Blood Pressure Regulation
BP regulation is a key modulator of adequate perfusion of body tissues (Herd, 1970). BP
is controlled through manipulations of cardiac output (Q) and total peripheral resistance (TPR;
Raven & Chapleau, 2014). Q is the product of stroke volume (SV), and heart rate (HR; Raven &
Chapleau, 2014), while TPR refers to the amount of resistance to blood flow that is exerted by
the systemic blood vessels through arterial diameter manipulations known as vasoconstriction
6
represents the amount of blood that is pumped from the heart per beat, whereas HR refers to the
number of heart beats per minute (Raven & Chapleau, 2014). Therefore, BP is altered by
perturbations in Q via increases or decreases in HR and/or SV, and through manipulations of
TPR via changes to arterial diameter. This process of BP modulation is controlled through the
interaction of intrinsic neurological, hormonal and local arterial mechanisms.
1.2.3.1 Neurological Regulation of Blood Pressure
BP is centrally regulated by the autonomic nervous system (ANS) and its two branches:
the sympathetic nervous system (SNS) and the parasympathetic nervous system (PNS)
(Dampney et al., 2002). SNS stimulation increases the excitation of contractile neurons in the
heart, which increases HR, alters Q, and results in a rise of BP (Dampney et al., 2002). The SNS
can also cause vasoconstriction, subsequently increasing TPR and BP (Dampney et al., 2002).
Alternatively, the PNS lowers BP by stimulating the vagus nerve which innervates the heart
(Pavlov & Tracey, 2012). Vagus nerve stimulation activates the muscarinic receptors (see
Section 1.2.3.2) responsible for the lowering of HR and decreasing myocardial excitability
(Pavlov & Tracey, 2012; Dampney et al., 2002). Optimal BP is maintained through balancing the
stimulation of the SNS and PNS.
The activity of the PNS and SNS is regulated by two higher control centres in the brain:
the central command (CC) and the cardiovascular control centre (CCC) (Nobrega et al., 2014).
The CC senses and regulates ANS activity via stimulation of the CCC (feed-forward control) that
innervates the heart and blood vessels, which can result in either SNS or PNS stimulation to
increase or decrease BP, respectively (Nobrega et al., 2014). Additionally, this system also has
innate negative feedback control through receptors located in the periphery known as arterial
baroreceptors, chemoreceptors, and muscle afferent receptors. These receptors all provide
7
Arterial baroreceptors are sensitive to tensile changes in the carotid arteries, pulmonary
vessels, and aorta (Lafranchi & Somers, 2002). When BP is increased above a certain set point,
this causes pressure to be placed on the walls of the blood vessel, resulting in stretching of the
arterial walls (Papaioannou, 2007). Baroreceptors detect this stretching and trigger afferent
signalling to the CCC, which in turn decreases SNS stimulation, HR, cardiac contractility and
TPR (Papaioannou, 2007). Alternatively, if BP drops below the set point, a decrease in tension
against the vessel walls triggers afferent signalling from the baroreceptors to the CCC
(Papaioannou, 2007). These signals reduce PNS and increase SNS signalling to increase HR,
cardiac excitability, and TPR in order to raise BP back to the homeostatic set point
(Papaioannou, 2007; Lafranchi & Somers, 2002).
Chemoreceptors, located in the carotid and aortic arteries, are responsible for detecting
perturbations of the partial pressures of oxygen (PaO2), carbon dioxide (PaCO2), and hydrogen
ion concentrations ([H+]) that are produced as a result of increased cellular respiration (Moreira
et al., 2011). Under low oxygen states, such as during moderate to vigorous aerobic exercise,
chemoreceptors detect a decrease in [PaO2] in addition to an increase in [PaCO2] and [H+], which
triggers afferent signalling to the CCC to stimulate SNS activity (Moreira et al., 2011). This
stimulation of the SNS raises HR, Q and TPR, which increases BP and stimulates ventilation for
the purposes of adequate tissue perfusion of oxygen (Moreira et al., 2011).
The final periphery receptors involved in the feedback control between the CC and CCC
are the muscle afferent receptors. There are two types of muscle afferent receptors that regulate
BP homeostasis: type III afferent mechanoreceptors and type IV metaboreceptors (Leshnower et
al., 2001). Similar to arterial baroreceptors, the main function of the type III afferent
8
during muscular contraction (Leshnower et al., 2001). When stimulated, type III afferent
mechanoreceptors relay this information back to the CCC, influencing SNS stimulation and PNS
inhibition, which raises Q through increases in HR and subsequently raises BP (McCord &
Kaufman, 2010). Although mechanoreceptors and metaboreceptors serve a similar purpose (alter
BP in response to physical demands such as exercise), type IV afferent metaboreceptors differ in
terms of the stimuli to which they are sensitive. Metaboreceptors are receptors that are sensitive
to increases in the concentration of by-products of metabolism, which include lactic acid,
potassium (K+), deprotonated phosphate, serotonin, bradykinin and adenosine (McCord &
Kaufman, 2010). When elevated concentrations of metabolites are detected, the metaboreceptors
relay this information to the CCC, which augments SNS activity, reduces PNS stimulation and
increases Q, HR, and TPR, ultimately increasing BP to clear these metabolic by-products from
metabolically active tissue (McCord & Kaufman, 2010). This increase in BP allows for greater
perfusion of blood to the active muscle, thus delivering more O2 to active tissues and facilitating
the disposal of accumulated metabolites (McCord & Kaufman, 2010). Mechanoreceptors and
metaboreceptors ultimately work synergistically to accommodate for normal hemodynamics
during exercise (McCord & Kaufman, 2010).
1.2.3.2 Hormonal Regulation of Blood Pressure
Changes in BP can also be regulated via the neuroendocrine system through coordinated
actions of hormones (Gordon et al., 2015). The hormones influencing BP include the
catecholamines epinephrine (E) and norepinephrine (NE), acetylcholine (ACh), angiotensin,
aldosterone, arginine vasopressin (AVP) and atrial natriuretic peptide (ANP).
The ANS is regulated by preganglionic and postganglionic neurons that secrete
neurotransmitters at the synaptic clefts to transfer signals across the axons (Thomas, 2011). The
9
the SNS and PNS, however the SNS releases NE via postganglionic neurons at the synaptic cleft,
whereas the PNS releases ACh (Gordan et al., 2015).Both E and NE are secreted by the adrenal
medullary cells via stimulation of sympathetic innervation (Thomas, 2011). The function of E
and NE is mainly dependent on the type and location of the receptor to which they bind
(Guimaraes & Moura, 2011). There are two main types of receptors: α-adrenergic and
β-adrenergic (Guimaraes & Moura, 2001). The α1-β-adrenergic receptors are found in most vascular
smooth muscle of sympathetic target organs (excluding the heart), while the α2-adrenergic
receptors are located near the synaptic junction of SNS nerve cells of vascular beds (Guimaraes
& Moura, 2001). Activation of both types of α-adrenergic receptors elicit vasoconstriction
(Thomas, 2011). β1-adrenergic receptors are found in the heart, kidneys, lungs, and adipose
tissue, whereas β2-adrenergic receptors are found in most SNS target organs such as the heart,
eyes, kidney, brain, gastrointestinal tract, and vascular smooth muscle (Guimaraes & Moura,
2001; Gordon et al., 2015). Stimulation of β1-adrenergic receptors by E or NE leads to increases
in HR and myocardial contractility, as well as triggering the kidneys to release renin to increase
vasoconstriction and ultimately BP (Gordon et al., 2015). β2-adrenergic receptor activation
causes vasodilation of SNS target organs such as the heart, liver and skeletal muscles in order to
increase blood perfusion to metabolically active tissue (Guimaraes & Moura, 2001). The
activation of α-adrenergic and β-adrenergic receptors causes changes in smooth muscle diameter
via vasoconstriction and vasodilation, ultimately resulting in the regulation of BP from changes
in TPR (Furchgott, 1983).
Alternatively, the PNS is regulated by the release of ACh at the synaptic junction of
parasympathetic nerve cells (Gordon et al., 2015). The binding of ACh occurs on two types of
10
receptors are found in abundance in cardiac muscle cells. ACh binding triggers M2 receptor
activation, resulting in decreasing depolarization through perturbations in conduction velocity
across the atrioventricular node (Gordon et al., 2015). This works to synergistically promote
normal hemodynamics through a decreased cardiac contractility through a reduction in HR,
subsequently leading to decreases in Q and BP (Gordon et al., 2015; Mysliveček & Trojan,
2003). M3 receptor activation facilitates the release of nitric oxide (NO) from the endothelium
which causes vascular vasodilation and a decrease in BP (see Section 1.2.3.3; Brodde & Michel,
1999).
The renin-angiotensin-aldosterone system (RAAS) works to regulate BP through its
influence on vascular tone and blood volume (Nguyen et al., 2002). Reductions in blood volume
triggers the release of the glycoprotein renin from the kidneys, which converts the non-active
pro-hormone angiotensinogen into angiotensin I (Nguyen et al., 2002). Angiotensin I is further
modified by angiotensin converting enzyme (ACE) into angiotensin II, the active form of the
hormone (Nguyen et al., 2002). Angiotensin II is a powerful vasoconstrictor that increases BP
through increases in TPR (Nguyen et al., 2002). Decreases in blood fluid volume also trigger the
release of a hormone known as aldosterone from the adrenal cortex, which stimulates fluid
retention through conservation of sodium (Granger & Schnackenberg, 2000). This process
increases the blood fluid volume, which raises SV and increases BP via increases in Q (Weir &
Dzau, 1999; Hall et al., 1990).
AVP, also known as antidiuretic hormone, is secreted by the posterior pituitary in
response to decreases in blood fluid balance and acts as a powerful vasoconstrictor that increases
BP by augmenting TPR (Henderson & Bryon, 2007; Nguyen et al., 2002). AVP works
11
(Henderson & Bryon, 2007). AVP also stimulates the release of aldosterone, which causes an
increase in blood volume, SV, and BP (Granger & Schnackenberg, 2000; Hall et al., 1990).
ANP is a hormone secreted by the atria in response to increased stretching of the atrial
vessel walls in the heart (Venugopal, 2001). Release of ANP is related to increased sympathetic
activation (Ruskoaho, 2011). Therefore, ANP lowers BP by inhibiting actin-myosin binding of
cardiac vessel smooth muscle, which inhibits vasoconstriction of the blood vessels and lowers
TPR (Münzel et al., 2003). ANP can also control BP through decreases in blood volume. Release
of ANP triggers the kidneys to expel both water and sodium, leading to decreases in Q through a
smaller SV, ultimately reducing BP (Venugopal, 2001).
1.2.3.3 Local Blood Pressure Control
BP is regulated through locally secreted substances in the peripheral vasculature that are
produced in response to metabolic demands of tissues. These locally released substances include
NO, endothelin-1 (ET-1), K+, and adenosine derivatives; they work by modifying BP through
changes in TPR via alteration of the diameter of smooth muscle vasculature (Webb, 2003).
The increase in blood flow to muscles is associated with an increased metabolism, which
elicits a rise in the amount of vascular pressure or “shear stress” exerted against the most inner
layer of the blood vessel known as the endothelium (Furchgott, 1983). This increase in
endothelial pressure triggers the release of a potent vasodilatory compound known as NO
(Furchgott, 1983). NO is derived from the amino acid L-arginine by the enzyme NO synthase
(Thijseen et al., 2011). NO then diffuses out of the endothelium where it can react with
vasculature smooth muscle to increase arterial diameter, reducing TPR and thus lowering BP
12
ET-1, a vasoconstrictor, is a regulatory mechanism for BP that counters the localized NO,
as previously noted. ET-1 production is activated by endothelial chemicals (AVP and NE) and
mechanical (shear stress) stimulation (Agapitov & Haynes, 2002). The action of ET-1 is entirely
dependent on which type of ET-1 receptor is activated. Upon activation, ETB2 and ETA receptors
trigger vasoconstriction of vascular smooth muscle, thus increasing TPR and raising BP (Gordon
et al., 2015). Alternatively, ETB receptor activation causes NO release from the endothelium due
to increases in shear stress, triggering vascular smooth muscle relaxation (vasodilation), resulting
in decreased TPR and ultimately lowering BP (Agapitov & Haynes, 2002).
K+ is another key player in localized BP regulation (Haddy et al., 2006). During muscular
contractions, K+ is released from the endothelium due to sheer stress and accumulates in the
intracellular space of vascular smooth muscle membranes (Haddy et al., 2006). This
accumulation of K+ stimulates the Na+/K+ pump to hyperpolarize the cell, which in turn inhibits
the influx of Ca+ (Haddy et al., 2006). This decrease in intracellular Ca+ inhibits the ability of
vascular smooth muscle to contract, which lowers TPR, and thus decreases BP (Haddy et al.,
2006).
Adenosine triphosphate (ATP), an adenosine derivative, is an important substrate for
muscular contraction (Marshall, 2007). Utilization of ATP in muscular contraction elicits the
accumulation of ATP by-products, such as adenosine diphosphate (ADP), adenosine
monophosphate (AMP), and adenosine (Haddy & Scott, 1968). As ATP concentrations decrease
and the concentration of other adenosine metabolites increase, these metabolites activate
adenosine receptors on the endothelium known as A1, A2A or A2B receptors (Marshall, 2007).
13
the arterial diameter to augment blood flow to the working muscles in order to combat the
metabolic demand (Marshall, 2007). This vasodilation decreases TPR, and thus lowers BP.
1.2.4 Blood Pressure Measurement
BP measuring techniques range in level of invasiveness and accuracy. Currently, the most
accurate method of BP measurement involves the implantation of a catheter into the radial artery
(Balaji & Shah, 2011). Beat-to-beat SBP, DBP and mean arterial pressure (MAP; [systolic BP +
2(diastolic BP)] / 3) are derived from a pressure transducer attached to the catheter, which is
inserted into the brachial artery through the wrist (Balaji & Shah, 2011). Although this method is
classified as the gold standard in BP measurement, due to the higher costs, invasiveness and
expertise required to administer the catheter, it is not used as a practical BP measurement
modality by most clinicians (Balaji & Shah, 2011). Currently, clinicians can implement less
invasive, time- and cost-effective measurement tools for BP like auscultatory
sphygmomanometry and oscillometry (Pickering et al., 2005). Both techniques are non-invasive
and obtain measures at the level of the brachial artery (Pickering et al., 2005). Non-invasive
forms of BP monitoring provide similar accuracy to invasive techniques (Bing et al., 2014).
Furthermore, there is growing clinical interest regarding a novel form of oscillometry known as
“ambulatory BP monitoring”. Ambulatory BP monitoring allows for BP measurement over a
24-hour duration and evidence suggests it is a better prognostic indicator of CVD compared to
office BP measurement (Sherwood et al., 2012).
1.2.4.1 Auscultatory Sphygmomanometry
A non-invasive technique known as auscultatory sphygmomanometry is performed by
utilizing an inflatable cuff and sphygmomanometer to determine BP (Beevers et al., 2001). BP is
determined through the timing of audible sounds produced as blood flow causes oscillations
14
employed when assessing “office BP” (OBP; Nerenberg et al., 2018). An inflatable cuff is placed
around the patient’s arm and inflated to a point at which no Korotkoff sounds are heard due to
occlusion of blood flow (>SBP; Pickering et al., 2005). A stethoscope is then placed at the point
of radial pulsation (Beevers et al., 2001). The cuff is gradually deflated and the examiner listens
for the onset and absence of the Korotkoff sounds (Beevers et al., 2001). The Korotkoff sounds
can be categorized into 5 phases: the 1st phase is categorized by the first presence of Korotkoff
sounds and represents SBP, while the 5th stage is when the audible sound is no longer heard and
represents DBP (Pickering et al., 2005).
Although this technique is non-invasive, and at one point was widely used among
physicians, it has inherent limitations due to its dependence on the skill of the observer to
interpret the exact onset and offset of the Korotkoff sounds (Pickering et al., 2005). Lack of
concentration, poor hearing and confusion from visual or audible cues have been reported to
cause error in BP measurement using this technique (Beevers et al., 2001). Furthermore,
observer bias has been suggested to also be a limitation to this method, as the observer may
already have a preconceived notion of what an individual’s BP may be based on their physical
appearance, sex or age (Beevers et al., 2001). Observer bias may lead to an under-diagnosis of
BP for younger healthy weight individuals and over-reporting BP for older or obese individuals
(Beevers et al., 2001). Another common limitation to using this technique occurs due to
assignment of the wrong size cuffs for individuals (Manning et al., 1983). Using a cuff that is too
big leads to an under-estimation of reported SBP and DBP values by 10-30 mmHg due to these
cuffs requiring more pressure to occlude arterial blood flow (Manning et al., 1983). Due to these
limitations, the auscultatory sphygmomanometry method could fail to diagnose or misdiagnose
15 1.2.4.2 Oscillometry
Another non-invasive BP measurement technique using an inflatable cuff employs
“oscillometry” to derive BP, and is used for AOBP measurement (Nerenberg et al., 2018).
Unlike auscultatory sphygmomanometry, oscillometry does not rely on human interpretation of
Korotkoff sounds, but instead measures BP via an electric pressure transducer (Stergiou et al.,
2011). As with auscultatory sphygmomanometry, a cuff is inflated over the arm until no
oscillations are detected by a pressure transducer within the device (Ogedegbe & Pickering,
2010; Berger, 2001). As the cuff is gradually deflated, the pressure transducer detects the point
of maximal oscillation, which has been shown to correspond with MAP (Ogedegbe & Pickering,
2010). The oscillometric device can then calculate SBP and DBP using algorithms (Pickering,
2005). The main advantage to this technique over the auscultatory sphygmomanometer is that it
prevents observer bias and error, as well as being less influenced by external noise (Stergiou et
al., 2011). However, a notable limitation to this technique is that the oscillometric algorithms
used to determine BP do not consider external factors influencing arterial BP like arterial
stiffness, which can lead to errors in calculation of BP (Lui et al., 2013). It is also important to
note that body position can influence BP measurement; participants should be seated with legs
uncrossed and with the arm supported in a position that is approximately heart height (Pickering
et al., 2005). Furthermore, it is important to ensure that the participant is fitted with an
appropriately sized cuff, as cuffs that are too large or small have been shown to lead to
inaccurate measurements of BP (Pickering et al., 2005). In addition, the algorithms used to
derive BP are not standardized and vary depending on manufacturers, which could lead to
potential discrepancies in BP values obtained between devices (Ogedegbe & Pickering, 2010).
Despite these potential limitations, evidence supports oscillometry as providing reliable
16 1.2.4.3 Ambulatory Blood Pressure
ABPM is another oscillometric technique that involves acquiring BP measurements
across a 24-hour time span (O’Brien et al., 2013). Unlike other oscillometric devices, the
inflatable hose is attached to a portable monitor, which allows individuals to have BP
measurements taken in non-clinical settings that may more accurately represent BP (O’Brien et
al., 2013). The ABPM device is programed to take BP measurements every 30 minutes, with
some protocols even utilizing BP measurement every 15 or 20 minutes (O’Brien et al., 2013;
Pickering et al., 2006). The data from the ABPM device are transferred to a computer where a
mean daytime, nighttime and 24-hour BP values can be determined (O’Brien et al., 2013;
Pickering et al., 2006).
The main advantage of using ABPM is that its portability allows BP to be measured in
non-clinical settings and prevents the phenomenon known as “white coat hypertension” (O’Brien
et al., 2013, Franklin et al., 2013). White coat HTN is defined as BP measurements within the
HTN range when BP is examined in a clinical setting, but values fall within the normal range
when BP is taken at home or a non-clinical setting (Franklin et al., 2013). White coat HTN is
suggested to be caused by anxiety in a clinical setting and is particularly prevalent in women,
older adults and those recently diagnosed as having HTN (Franklin et al., 2013). ABPM can be
used to rule out white coat HTN, and therefore, prevent misdiagnosis of HTN, and potentially
limit unnecessary treatment of non-hypertensive individuals (i.e., being prescribed
anti-hypertensive medications) (Lovibond et al., 2011).
In healthy individuals, SBP and DBP decreases or “dips” at least 10% during sleep; these
individuals have been classified as “normal dippers” (Birkenhäger & van den Meiracker 2007;
Mahabala et al., 2013). ABPM can be used to assess cardiovascular risk by measuring BP
17
(>10% reduction in BP), or has reductions <10%, which would classify them as a non-dipper
(Birkenhäger & van den Meiracker 2007; Mahabala et al., 2013). Furthermore, dipping >20%
would classify an individual as an excessive dipper (Kazuomi et al., 1996). Evidence supports
that non-dipping and excessive dipping are correlated to increased cardiovascular risk, such as
increased arterial stiffness, cardiac organ damage, diabetic retinopathy, impaired glucose
tolerance and increased risk of CVD development (Hermda et al., 2013; Birkenhäger & van den
Meiracker 2007; Dela Mea et al., 2005; Kazuomi et al., 1996). Additionally, ABPM has been
shown to be a better predictor of CVD-related mortality and morbidity in women than men
(Boggia et al., 2011). Therefore, ABPM is a useful tool for both the diagnosis of HTN, and the
determination of CVD risk for individuals diagnosed with HTN.
1.2.5 Pathophysiology of Hypertension
Although the direct mechanism of primary HTN development is not entirely understood,
evidence supports the idea of pathologically high BP resulting from perturbations to neural,
hormonal and/or local homeostatic mechanisms (Bakris & Mensah, 2002).
The ANS plays a key role in BP maintenance. In the case of HTN, evidence suggests that
overstimulation of the SNS leads to increases in BP through unusually high concentrations of
circulating adrenergic neurotransmitters (NE and E) in hypertensive individuals (Mancia &
Grassi, 2014; Ferrier et al., 1993). This increase in stimulation of sympathetic nerves and leads to
increases in Q due to elevated HR and fluid retention that will ultimately increase BP (Parati &
Esler, 2012). Along with SNS overstimulation, under-activation of the PNS is observed in
hypertensive individuals, which leads to reduced vagus nerve inhibition of HR (Mancia &
Grassi, 2014). This combined overstimulation of the SNS and under-activation of the PNS leads
18
In the case of HTN, chronic elevations in BP lead to structural remodelling of the arterial
walls, which may ultimately cause the stiffening of cardiac and peripheral blood vessels (Mayet
& Hughes, 2003). Recall that baroreceptors located in the carotid, pulmonary and aortic blood
vessels detect mechanical stretching of the vessel, and once a threshold of stretch is detected,
they will trigger CC signalling to shunt SNS activity and ultimately lower BP (Lafranchi &
Somers, 2002). In the case of HTN, chronic elevations in BP cause vascular remodelling of the
carotid arterial walls causing them to thicken and loose elasticity (Honzikova & Fiser, 2009).
Thus, baroreceptors lose sensitivity and become less able to detect stretching of the carotid
arteries, which can lead to chronically increased BP (Honzikova & Fiser, 2009). This effect of
baroreceptor insensitivity is supported through research showing that individuals with
chronically high BP have decreased baroreceptor function, compared to individuals with normal
BP (Mussalo et al., 2002).
In regard to the RAAS system, the increased SNS activation discussed above leads to
elevations in circulating renin and angiotensin II, leading to increased fluid retention and
vasoconstriction, ultimately increasing BP (Manrique et al., 2009). There is growing evidence to
support that this increase in RAAS activity negatively affects vasculature structure remodelling,
which contributes to systemic stiffening of the arteries and cardiac and peripheral blood vessels,
which increases TPR, BP and lowers baroreceptor sensitivity (Pacurari et al., 2014).
Additionally, in cases of endothelial dysfunction, production of vasoconstrictor ET-1 is
up-regulated and NO is down-up-regulated (Hayes & Webb, 1998). This leads to localized
vasoconstriction and impaired vasodilation, which increases TPR, and in turn, BP (Hayes &
Webb, 1998). There is evidence to show that hypertensive individuals display higher
19
elevation in ET-1, together with limited NO production, leads to impaired local control of
vasculature, which increases TPR and ultimately BP (Dharmashankar & Widlansky, 2010).
There are numerous lifestyle factors that are thought to contribute to chronic elevations in
BP. Excessively high sodium intakes, lack of physical activity, high psychological stress,
smoking, diet lacking in fruits, vegetables, magnesium, Ca+ and K+ have been shown to increase
the development of HTN (Nerenberg et al., 2018; Frisoli et al., 2011).
The risk of developing HTN also increases as a result of aging (Sun, 2015). For example,
arterial stiffening throughout the aging process is suggested to be caused by a combination of
metabolic syndrome, inflammation and dysfunction of neural hormonal pathways (i.e., increased
SNS activity, aldosterone production and Na+ sensitivity), which all can contribute to
endothelium dysfunction and increased arterial stiffness (Sun, 2015). Additionally, aging is
associated with decreased baroreceptor function (Webber et al., 1989). Increased sodium
retention, arterial stiffening and decreased baroreceptor function can all lead to increases in TPR
(Sun 2015; Webber et al., 1989). This increase in TPR and Q leads to elevations in BP in elderly
individuals (Sun, 2015; Webber et al., 1989).
Sex differences occur in BP regulation. A meta-analysis examining resting BP across the
sexes found that up to menopause, women have significantly lower BP compared to men aged
18-39 years (Sandberg & Ji, 2012). Furthermore, white non-Hispanic women aged 50-69 years
still had lower BP than men, but sex differences became less apparent for this age cohort for
non-Hispanic black and Mexican American individuals (Sandberg & Ji, 2012). Concernedly, women
over the age of 70 years had higher instances of HTN than men of the same age (Sandberg & Ji,
2012). Although the exact mechanisms of why pre-menopausal women have lower BP compared
20
cardiovascular effects in women that contribute to better endothelial function, and consequently,
reduced TPR and BP (Murphy & Kelley, 2011).
Finally, there are racial and ethnic differences in BP. In 2006, Wang and colleagues
examined the differences in ambulatory BP of European Americans and African Americans from
childhood to early adulthood and found that African American individuals had higher day-time
and night-time ambulatory mean SBP and DBP compared to European Americans (Wang et al.,
2006). Furthermore, African Americans showed significantly less night-time BP dipping than the
European Americans, which was further exasperated as the participants aged (Wang et al., 2006).
As discussed in the ABPM section above, non-dipping is associated with increased risk of CVD
(see Section 1.2.3 Blood Pressure Measurement). Findings from Wang and colleagues (2006)
would suggest that African American individuals are at increased risk of developing CVD and
other HTN-related complications, such as organ damage, compared to their European American
counterparts (Wang et al., 2006; Sega et al., 2002).
1.2.6 Hypertension Treatment and Management
Ultimately, the aim of HTN management is to lower elevated BP into ideal clinical
ranges (Pescatello et al., 2015). Currently, the Canadian Hypertension Education Plan
recommendation is for hypertensive individuals to reduce SBP <135 mmHg and DBP <85mmHg
obtained through AOBP devices (Nerenberg et al., 2018). Interestingly, the American guidelines
have made new recommendations to reduce BP below SBP <120 mmHg and DBP <80 mmHg,
showing that the recommendation in this field are continually changing (Whelton et al., 2017).
Additionally, individuals who are at high risk of developing CVD (without diabetes or stroke)
require more intensive reduction in SBP of <120 mmHg to reduce risk of CVD development
21
resting AOBP SBP to <120 mmHg and/or DBP <80 mmHg to prevent the advancement of HTN
(Rosendorff et al., 2007). Elderly patients (>80 years of age) are recommended to lower SBP
below 150 mmHg (Nerenberg et al., 2018). It is recommended to lower 24-hour ambulatory SBP
and DBP to <130/80 mmHg, daytime ambulatory SBP and DBP to <135/85 mmHg, and night
time SBP and DBP to < 120/70 mmHg, respectively (O’Brien et al., 2013).
Recently, evidence from the SPRINT research group examining the effects of reducing
BP of adults 50 years and older with SBP ranging from 130-180 mmHg to either <120 mmHg
(intensive reduction group) or <140 mmHg (traditional reduction group), found that reducing
SBP to below 120 mmHg resulted in fewer instances of fatal and nonfatal major cardiovascular
events from any causes, compared to the <140 mmHg group (SPRINT research group; 2015). A
recent meta-analysis (123 studies comprised of 613 815 patients undergoing BP reducing trials)
conducted by Ettehad and colleagues (2015) examined the effects of SBP reductions and its
relation to the cases major cardiovascular events (Ettehad et al., 2015). Researchers found that
every 10 mmHg reduction in SBP resulted in a proportional decrease in major CVD events,
coronary heart disease, stroke, heart failure, and all-cause mortality (Ettehad et al., 2015). These
studies provide support for the importance of lowering SBP in hypertensive individuals.
Currently, management of HTN is achieved through either lifestyle modification, and in
many cases, the addition of pharmacotherapies (Nerenberg et al., 2018; Whelton et al., 2017).
Adhering to proper dietary habits and engaging in regular exercise are key in the prevention and
treatment of HTN (Nerenberg et al., 2018). Other recommendations for the management of BP
are to limit alcohol consumption to <2 drinks per day, to maintain a healthy bodyweight, reduce
stress, reduce sodium consumption and to cease smoking (Nerenberg et al., 2018). Dietary
22
Stop Hypertension (DASH) diet, which emphasizes the consumption of fruits, vegetables,
low-fat dairy products, dietary fibre, whole grains, and protein from plant sources that is reduced in
saturated fat and cholesterol (Nerenberg et al., 2018). Intervention studies implementing the
DASH diet have been shown to produce reductions in both SBP and DBP (Moore et al., 2001;
Sacks et al., 2001; Nerenberg et al., 2018). An accumulation of 60 to 150 minutes of aerobic
exercise (intensity of 50-80% VO2max) a week that can be completed in 10-minute minimum
bouts, is recommended for the management of healthy BP (Nerenberg et al., 2018; Whelton et
al., 2017). Furthermore, 2-3 days of dynamic resistance exercise a week at an intensity of
60-80% of a 1 repetition max (1RM) for 8-10 exercises (2-3 sets, 8-10 repetitions per set) is
recommended as an adjunct to aerobic training (Nerenberg et al., 2018; Pescatello et al., 2015).
Moreover, 4 × 2 min (hand grip), 1 minute of rest between exercises, 30%-40% maximum
voluntary contraction (MVC) 3 times a week for 8-10 weeks is recommended in conjunction
with aerobic exercise (Whelton et al., 2017). Unfortunately, if the lifestyle modifications listed
above do not elicit adequate reductions in BP, pharmacotherapy is recommended to reduce BP to
within the target clinical range (Whelton et al., 2017). Different classes of antihypertensive drugs
can be implemented to control BP; commonly used medications are calcium channel blockers,
angiotensin converting enzyme inhibitors, thiazide diuretics and beta-blockers (Whelton et al.,
2017). Calcium channel blockers work by inhibiting calcium uptake into the vascular smooth
muscle, blocking calcium influx (which, as previously mentioned, promotes dilation), lowering
TPR and ultimately BP (GodFraind, 2006). Angiotensin converting enzyme inhibitors prevent
the conversion of angiotensin I to the vasoconstrictor angiotensin II, thus decreasing TPR and BP
(Kalyesubula et al., 2014). Thiazide diuretics prevent Na+ reabsorption within the kidney (Duarte
23
urine expulsion, thus resulting in a lowered Q, and ultimately a reduced BP (Duarte &
Cooper-DeHoff, 2010). Although fluid volume is restored within 6 weeks of starting thiazide treatment,
BP reductions are maintained, suggesting that chronic BP reductions are caused through a
different mechanism or series of mechanisms, such as improved endothelium function or
increased vasodilation, rather than solely fluid balance manipulation (Duarte & Cooper-DeHoff,
2010). Finally, beta-blockers inhibit sympathetic stimulation of the heart by preventing the
binding of NE and E, resulting in reduced HR, Q, and BP (Ram & Venkata 2010).
Although the lifestyle modifications listed above have been shown to be effective in the
management of BP, only 15% of Canadians are meeting the recommendations of daily physical
activity (Statistics Canada, 2014a), and only half of Canadians are consuming the recommended
servings of fruits and vegetables (Statistics Canada, 2012). Furthermore, 15% of hypertensive
Canadians have “uncontrolled” HTN, meaning that, although they are optimally treated, these
individuals still have resting BP values exceeding 140/90 mmHg (Statistics Canada, 2014b).
Adherence to these lifestyle modifications (i.e., exercise and diet) appears to be difficult
for some individuals due to perceived barriers such as time, energy, and for those with lower
socio-economic status. Options for safe physical activity (i.e., public recreational facilities, bike
paths, usable sidewalks, parks and social support), as well as access to healthy food and safe
drinking water, may be difficult (Middleton et al., 2013; Tarasuk et al., 2013). There is growing
concern for true “resistant” hypertensive individuals, who, despite being prescribed 3 or more
antihypertensive medications and being compliant with lifestyle modifications, still display BP
measurements above clinically recommended ranges (Calhoun et al., 2008). Poor adherence to
pharmacotherapy, due to avoidance of unwanted side effects, has also been reported as a
24
findings argue that current HTN interventions are not effective for everyone, and therefore, novel
interventions must be explored.
1.3 Exercise Training
Exercise training plays an important role in the management and treatment of HTN.
Currently, the Canadian Physical Activity Guidelines recommend 150 minutes of cumulated
moderate to vigorous aerobic physical activity a week completed in ~10 minute bouts for
individuals over the age of 18 years (Tremblay et al., 2011). Furthermore, 2 or more days a week
of bone and muscle strengthening exercise focusing on major muscle groups has been
recommended to add additional benefit (Tremblay et al., 2011). For hypertensive Canadians,
30-60 minutes of moderate-vigorous dynamic physical activity (i.e., walking, jogging, cycling or
swimming) 4-7 days a week, in addition to their routine activities of daily living, is
recommended as a means of reducing BP (Nerenberg et al., 2018). Dynamic resistance exercise
(free weight lifting, fixed weight lifting and handgrip exercise) has been recommended as an
adjunct to aerobic exercise (Nerenberg et al., 2018). Moreover, isometric resistance exercise
(IRE), specifically isometric handgrip (IHG) exercise, has also been endorsed by the American
Heart Association and the Canadian Hypertension Education Program as an alternative exercise
intervention to lower BP (Whelton et al., 2017; Nerenberg et al., 2018). Isometric exercise
involves a sustained contraction against an immovable load with little to no alteration to
muscular length (Inder et al., 2016). The most widely used IHG exercise protocol involves 4,
2-minute isometric contractions at 30% of a maximum voluntary contraction (MVC) separated by
a timed rest period, for a total duration of 12-15 minutes, completed at least 3 times a week for
8-10 weeks (Whelton et al., 2017). IHG exercise and its effects will be discussed in greater detail
25
1.3.1 Acute Effects of Aerobic Exercise on Blood Pressure
Following the initiation of a bout of aerobic exercise, SBP and HR are increased via
reduced parasympathetic outflow and increased sympathetic outflow that increases Q 6-10 fold,
and in turn increases BP (MacDonald, 2002). This elevation in BP is further exasperated by
vasoconstriction within venous vasculature to increase venous return and SV (MacDonald,
2002). Furthermore, to match metabolic demand, blood flow is increased through vasodilation of
arterioles that innervate more metabolically active tissues (i.e., skeletal muscle). In contrast,
blood is shunted away from non-essential areas (i.e., digestive organs) via arteriole
vasoconstriction. The increased vasodilation to working muscles serves as a buffer for the
increase in BP achieved via augmented Q through reductions in TPR (MacDonald, 2002). The
contracting muscles exert a substantial force onto the surrounding vasculature, and consequently,
occlude blood flow (Delaney et al., 2010). As a result, metabolites such as K+, lactic acid, H+,
and adenosine accumulate locally inside the exercising muscle tissue (Boushel, 2010). This
increase in metabolic by-products leads to the activation of the exercise pressor reflex (EPR)
(Delaney et al., 2010). The EPR sends afferent signals from the exercising muscles to the CC
which evokes increased sympathetic activity that temporarily increases HR and BP in effort to
restore perfusion of blood to working muscles (Delaney et al., 2010). The magnitude of the
elevations in BP and HR are proportional to the length of time a muscle is contracted, the force
at which the muscle is contracting, and the size of the active muscle (de Sousa et al., 2013; de
Souza Nery et al., 2010; Rezk et al., 2006; MacDougall et al., 1985). Contraction of skeletal
muscle also increases venous return of blood back to the heart and Q, resulting in increased BP
(MacDonald, 2002). The decreased TPR noted above appears to have little effect on DBP during
an acute bout of aerobic exercise, however, slight declines may occur due to blood flow
26
Following an acute bout of aerobic exercise, both SBP and DBP can be reduced, a
phenomenon known as post-exercise hypotension (PEH). Although PEH has been shown to
occur in both hypertensive and normotensive individuals, this effect seems to be more prominent
for those with higher BP (Cardoso et al., 2010). Reductions in BP can occur within a magnitude
of 2-12 mmHg over the course of 4-16 hours in HTN individuals (Cardoso et al., 2010).
Evidence suggests that these findings are less pronounced in normotensive individuals, reporting
smaller reductions of approximately 12 mmHg SBP and 5 mmHg DBP (Pardono et al., 2015).
These findings support the idea that PEH reductions in BP are proportional to BP prior to
exercise, so that higher pre-exercising BP values appear to have greater reductions following
exercise than lower pre-exercising values (Cardoso et al., 2010). The exact mechanism causing
PEH remains unknown, but reductions in TPR due to localized vasodilatory substances, as well
as decreased sympathetic outflow, have been implicated (Cardoso et al., 2010; MacDonald,
2002).
Acute aerobic exercise appears to have a lowering effect on ABPM in hypertensive
populations (Ciolac et al., 2008; Cardoso et al., 2010). Following 40 minutes of cycling at an
intensity of 60% heart rate reserve, participants experienced reductions in 24-hour ABPM of 3
mmHg SBP and 2 mmHg DBP (Ciolac et al., 2008). A meta-analysis has reported reductions as
high as 12 mmHg SBP in hypertensive individuals (Cardoso et al., 2010). Furthermore, more
evidence is required in order to determine whether these reductions are observed in normotensive
individuals following acute aerobic exercise (Cardoso et al., 2010).
1.3.2 Chronic Effects of Aerobic Exercise on Blood Pressure
The BP lowering effects of chronic aerobic exercise have been well established (Cardoso
et al., 2010). There is ample support for the efficacy of aerobic exercise intervention as an
27
intensity of exercise (30-90% of maximum oxygen consumption), length of intervention (4-52
weeks), duration of exercise 1-60 minutes, frequency (1-7 days/week) and exercise modality
(walking, running, swimming, cycling), most types of aerobic exercise seem to produce
reductions in BP (Pescatello et al., 2015; Cornelissen & Smart, 2013; Cornelissen & Fagard,
2010; Kelley et al., 2001). Manipulation of these exercise variables (i.e., higher intensity with
greater frequency) can produce more pronounced reductions in BP. (Pescatello et al., 2015;
Cornelissen & Smart, 2013; Cornelissen & Fagard, 2010; Kelley et al., 2001).
The exact mechanisms responsible for the BP lowering effects of chronic aerobic
exercise remain inconclusive. Due to the complex nature of HTN etiology, the mechanism is
likely a result of different interactive BP regulatory (i.e., neural, hormonal and local) pathways.
Current evidence suggests that reductions in BP following chronic aerobic exercise are attributed
to decreases in TPR, as opposed to changes in Q (Fagard, 2006; Cardoso et al., 2010). Moreover,
this reduction in TPR is likely attributed in part to reductions in SNS activity, which attenuates
vasoconstriction (Fagard, 2006). Furthermore, increases in circulating NO and decreases in ET-1
induce greater dilation of blood vessels, resulting in lowered TPR and ultimately BP (McLean et
al. 2015; Maeda et al., 2001).
The effects of aerobic training on ABPM requires further investigation. Chronic aerobic
training appears to produce reductions in 24-hour ABPM of approximately 8 mmHg SBP and 4
mmHg DBP in normotensive, and 3 mmHg SBP and 4 mmHg DBP for hypertensive individuals,
respectively (Cardoso et al., 2010). A recent meta-analysis examining the effects of >4 weeks of
aerobic training has shown reductions in daytime ABPM of 3/3 mmHg in normotensives and 7/5
mmHg in hypertensive individuals’ SBP and DBP, respectively (Cornelissen et al., 2013).
28
2013). The mechanism(s) behind these reductions remain equivocal, but likely reflect the local
and neurological pathways that are responsible for the reductions in resting BP.
1.3.3 Acute Effects of Dynamic Resistance Exercise on Blood Pressure
An acute bout of dynamic resistance exercise, which involves utilizing muscular
contractions of larger muscle groups to move a load placed upon that muscle (i.e., weight
training), elicits an immediate and substantial increase in both SBP and DBP of upwards of
>350/200 mmHg, respectively due to EPR (See Section 1.3.1; de Sousa et al., 2013; de Souza
Nery et al., 2010; MacDougall et al., 1985). Individuals with HTN show greater elevations in
SBP compared to normotensives when completing muscular contractions at matching intensities
(de Souza Nery et al., 2010). These differences in BP response to dynamic resistance exercise are
suggested to be the result of increased SNS activity at both rest and during exercise (de Souza
Nery et al., 2010). Additionally, alterations in the RAAS system in hypertensive individuals may
account for the greater BP attenuation (de Souza Nery et al., 2010).
With respect to PEH, an acute bout of dynamic resistance exercise can elicit reductions in
resting BP and 24-hour ABPM (Cassonatto et al., 2016). A recent meta-analysis found that a
single bout of dynamic resistance exercise reduces resting SBP by 3 mmHg and DBP by 3
mmHg at 1-hour post-exercise (Cassonatto et al., 2016). Greater reductions of 5/5 mmHg were
observed at 90 minutes post-exercise for SBP and DBP, respectively (Cassonatto et al., 2016).
Furthermore, a single bout of dynamic resistance exercise reduced 24-hour ABPM by 2/1 mmHg
of SBP and DBP, respectively (Cassonatto et al., 2016). Notably, individuals with HTN observed
greater reductions in resting BP (9 mmHg SBP and 5 mmHg DBP) compared to their
normotensive counterparts (3 mmHg SBP and 3 mmHg DBP) (Cassonatto et al., 2016). Exercise
intensity appears to influence PEH; resistance exercise completed at low intensity (40% of 1