FATIGUE PERFORMANCE OF STABILIZED AUSTENITIC STAINLESS
STEELS IN TERMS OF TEMPERATURE AND HOLD TIME EFFECTS
Sven H. Reese1, Jussi Solin2 and H. Ertugrul Karabaki3
1
E.ON Kernkraft GmbH, Tresckowstraße 5, 30457 Hannover, Germany ([email protected]) 2
VTT Technical research centre of Finland, Espoo, Finland 3
E.ON Kernkraft GmbH, Tresckowstraße 5, 30457 Hannover, Germany
ABSTRACT
Fatigue performance of austenitic stainless steel is a topic of international activities. Especially the lifetime limiting factor of environmentally assisted fatigue (EAF) is being discussed. However, EAF is only one influencing parameter in terms of transferability from laboratory conditions to plant like conditions. Additionally, the influence of elevated temperatures is incorporated in the EAF assessment as a matter of course. Other influencing parameters like hold time effects or the influence of operational like loading sequences have been focus of only few research activities.
This paper will discuss transferability from laboratory to plant like conditions for fatigue assessment. In terms of this, influencing parameters like elevated temperature, hold time effects and the influence of coolant environment will be discussed and experimental results will be presented.
INTRODUCTION
Experimental research on fatigue performance of niobium stabilized stainless steel (1.4550, X6CrNiNb1810mod) relevant for German NPP primary piping has demonstrated good long life performance while relevance and applicability of the new design curve in ASME III has to be questioned in general. Effects of temperature, environment and operational loading sequences are currently being studied.
EXPERIMENTAL SET UP
Solution annealed niobium stabilized austenitic stainless steel (X6CrNiNb1810 mod) was received as pipe, which fulfils all German KTA material requirements for primary components in LWR. Smooth round bar specimens were turned and polished from longitudinal samples of the pipe. The first 200 mm section was cut for 44 standard tensile and low cycle (LCF) specimens. Altogether four sections have been sampled for the follow-up test series. The material properties are assumed constant. Directly comparable results sampled from different sides of the circumference support this assumption. All tensile and fatigue specimens have a gauge section diameter of 8 mm.
Air tests were performed in MTS 100 kN and 250 kN rigs with precision alignment grips. Alignment of load train was adjusted with strain gauged specimens according to the ASTM E 1012-05 procedure. Strain controlled low cycle fatigue tests were performed according to the ASTM E 606 procedure. The herein reported tests were performed using triangular waveform with constant strain rates of 0.005 1/s and 0.0001 1/s.
A simplified definition of fatigue life (Nf,25) as the number of cycles to 25 % drop of peak stress from its absolute maximum was adopted to avoid practical problems with variable cyclic softening and hardening behavior of stainless steels.
capable to perform strain controlled LCF tests in simulated reactor coolant water for determination of valid design data, which is directly comparable to results in air and to ASME III and KTA design curve.
OPERATIONAL LOADING vs. LABORATORY CONDITIONS
It is worth to take a closer look on the fact that NPP primary piping components experience fatigue cycles originating from thermal transients mainly due to changes in reactor load. Most fatigue relevant events occur during start-up or shut-down of the plant or at very few and well defined additional events. During normal operation, components spend long times in operation temperature without being loaded significantly. Figure 1 shows the temperature measurement at the pressurized water reactor surge line during one year of operation, supporting this statement.
0 50 100 150 200 250 300 350
03.05.06 02.06.06 02.07.06 01.08.06 31.08.06 30.09.06 30.10.06 29.11.06 29.12.06 28.01.07 27.02.07 29.03.07 28.04.07 28.05.07
T
e
mperature in
°C
, T
e
mperature
di
fference
in
K
Time MP3: 12-o'clock-position MP3: 6-o'clock-position Stratification
Operation (11 months)
Shut down Start up
Figure 1: Temperature measurements at a PWR surge line.
At experimental investigations in the laboratory the main aim is to identify the lifetime at defined strain amplitudes. This means, that hundreds of thousands and millions of load cycles have to be accomplished in a time period as short as possible. This shall be done for hundreds of specimens in order to obtain statistically founded fatigue data for finally defining material grade specific design curves.
-0,4 -0,3 -0,2 -0,1 0 0,1 0,2 0,3 0,4
0 20 40 60 80 100
seconds
st
rai
n
[
%
]
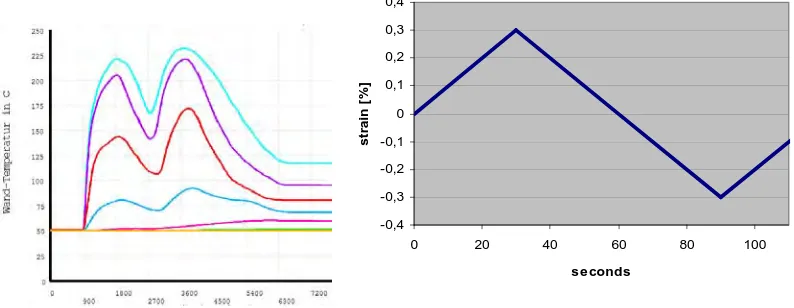
Additionally operational loading in terms of temperature fluctuations or stratifications vary significantly from laboratory transient types. Figure 2 on the left side shows realistic complex measured temperature transients at a measurement plane of a pipe section. These temperature transients induce complex strain loading scenarios in the component. In contrast, Figure 2 on the right shows a well defined ramp-type signal from laboratory investigations. Taking into account both, the number of loading cycles as well as the loading signal itself it is obvious that significant differences in terms of different loading scenarios and loading sequences exist. Main aim of all laboratory investigations is to idealize the reality conservatively. However, the risk is to obtain overly conservative results which are continuously departing from the reality resp. plant operating conditions.
In the following at least three aspects will be discussed in detail: the effect of elevated temperatures, the effect of hold periods and the effect of environmentally assisted fatigue (EAF). EAF is focus of multiple publications like e.g. PVP2013-97500 describing the influence of coolant environment to fatigue behavior as discussed within this paper. Motivated by the requirement of taking EAF into account, it is important to identify overly conservative assumptions. When taking one operational effect like the influence of coolant environment into account, additional effects like hold-time effect shall be considered as well in order to avoid overly conservative results.
Temperature Effects
In contrast to simplified assumptions behind design codes, recent research activities have identified that elevated temperatures influence lifetime of austenitic materials, especially when taking life cycles N > 105 into account. Currently only very limited data points in strain controlled HCF regime exist showing the general influence at elevated temperatures. Detailed quantification of the influence of temperatures between room temperature and elevated temperature is still necessary, especially in terms of understanding mechanistic material behavior as well as providing a statistically proven quantification. Keeping in mind that the designer already reduces allowable strain range by assuming one temperature effect, it would be better not to include another temperature effect within an EAF analysis. Current EAF analysis and experimental investigations provide a numerical correction factor between the admissible number of cycles at air / room temperature in comparison to admissible number of cycles in LWR-water / elevated temperature. Based on the fact that design curves are based on room temperature data, no differentiation between the influencing factors temperature and LWR coolant environment has been obtained by now. To be clear, the EAF combines two influencing factors: elevated temperature and coolant environment.
Based on this motivation, applying a temperature correction and taking the temperature dependent fatigue into account without proper analysis seems to lead overly conservative results in design and confusion in international debate.
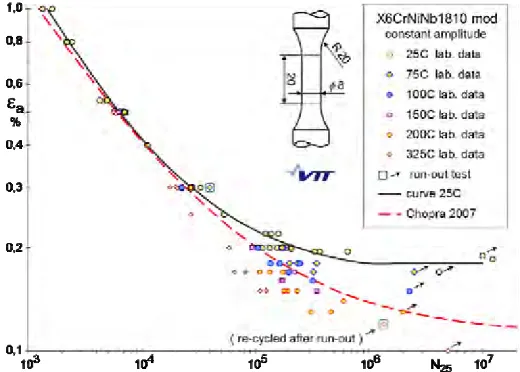
The effect of temperature on fatigue life was studied in range of 25 ºC to 325 ºC. The highest test temperature was selected to represent an upper bound in normal operation (without thermal transients). As it was soon concluded that fatigue life at 0.5 % strain amplitude is insensitive to temperature up to 325 ºC, we were focusing in long lives. Figure 3 summarizes constant amplitude fatigue lives in six temperatures and shows an effect of test temperature in range of 100 000 cycles or more.
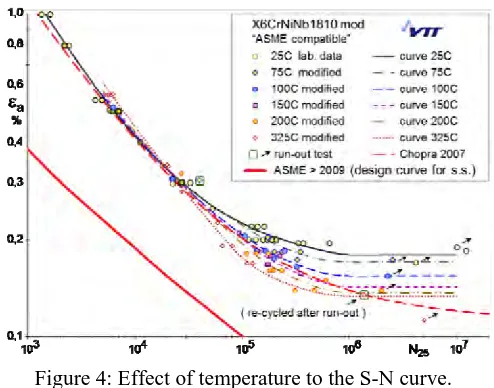
As the material becomes softer in higher temperatures, a steeper strain life curve is expected. Figure 3 shows, that results confirm a trend of steeper strain life curve in 325 ºC. This can be partially explained by the changes in plastic strain. On the other hand, ASME III design code assumes a temperature effect, which is accounted for by multiplying the stress intensity value by a ratio of elastic modulus in room and design temperatures. Therefore, the design curve and data used for determination shall represent the material behavior in room temperature only, even though design temperatures vary case by case. Furthermore, laboratory data shown the way as in Figure 3 are not directly comparable with the reference and design curves used for fatigue assessment of NPP components.
Figure 4: Effect of temperature to the S-N curve.
If the tested specimens were components in piping and we would like to predict their endurance, it would give higher strain amplitudes to compare with the design curve and a shorter life would be predicted.
Hold Time Effects
As introduced previously, hold time effects should be respected as well in terms of taking operational experiences into account. Hold time effects were simulated by fatigue tests periodically interrupted for holds in elevated temperature. The measured stress strain responses indicated time and temperature dependent hardening during such holds for all studied stainless steel grades and temperatures at or above room temperature (Figure 5). Notable extension of fatigue life was measured together with loading patterns leading to pronounced hold hardening. Similar kind of hardening has been well known as strain ageing in the content of carbon steels and it is probably also related to the more lately discussed dynamic strain ageing (DSA) in stainless steels.
200 220 240 260 280 300
N/1000 < 150; 350; 550; 1540
N/1000 < 100; 300; 500; 700 N/1000 < 50; 250; 450; 650
N/1000 < 25; 200; 400; 600
Reference: normal tests 0,2%
Sa MPa
N
104 105 106
1 10 102 103
Stress response: a= 0,2 % at RT with 15 intermediate holds for 16 h at 420 ºC.
Figure 5: Effect of holds in stress response.
Fatigue assessment based on standard fatigue data seems to underestimate fatigue endurance in service conditions, which include periods of normal operation without releavant loadings between the thermal transients. Quantity of the additional conservatism remains open, but the effect is clearly measurable already in highly accelerated simple tests and further increases, when more relevant loading patterns are used.
Another temperature dependent effect was found, when interrupting fatigue cycling for intermediate annealing in elevated temperature. Notable hardening during the holds was observed. At lower strain amplitudes this hardening was linked to improved endurance (Figure 6, PVP2011 – 57942). It can be assumed that in real plant operation there are two effects, both acting in the low strain amplitude range, one lowering the endurance limit and the other increasing it. The possible net effects still remain to be studied in detail. Additionally a beneficial temperature dependent effect was found in PVP2011 - 57942, when simulating times spent in operation temperature between fatigue cycles by interrupting fatigue cycling for intermediate annealing.
temperature as load-free. A short period in higher temperature was selected instead of operation temperature for acceleration. Annealing for 16 hours in 420 ºC was justified by a simple thermo-dynamical calculation and Arrhenius equation. Assuming the activation energies for mechanisms involved to be in range of 0.9 eV to 1.4 eV, which are for vacancy migration and diffusion of carbon respectively, the annealing would compare with 17 to 100 days at 300 ºC.
Observed improved endurances measured in interrupted tests correlates with the amount and time spent for holds. We assume that a laboratory specimen will endure the longer, the better we simulate the real NPP operation while taking long hold periods at normal operating conditions into account. Further research on realistic temperature ranges and strain sequences should confirm the anticipated beneficial effect of steady state holds on normal operation.
Average, standard Interrupted test Reference data Hot holds, 10 < n.h < 16 Coffin-Basquin, standard Coffin-Basquin, hot holds Mean curve, hot holds Mean curve, standard Chopra model [N.6909]
N
104 105 106
103 107 108
1,0 0,3 0,2 0,1 0,4 0,6 0,8 0,5 0,9 0,7 a %
Fatigue + holds for 16 h at 420 ºC compared to standard test data and Chopra model ( 2007 )
”p” = 122,86x (2xN
f)-0,625
a= 'fx (2xNf)c+ ('f/ E)x (2xNf)b
hot holds ”e” = 0,188x (2xN
f)-0,001
standard
”e” = 0,168x (2xN
f)-0,001
Average, standard Interrupted test Reference data Hot holds, 10 < n.h < 16 Coffin-Basquin, standard Coffin-Basquin, hot holds Mean curve, hot holds Mean curve, standard Chopra model [N.6909]
N
104 105 106
103 107 108
1,0 0,3 0,2 0,1 0,4 0,6 0,8 0,5 0,9 0,7 a %
Fatigue + holds for 16 h at 420 ºC compared to standard test data and Chopra model ( 2007 )
Average, standard Interrupted test Reference data Hot holds, 10 < n.h < 16 Coffin-Basquin, standard Coffin-Basquin, hot holds Mean curve, hot holds Mean curve, standard Chopra model [N.6909]
N
104 105 106
103 104 105 106 107 N 108
103 107 108
1,0 0,3 0,2 0,1 0,4 0,6 0,8 0,5 0,9 0,7 1,0 0,3 0,2 0,1 0,4 0,6 0,8 0,5 0,9 0,7 a %
Fatigue + holds for 16 h at 420 ºC compared to standard test data and Chopra model ( 2007 )
”p” = 122,86x (2xN
f)-0,625
a= 'fx (2xNf)c+ ('f/ E)x (2xNf)b
hot holds ”e” = 0,188x (2xN
f)-0,001 hot holds
”e” = 0,188x (2xN
f)-0,001
standard
”e” = 0,168x (2xN
f)-0,001 standard
”e” = 0,168x (2xN
f)-0,001
Figure 6: S-N curve model with and without holds.
Environmental Effects
According to discussions in the previous chapter taking temperature correction into account, results of slow rate fatigue tests in 325°C PWR are shown in Figure 7.
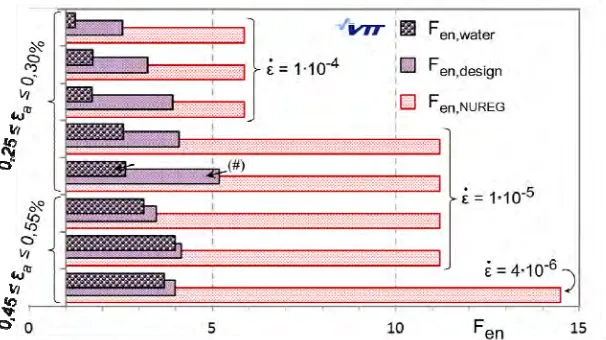
Comparison to predictions based on NUREG/CR-6909 is shown in Figure 8. Data point (#) is conservative due to test stop before load drop reached 25%. An experimental Fen value is determined by comparing the test results to the mean data curve provided in the NUREG/CR-6909 report. However, recently updated set of formulas for numerically evaluating Fen exist. General statements on the procedure itself and incorporated conservatism are being still valid.
Figure 7: Fatigue test results in PWR water taking compatible temperature correction into account.
Figure 8: Experimental results in 325C PWR coolant water in terms of Fen compared to the reference data in NUREG 6909.
As discussed, experiments have pointed out an effect of test temperature in standard laboratory tests (without water environment) and beneficial effects, when relevant cycle sequences are applied to simulate NPP operation with thermal transients and periods of normal operation. As motivated previously we divide the environmental effect into two parts, one for the test temperature (Fen,T) and one for the additional effect by hot water (Fen,water). The temperature effects (Fen,T) are determined by tests in air as introduced in the previous chapter. Respecting these facts, we divide a “real” factor for environmental effects in three parts as follows
ility transferab water
en T en ility transferab en
real F F F F F
F , , (1)
where a transferability factor represents factors needed to transfer the laboratory data into plant conditions such as the time between relevant loading transients (hold time effects), the transient itself, the loading sequence and the frequency of the loadings for instance:
,...) ,
, ,
(time transient sequence frequency
f
The environmental factor (Fen) was defined as the ratio of fatigue lives in laboratory experiments performed in room temperature air and hot water:
water T air RT en N N F , ,
(3)
This means that fatigue evaluation should be based on room temperature data only, when environmental effects are considered. But the inbuilt effects of temperature and water environment can also be separated as follows:
water T air T air T air RT water en T en en N N N N F F F , , , , , ,
(4)
In summary, the real environmental effects can be separately modelled using the following equation: ,...) , , ( , , , , frequency transient time f N N N N F F F water T air T air T air RT ility transferab en
real (5)
CONCLUSIONS
Fatigue assessment based on standard fatigue data seems to underestimate fatigue endurance in service conditions, which include periods of normal operation between the thermal transients. Investigations have shown that different environments, temperatures and hold times at operational temperatures have a significant influence on material fatigue lifetimes. This influence might reduce or increase material’s fatigue lifetime, depending on the case. Anyhow, there is a need to improve transferability of laboratory data to fatigue assessment of plant components and to reduce confusion in debates concerning applicability of international design codes.
Better performance of stabilized stainless steel can explain overly conservative Fen factors predicted by NUREG/CR-6909 resp. by the updated set of formulas. Furthermore, in order to avoid over conservatism, environmentally assisted fatigue evaluation should be based on room temperature data only.
REFERENCES
ASME Code, Section III - Rules for Construction of Nuclear Facility Components 2010, Addendum 2011 J. Solin, S. Reese, H. E. Karabaki, W. Mayinger, Environmental Fatigue Factors (NUREG/CR-6909) and
Strain Controlled Data for Stabilized Austenitic Stainless Steel (PVP2013 - 97500), Proceedings of
the ASME 2013 Pressure Vessels & Piping Division Conference, Paris, France, July 14-18, 2013 J. Solin, S. Reese, H., W. Mayinger, Long life fatigue performance of stainless steel Discussion on fatigue
design curves for stainless steels (PVP2011 - 57942), Proceedings of ASME Pressure Vessel and
Piping Division Conference, Baltimore, July 17-21, 2011, Maryland, USA,
J. Solin, S. Reese, W. Mayinger, Fatigue Performance of Stainless Steel in NPP Service Conditions
(PVP2012-78721), Proceedings of the ASME 2011 Pressure Vessels & Piping Division Conference, July 15-19, 2012, Toronto, Canada
O. K. Chopra, W. J. Shack, Effect of LWR Coolant Environments on the Fatigue Life of Reactor