ABSTRACT
YEN, CHIA-YING. Development and Testing of Enzymatic Time-Temperature Integrator Devices under Isothermal and Non-isothermal Conditions. (Under the direction of Dr. Josip Simunovic and Dr. Van-Den Truong).
A heat resistant enzyme, beta-glucosidase from Pyrococcus furiosus, was characterized for use in a Time-Temperature Integrator (TTI) device for evaluation and design of thermal treatment processes for preservation of foods and
biomaterials. The TTI device is potentially useful for assessing the minimum requirements for assurance of food safety of shelf-stable low-acid food products.
A 16 gauge thin-walled Teflon tube was used as a possible format for TTIs. A thermal come-up time of 24 seconds from ambient to 121°C was determined using a 0.254 mm diameter type-T thermocouple probe inserted in the water-filled TTI
tubing. Isothermal tests have been performed for P. furiosus beta-glucosidase TTIs under the temperature range of 121oC to 127oC. The decimal reduction time at 121 o
C (D121°C) for the first batch was 7.53 min with a temperature coefficient of enzyme inactivation (z-value) of 5.1 oC, and for the second batch the decimal reduction time at 121 oC (D121°C) was 7.7 with a z-value of 5.8oC. The studies on enzyme
inactivation kinetics indicated that P. furiosus beta-glucosidase were more heat resistant than proteolytic Clostridium botulinum spores and other organisms commonly used as surrogates for process evaluation and validation in the food industry. Additionally, a 1.8D inactivation of G. stearothermophilus and a 0.4D inactivation of beta-glucosidase would provide a treatment equivalent to a 12D
Two sizes of stainless steel T-cells (larger cell with 60 ml internal volume and a small cell of 10 ml internal volume) were used to simulate the heat treatments for sterilizing an individual serving size can and a more rapid sterilization treatment achieved by the more recent rapid and volumetric heating technologies.
Additionally, TTIs were implemented in food cans of vegetable puree subjected to heating in a horizontal batch retort. The TTIs were also inserted in 0.5-inch cubic simulated food particles fabricated from plastic polymers as carriers for three
different TTI combinations and these fabricated particles were processed in a 75 kW continuous flow microwave system that have been recently developed for thermal sterilization of low acid vegetable purees. The results illustrate that
Development and Testing of Enzymatic Time-Temperature Integrator Devices under Isothermal and Non-isothermal Conditions
by Chia-Ying Yen
A thesis submitted to the Graduate Faculty of North Carolina State University
in partial fulfillment of the requirements for the degree of
Master of Science
Food Science
Raleigh, North Carolina 2009
APPROVED BY:
_______________________________ ______________________________ Dr. Josip Simunovic Dr. Van-Den Truong
Committee Chair Committee Co-Chair
ii
DEDICATION
BIOGRAPHY
iv
ACKNOWLEDGMENTS
On the path to complete my Master of Science degree, there are many people who helped, supported, and encouraged me. I regret that I am unable to list everyone, but I would like to extend a million thanks to:
My Parents. Thanks for always supporting me along the way with whatever I did. My Brother and sister in-law. Having loving family members around Stated has done a lot of good for me. You two always gave me good suggestions and advice and always encouraged me.
Chan-Wei. Thanks for always being by my side on whatever decision I chose and helping me take care of my parents when I was trying to fulfill my dream of studying abroad.
My mentors. I would first like to thank Dr. Josip Simunovic and Dr. Van-Den Truong. My entire graduate school career would not have been possible without the incredible guidance and support of you. I would like to acknowledge the other members of my graduate committee as well: Dr. Alejandro Amezquite and Dr. Bob Kelly, for your brilliant direction and for the opportunity to work with you. Also, Dr. Ilenys Pérez-Díaz and Dr. K.P. Sandeep, for answering my questions, and being patient when I still had more and more questions.
vi
TABLE OF CONTENTS
LIST OF TABLES...ix
LIST OF FIGURES...x
CHAPTER 1 LITERATURE REVIEW 1.1. Thermal Processing of Food...2
1.1.1. A Conventional Technology: Retorting...2
1.1.1.1. History of the Canning Process………...3
1.1.1.2. Canning Operations……….………..………...4
1.1.2. An Emerging Thermal Technology for Food Preservation: Microwave Processing ………...5
1.1.2.1. History of the Microwave Process………...6
1.1.2.2. Microwave Operations……….………..…………...6
1.1.1.1. Mechanisms of Microwave Heating.………...7
1.2. Time-Temperature Integrators for Thermal Process Evaluation...9
1.2.1. The Requirement for Thermal Process Evaluation Tools...9
1.2.2. Methodologies of Integrated Time-Temperature Evaluation of Thermal Processes...10
1.1.1.1. In Situ Method……….………...10
1.2.2.2. Physical-Mathematical Method…....………...12
1.2.2.4. Application of Enzymatic Time-Temperature Integrators using
Hyperthermophiles…...15
1.2.2.4.1. Hyperthermophiles...15
1.2.2.4.2. Pyrococcus furiosus...17
1.2.2.4.2.1 Beta-glucosidase...18
1.3. Thermal Processing and Microbial Inactivation...20
1.3.1. Basic Kinetic Reaction...21
1.3.1.1. Decimal Reduction Time (DT value)……..…………...22
1.3.1.2. Thermal Death Time (TDT) Method: DT-z model.……...23
1.3.1.3. Lethal Rate……….………..………...25
1.3.1.4. Arrhenius Equation……….………...………...27
1.3.2. Microbial Inactivation………...28
1.4. List of Symbols………...30
1.5. Reference………...31
CHAPTER 2 Development and Testing of Enzymatic Time-Temperature Integrator (TTI) Implants for Design, Evaluation and Validation of Thermal Sterilization of Foods and Biomaterials 2.1. Abstract...42
2.2. Introduction...43
2.3. Materials and Methods...45
2.4. Results and Discussion...50
viii
2.6. References... 57
CHAPTER 3 Non-Isothermal Testing of TTIs under Conventional and Volumetric Heating Conditions 3.1. Abstract...75
3.2. Introduction...77
3.3. Materials and Methods...79
3.4. Results and Discussion...87
3.5. Conclusions ...98
LIST OF TABLES
CHAPTER 2
Table 1. Kinetic parameter estimates for thermal inactivation of beta-glucosidase obtained at isothermal conditions at different temperature levels...65
CHAPTER 3
Table 1. Heat resistance of spores of Geobacillus stearothermophilus...109 Table 2. Process values (Ft-T, FTTI) from the large (60ml) T-shaped pressure cells at
x
LIST OF FIGURES
CHAPTER 1
Figure 1. Vision of 2-fold axes on the tetramer structure of beta-glucosidase...38 Figure 2. The logarithm of the number of surviving microorganisms against time at a constant temperature showing DT value determination ...39 Figure 3. Semilogrithmic plot of D value versus temperature, a graphical
representation of the z value………...40
CHAPTER 2
Figure 1. Schematic of the Teflon tubing used for the TTI system...59 Figure 2. Enzymatic reaction……...60 Figure 3. Verification of linearity of absorbance versus time for beta-glucosidase activity assay...61 Figure 4. The residual enzyme activity of beta-glucosidase after using stainless steel hematostat clips and a Bunsen gas burner to heat-seal the enzyme solution into the Teflon tubing...62 Figure 5. The residual enzyme activity values of beta-glucosidase after the thermal
Figure 7. Decimal reduction times (log scale) as a function of temperature for Pyrococcus furiosus beta-glucosidase...66 Figure 8(a). Comparison of thermal resistances of Pyrococcus furiosus beta-
glucosidase enzyme and spores of a proteolytic strain of Clostridium botulinum endospores...67 Figure 8(b). Comparison of thermal resistances of Pyrococcus furiosus
beta-glucosidase enzyme spores of a proteolytic strain of Clostridium botulinum, and spores of Geobacillus stearothermophilus...68 Figure 8(c). Comparison of thermal resistances of Pyrococcus furiosus
beta-glucosidase enzyme, spores of a proteolytic strain of Clostridium botulinum, and spores of Bacillus subtilis...69 Figure 8(d). Comparison of thermal resistances of Pyrococcus furiosus
beta-glucosidase enzyme, spores of a proteolytic strain of Clostridium botulinum, and spores of Clostridium sporogenes...70 Figure 9. Comparison of thermal resistances of one D value for Pyrococcus furiosus beta-glucosidase enzyme, one D value for spores of a proteolytic strain of Clostridium botulinum, and twelve D values for spores of Clostridium botulinum...71 Figure 10. Comparison of D-values for beta-glucosidase TTIs stored under
refrigeration (4°C) - at 0, 1, and 2 month...72 Figure 11. Comparison of thermal resistances of enzyme activity of beta
xii
CHAPTER 3
Figure 8. Comparison of time temperature histories from large (60ml) T-shaped pressure cells and small (10ml) T-shaped pressure cells at 121oC for 1 minute holding time………...112 Figure 9a. Time and temperature profiles and F-value accumulation recorded by
1
1.1 – Thermal Processing of Food
Thermal processing of foods is a means of implementing high temperatures to preserve foods based on the destructive effect of heat on microorganisms. Another important function of thermal processing is inactivation of enzymes in order to avoid browning and other enzymatic degradation reactions, especially in fruits and vegetables. High temperature processing of foods also causes physical changes and chemical reactions, which have an effect on the sensory characteristics of foods. Thermal processes vary in their intensity from mild pasteurization for refrigerated foods, to intermediate temperature sterilization for high-acid foods and high temperature sterilization for shelf stable low-acid foods. The severity of the process affects both the shelf life and other quality characteristics of foods (Lewis, 2006). In all thermal processes, the main objectives are to heat and cool the food product as quickly as possible. Pasteurization and sterilization are two common thermal treatment categories used in the application of heat to foods. The food should then be cooled quickly and it may require either refrigerated storage or be stable at ambient temperature (Robertson, 2006).
1.1.1 – A Conventional Technology: Retorting
3
has been developed to produce food products, with long shelf-life at ambient temperatures (Robertson, 2006).
1.1.1.1 – History of the Canning Process
1.1.1.2 – Canning Operations
5
1.1.2 – An Emerging Thermal Technology for Food Preservation: Microwave Processing
In order to achieve commercial sterility and shelf-stability, conventional processing technologies for low acid foods often cause a degradation of color, flavor, texture, and nutrients (Wang et al., 2003). One emerging technology is microwave processing that is one of the alternative methods of thermal processing. Industry has already adapted microwave heating to precooking of bacon, tempering of frozen food, pasteurize packaged food, and supply the final drying of pasta products (Sumnu and Sahin, 2005). Microwave heating has also been investigated as a method for drying and blanching fruits, vegetables and herbs (Brewer, 2005).
1.1.2.1 – History of Microwave Process
Randall and Boot (1940) built the first continuous magnetron. They tried to develop a microwave source to power radar sets for the British military during World War ΙΙ (Reynolds, 1989). In 1945, Spencer applied for a first patent for a closed microwave oven. He worked for the Raytheon Company that received a contract to produce magnetrons in series, and also discovered the heating of various substances by the microwave energy emitted by the antenna horn (Regier and Schubert, 2001).
Starting in the late 1960s, domestic microwave oven market grew very fast and reached a peak of 12 million ovens selling in 1998. Currently, in the United States, the total sales number of microwave ovens has been at a constant level of approximately 10 million per year (Anon., 1998).
1.1.2.2 – Microwave Operation
7
applications are limited by the Federal Communications Commission to permitted frequencies of 915 MHz for industrial processing and 2450 MHz for home microwave ovens. Industry microwave processing uses the frequency 915 MHz for higher penetration depths. This frequency provides more uniform processing compared to the home microwave oven frequency 2450 MHz (Regier and Schubert, 2005).
1.1.2.3 – Mechanisms of Microwave Heating
A typical microwave oven is composed of a power supply, which converts voltage from power source to the high voltage required by the magnetron, power tube, wave guide, wave/ mode stirrer, and oven cavity. Microwaves do not posses intrinsic heat, because the heat is generated by the product itself. They are absorbed, transmitted, and reflected dependent on the dielectric properties of the materials. The interaction of the rapidly oscillating electronic field with the food material allows the microwave energy to be converted to thermal energy. This outcome is generally determined by the dielectric properties of the product.
Dielectric propertied of foods describe the ability of the product to store or dissipate energy from the electromagnetic radiation. The complex dielectric constant, ε, is defined as:
9
1.2 – Time-Temperature Integrators for Thermal Process Evaluation
1.2.1 – The Requirement for Thermal Process Evaluation Tools
assessment methodologies, so considerable effort will continue to be put into the new process evaluation methodologies (Loey et al., 1999).
1.2.2 – Methodologies of Integrated Time-Temperature Evaluation of Thermal Processes
Temperature is a crucial extrinsic factor for guaranteeing safety and quality of food products during processing and storage. Not only the rate but also the time interval of the heat-induced reactions makes a great impact on the product safety or quality attributes. The status of safety and/or quality of food products is determined by the effect of all reactions occurring in the product and integrated over the full history of the product until the moment of consumption (Loey et al., 1996). The integrated time-temperature effect of a thermal process on the destruction of the target attribute can be evaluated by in situ, physical-mathematical, or time-temperature integrator methods. Traditionally, the first two methods have been used to evaluate the thermal processes, while the time-temperature integrators are a more recent development.
1.2.2.1 – In Situ Method
11
process and no information of the destruction kinetics or any other parameter is required (Stoforos and Taoukis, 1998). Equation [2] is valid for a target attribute that follows a first-order reaction decay and equation [3] for an nth order (n≠1) decay,
zTarget
FT
ref log
X0
X
1
kref
lnX0
X [2]
zTargetF
Tref 1
kref (
X1n X 0
1n
n1 ) [3]
Where ref et T T z F arg
= process value (min),
zTarget = thermal sensitivity of the inactivation
1.2.2.2 – Physical-Mathematical Method
Another generally applicable alternative for the in situ method of thermal process evaluation is relied on determination of the temperature treatment imposed on a food. Once the kinetic parameters of the target attribute in a certain food product are known, the impact of the temperature treatment can be obtained from the known information of the temperature history to which the food product has been subjected. This alternative method is called physical-mathematical method. Based on the physical-mathematical method, the time temperature history can be provided either by direct physical measurement or by constructive computation (Hendrickx et al., 1995). While the time temperature history of the food product is combined with the knowledge of heat resistance parameters of the target attribute, mathematical modeling can be described by the following equation:
zTargetF
Tref 10
TTref
zTarget 0
t
dt [4]13
A lack of accurate estimates of the values for the model parameters restricts the constructive computation of the temperature history (Loey et al., 1996).
1.2.2.3 – Time Temperature Integrators (TTIs)
The use of Time Temperature Indicators (TTIs) as an alternative means of process evaluation can improve the limitations of the in situ process monitoring method and the physical mathematical method. TTIs offer a convenient method to measure the concentration of the substance or some other attribute before and after processing of a heat sensitive substance or device, which is, not present in the product but introduced into the food sample for simulating the thermal degradation of the substance of interest (Storos and Taoukis, 1998). Also, TTIs should be considered when temperature is the only rate-determining factor; otherwise, the estimation would result in error, as other factors that can be critically changed with time.
based on a variety of physicochemical principles (Taoukis and Labuza, 1989; Vaikousi et al, 2008).
The TTI is a measuring device that may be included in the multiple criteria decision support suite of tools in the analysis: (1) TTIs should be incorporated into the food products without disturbing the heat transfer within the food product, (2) TTIs should be inexpensive, easily and quickly prepared, easy to recover and give an accurate and user-friendly read-out, and (3) the main kinetic criterion for temperature sensitivity of the rate constant (z or Ea value) and heat inactivation kinetics of TTI is required to be similar to the monitored target attribute (Loey et al., 1998). According to these criteria, it is recognized that TTIs allow quantification of the integrated time-temperature impact on a target attribute without any information on the actual time-temperature history of the product, because the temperature dependence of the reaction rate constant of TTIs and target is equal in the relevant temperature range (Guiavar’h et al., 2002). Depending on the working principle, Time Temperature Indicator systems are classified as chemical, physicochemical, or biological systems. The chemical, physical, and biological systems are based on a chemical reaction, physical response, and change in biological activity (e.g. microorganisms, viability of their spores, enzyme activity, etc. after heating), respectively, depending on time and temperature (Hendrickx et al., 1995; Vaikousi et al., 2008).
15
thermal processes in terms of process time and reduction cost (Guiavar’h et al., 2002). Besides, the time for preparation and measurement of the TTIs is typically require only a few minutes as compared with days for microbial enumeration methods, thus providing faster results than convectional microbiological analysis. Furthermore, the transportation of Time Temperature Indicator particles from the laboratory to a factory does not require as much caution as is required with microbial spores due to the high decimal reduction times at ambient conditions and additionally, there are no issues with their outgrowth (Tucker et al., 2002).
1.2.2.4 – Application of Enzymatic Time-Temperature Integrators using Hyperthermophiles
Depending on the thermo-stability of the enzymatic Time Temperature Indicators (TTIs), they can be applied either in the commercial pasteurization and sterilization processes. In these past 10 years, studies have been conducted on studies of enzymatic TTIs, and the performance and the reliability of several developed enzymatic TTIs to monitor thermal impacts have been evaluated.
1.2.2.4.1 – Hyperthermophiles
Additionally, enzymes from hyperthermophiles provide a possibility to investigate the structure and function of proteins at high temperature environments which are above 70oC. Some of these enzymes are active at temperatures as high as 110oC and above (Vieille et al., 1996). During the past several years, scientists have developed an interest in the ability of thermally stable enzymes to be used in time temperature integrator applications. Some studies showed that hyperthermophiles were the first life-forms to have arisen on earth (Stetter, 1996). Thermus aquaticus was initially characterized as a hyperthermophile; however, their thermal tolerance limits are at 79oC which would hardly be called ―hyperthermophilic‖ today (Brock, 2001).
17
1.2.2.4.2 – Pyrococcus furiosus: the hyperthermophile used in this study
In recent years, with increasing interest in understanding the physiological systems for biochemical functions of hyperthermophilic microorganisms at extremely high temperature environments, the number of publications relating to the bacteria isolated from geothermal environments has increased (Snowden et al., 1992). Although none of the microorganisms in this group has been studied in great details, Pyrococcus furiosus, discovered by Fiala and Stetter (1986), has received the most attention (Brown et al., 1990).
Characterization of proteins from hyperthermophilic microorganisms showed that they are extremely thermo-stable and may have an optimum temperature of catalysis that exceeds the maximum growth temperature of their host. Additionally, it has been discovered that the proteins from hyperthermophilic microorganisms have high resistance to chemical denaturation and to degradation by proteases (Voorhorst et al., 1995).
1.2.2.4.2.1 – Beta-glucosidase
Since archaeon P. furiosus can utilize different polymers, P. furiosus has several types of hydrolytic enzymes (Kengen et al., 1993). Beta-glucosidase is one of the key hyperthermophilic enzymes from P. furiosus that showed high activity on β-1, 4 glucose dimmer (Lebbimk et al., 2001). For example, beta-glucosidase can be produced up to 5% of the total cell proteins of P. furiosus grown on cellobiose and the enzyme is involved in the hydrolysis of the β1-> 4 bonds linking glucose-substituted molecules (Voorhorst et al., 1995). On the other hand, beta-glucosidase of P. furiosus does not only act on β-(1, 4)-linked disaccharides but it also on β-1, 3-glycosidic polymer laminarin (Kengen et al., 1993).
19
1.3 – Thermal Processing and Microbial Inactivation
In the food industry, thermal processing includes heating, holding, and cooling periods which are associated with food safety and food quality issues (Lewis, 2006). Since food products depend on different types of thermal technologies which prevent deteriorative reactions by subjecting food products to the heat treatment that prolongs the shelf life of food products, it is required to realize the principles connected with food preservation through the application of heat treatment (Heldman and Hartel 1997). Also, the amount of heat applied to inactivate microorganisms is important for determining the appropriate processes for food products. For example, commercial sterilization is the process that leads to shelf-stable products in canned foods. These shelf-shelf-stable foods have a shelf life of up to three years under proper storage conditions (Holdsworth, 2004).
In most cases, the thermal process is designed to inactivate the most heat resistant microorganism causing spoilage in a food product or to prevent a health hazard microorganism from growth after the processing (Cousin, 1993). For this purpose it is necessary to have a quantitative knowledge of the kinetic rate of destruction and the heat resistance of microorganisms. However, the actual behavior of microorganisms to heat is extremely different and the methods of enumeration of microorganisms which survive thermal treatment are complex.
21
microbial populations present in the food system depends on the temperature. Based on temperature and time, the concept of microbial inactivation kinetics was created. The heat resistance of microbial populations at a constant temperature and the time of heat exposure which induces the death of a microbial cell or a bacterial spore vary from one individual microorganism to another (Mafart et al., 2002). Consequently, thermal processing is referred to an instance of mathematical modeling, which has been used conventionally for many years to predict the outcome of different processing treatments on the survival of microorganisms (Peleg and Cole, 1998). Currently, mathematical modeling in thermal processing still exists as a requirement for more accurate kinetic data on the thermal inactivation of microorganisms.
1.3.1 – Basic Kinetic Reactions
The most general equation representing the kinetics of microbial inactivation is given by
dN dt knN
n [5]
Where N is the number of microorganisms at any given time t in seconds, kn is the specific reaction rate in second-1, and n is the order of the reaction kinetics of microbial inactivation. Since microbial inactivation follows an exponential path, the change in the number of microorganisms should follow first order kinetics (n = 1),
dN
By integrating from the number of microorganisms at time zero (N0) to a number of microorganisms (N) at any given time t is described by
ln N
N0
kt [7]
which can also be described as
log N
N0
kt
2.303 [8]
The initial study of inactivation kinetic models on microorganisms can be traced back as far as early 20th century, and currently the principle of thermal inactivation kinetics is still useful in the food industry (Peleg and Cole, 1998). Now, the new generalized mathematic model used in food thermal processes is DT and z values which were designed by Bigelow, Ball and Stumbo (Stumbo, 1973).
1.3.1.1 – Decimal Reduction Time (DT-value)
23
on this survivor curve, logarithmic relationship between microbial inactivation and heating time results in equation [9],
log N
N0 t
DT
[9]
As shown in equation [9], N is the residual number of surviving microorganisms at a given temperature after a certain time interval, N0 is the initial microbial population, t is the time and DT is the decimal reduction time at a constant temperature (Holdsworth, 2004). This survivor curve is also called the thermal death curve and was originally established by Esty and Meyer (1992). The correlation between equation [8] and equation [9] is given below
DT 2.303
60k [10]
DT value has been determined for different types of vegetative microorganisms, bacterial spore populations, food spoilage microorganisms, and microbial pathogens. The larger the DT value, the higher thermal resistance of the microbial populations would be at the constant temperature (Heldman and Hartel, 1997).
1.3.1.2 – Thermal Death Time (TDT) Method: DT-z model
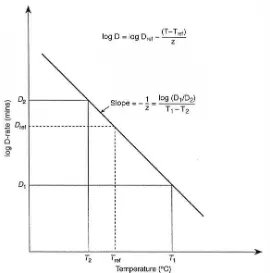
temperature. Temperature sensitivity of DT values on the vertical logarithmic scale is plotted versus different temperatures on the standard horizontal coordinate, and then a linear relationship is expressed as a thermal death time curve (Ramaswamy and Marcotte, 2006). Most often, the thermal death time curve for the microbial population leads to the definition of thermal resistance constant, z value which is specified by the negative reciprocal slope of the thermal death time curve (Heldman and Hartel, 1997).
The terms of z value can be expressed as the influence of temperature on microbial population inactivation rates using the following equation,
log DT
Dref
TTref
z [11]
Where DT is the decimal reduction time at various temperature and Dref is the decimal reduction time at the reference temperature Tref. Thermal resistance constant (z value) can be determined from D vales at different temperatures which plotted on a semilog graph (Figure 1.3). Statistically, it was found to be good fit and
the slope of the line was
1
z where z is the temperature change necessary to
25
of temperature will result in a large change of decimal reduction time (Lewis, 2006). The z value is important in determining the F value of a process.
1.3.1.3 – Lethal Rate
Equation [11] leads to an important concept, the lethal rate L. The lethal rate L is a measure of the rate of inactivation for the microorganism at any given temperature,
L Dref
DT
[12]
The lethal rate curve is a plot of lethal rate on the vertical coordinate versus time. The lethal rates at different times and temperature rise or fall can be calculated. For a constant temperature T, the FT value is the area under the curve during the processing time, and it means that FT value is equal to a lethal rate which is a function of temperature.
FT L(T)t [13]
However, since the process temperatures vary during the heating, holding, or cooling periods for the whole thermal processing treatment, so it is required to integrate the achieved lethal rates at various temperatures (Holdsworth and Simpson, 2007). The basic equation for calculation of FT values for process is
FT L
0
t
The concept of FT value is the equivalent time, in minutes, at a specific temperature which generates a sterilization effect relative to a product at a reference temperature and specific z value (Shirtz, 1999). As has been explained, the thermal death time curve is a straight line on a semilog plot; additionally, it is important to identify the slope and the distinct point on the curve (Teixeira, 2005). Therefore, the ratio of the DT value at a specific temperature, T, to the Dref value at the reference temperature Tref can be described by the equation,
FT 10
TTref
z
0
t
dt [15]FT value is the method which is widely used by the canning industry in the US and UK for determining the efficiency of sterilization or pasteurization processes. In sterilization processes, normally the reference temperature is 121.1oC (250oF) undergoing an equivalent heating time in minutes. Thus, FT value is delivered by a process as a result of the time-temperature history experienced by the product during the process (Ramaswamy and Marcotte, 2006). FT value at a reference temperature of 121.1oC (or 250oF) and z value of 10 oC ( or 18oF) is commonly referred to the F0 value and is thus evaluated as shown below:
F0 10
T121.1
10
0
t
dt 10T250 18
0
t
dt [16]27
combinations of time and temperature can yield an F0 value of 3 minutes. This has been used in the food industry for over 50 years as the method to determine appropriately safe a processes for low acid foods. The achievement of a safe process is the main objective of production operation management to the avoid public health hazard.
1.3.1.4 – Arrhenius Equation
Arrhenius Equation is an alternative way for describing the change of microbial inactivation rate with temperature. The equation for Arrhenius kinetic is based on the temperature dependency of the specific reaction rate constant
kT Ae
Ea
RT [17] where kT is the specific reaction rate (second-1) at the absolute temperature T, A is the pre-exponential factor, Ea is the activation energy (kJ/ mole), and R is the universal gas constant (8.314 J/ Kg-mole-K). For heat resistant bacterial spores, A is extremely large (1030 to 1060 s-1) and Ea can be up to 500 kJ/ mole. The activation energy is the minimum energy which molecules must have for the reaction to take place (Ahmed and Shivhare, 2005). According to equation [17], a specific reaction rate at reference Tref designated kref:
kT Ae
Ea
RT [18]
The exponential term
e Ea R ( 1 T 1 Tref )
thermal death time model [11] are referred to the microbial inactivation kinetic data over the same temperature range, a connection between the two coefficients (the thermal resistance constant z and the activation energy Ea) is evident (IFT, 2000). By comparison of [11] and [18], the following relationship can be found
Ea
2.303RTTref
z [19]
For Clostridium botulinum spores, A = 2 x 1060 s-1 and Ea = 310.11 kJ/ mole-K for the range of temperatures from 100 oC to 150 oC.
1.3.2 – Microbial Inactivation
Generally, bacteria are divided into families and genera. Commonly, Bacilli and Clostridia are extremely resistant to thermal processing (Holdsworth and Simpson, 2008). During thermal processing, spores may be inactivated, sublethally injured, or uninjured. The exponential death rate results in the calculations for heating inactivation or injury of spores that were used in thermal processing in the food industry (Stumbo, 1973).
29
Marcotte, 2006). According to the U.S. Food and Drug Administration (FDA) regulations, C. botulinum is most often associated with foods that are temperature abused in storage or canned low acid food. Traditionally, low acid foods in sterilization process, C. botulinum spores have been the inactivation target at 121.1oC (250oF), and the D121.1 of 0.2 minutes and z value of 10oC use in process calculation (Peleg, 2004).
1.4 –List of Symbols
A Pre-exponential Factor (sec-1) D Thermal Death Time (sec) Ea Activation Energy (kJ/ mole) F Sterilization Value (sec) j Imaginary Part of Permittivity k Specific Reaction Rate (sec-1) L Lethal Rate
N The Number of Microorganisms
R Universal Gas Constant (J/ Kg-mole-K) T Temperature (oC)
t Time (sec)
Tref Reference Temperature (oC) z Thermal Resistance Constant (oC) Greek Letters
ε Permittivity (F/m) ε’
31
1.5 –References
Anon. 1998. Microwave Oven Sales Comparison. Microwave World. 19(2):8.
Ahmed,J., Shivhare, U.S. 2005. Thermal processing: New technologies and quality issues. Thermal Processing of Vegetables, D.W. Sun (ed.). CRC Press, Florida.
Á vila, I.M.L.B., & Silva, C.L.M. 1999. Modelling Kinetics of Thermal Degradation of Colour in Peach Puree. Journal of Food Engineering. 39: 161–166.
Bakalis, S., Cox, P.W., Mehauden, K., Fryer, P.J. 2006. Evaluating the Applicability of Time Temperature Integrators as Process Exploration and Validation Tools. In: Computer Aided Methods in Optimal Design and Operations, I.D.L. Bogle and J. Žilinskas (Eds), World Scientific, New Jersey: 187-196.
Barlow, B. 1912. A Spoilage of Canned Corn due to a Thermophilic Bacterium. Thesis for M.S. Degree, University of Illinois, Urbana. Cited by Tanner, F.W., 1924.
Bauer, M.W., Bylina, E.J., Swanson, R.V., Kelly, R.KM. 1996. Comparison of a ß -Glycosidase and ß -Mannosidase from the Hyperthermophilic Archaeon Pyrococcus furiosus. The Journal of Biological Chemistry. 271(27): 23749-23755.
Brewer, M. 2005. Microwave Processing: Nutritional and Sensory Quality. In: The Microwave Processing of Foods, H. Schubert and M. Regier (Eds.), Woodhead Publishing Ltd, Cambridge: .76-101.
Brock, T.D. 2001. Thermophiles The Origins of Research on Thermophiles. In: Biodiversity, Ecology, and Evolution, A.L. Reysenbach, M. Voytek, and R. Mancinelli (Eds.). Springer, New York: 1-9.
Brown, S.H., Costantino, H.R., Kelly, R.M. 1990. Characterization of Amylolytic Enzyme Activities Associated with the Hyperthermophilic Archaebacterium Pyrococcus furiosus. Applied and Environment Microbiology. 56: 1958-1991.
Bruins, M.E., Hellemond, E.W.V, Janssen, E.M., Boom, R.M. 2003. Maillard
Cameron, N.S., Leonard, S.J., Barrett, E.L. 1980. Effect of Moderately Acidic pH on Heat Resistance of Clustridium Sporogenes Spores in Phosphate Buffer and in Buffered Pea Puree. Applied and Environmental Microbiology. 39(5):943-949.
Campden, N.S.M. 2001. Retort Technology. In: Thermal Technologies in Food Processing, P. Richardson (Ed.), Taylor and Francis, Boca Raton, Florida: 7-28.
Costantino, H.R., Brown, S.H., Kelly, R.M. 1990. Purification and Characterization of an Alpha-Glucosidase from a hyperthermophilic archaebacterium, Pyrococcus furiosus, Exhibiting a Temperature Optimum of 105 to 115 degree C. Journal of Bacteriology. 127(7): 3654-3660.
Cousin, M.A. 1993. Microbiology of Aseptic Processing and Packaging. In: Principles of Aseptic Processing and Packaging, J.V. Chambers, P.E. Nelson (Eds). Food Processors Institute, Washington, D.C.: 47-86.
Esty, J.R. and Meyer, K.F. 1922. The Heat Resistance of Spores of Bacillus botulinus and Allied Anaerobes. ΧΙ. January of Food Microbiology. 12: 225-233.
Feeherry, F.E., Munsey, D.T., Rowley, D.B.1987. Thermal Inactivation and Injury of Bacillus Stearothermophilus spores. Applied and Environmental Microbiology. 53(2):365-370.
Fiala, G., Stetter, K.O. 1986. Pyrococcus furiosus sp. Nov. Represents a Novel Genus of Marine Hetertrophic Archaebacteria Growing Optimally at 100oC. Archives of Microbiology. 145: 56-61.
Guiavarc’h, Y.P., Dintwa, E., Loey, A.V., Zuber, F.T., Hendrickx, M.E. 2002. Validation and Use of an Enzymic Time-Temerature Integrator to Monitor Thermal Impacts Inside a Solid/Liquid Model Food. Biotechnology Progress. 18: 1087-1094.
Guiavarc’h, Y., Loey, A.V., Zuber, F., Hendrickz, M. 2004. Development
Characterization and Use of a High-Performance Enzymatic Time-Temperature Integrator for the Control of Sterilization Process’ Impacts. Biotechnology and Bioengineering. 88: 15-25.
33
Hendrickx, M., Maesmans, G., Corft, S.D., Noronha, J., Loey, A.V., Tobback, P. 1995. Evaluation of the Integrated Time-Temperature Effect in Thermal Processing of Foods. Critical Reviews in Food Science and Nutrition, 35(3): 231-262.
Holdsworth, S.D. 1996. Aseptic Processing and Packaging of Food Products. Blackie Academic & Professional, London.
Holdsworth, S.D. 2004. Optimising the safety and Quality of thermally Processed Packaged Foods. In: Improving the Thermal Processing of Foods, P. Richardson (Ed). Woodhead Publishing Itd. Great Abington, Cambridge: 365-384.
Holdsworth, S.D. and Simpson, R. 2007. Thermal Processing of Packaged Foods. Springer, New York.
IFT (Institute of Food Technologists) 2000. Kinetics of Microbial Inactivation for Alternative Food Processing Technologies. Journal of Food Science supplement. g
Kamrat, T. and Nidetzky, B. 2007. Entrapment in E. coli improves the Operational Stability of Recombinant ß -glycosidase Cel from Pyrococcus furiosus and Facilitates Biocatalyst Recovery. 2007. 129: 69-76.
Karel, M. and Lund, D.B. 2003. Physical Principles of Food Preservation. CRC Press. Boca Raton, Florida.
Kaper, T., Lebbink, J.H.G., Pouwel, J., Kopp, J., Schulz, G.E., van der Oost, J., de Vos, W.M. 2000. Comparative Structural Anaysis and Substrate Specificity
Engineering of the Hyperthermostable ß -Glucisidase CelB from o furisus. Biochemistry. 39(17): 4963-4970.
Kengen, S.W.M., Luesink, E.J., Stams, J.M., Zehnder, J.B. 1993. Purification and Characterization of an Extremely Thermostable ß -glucosidase from the
hperthermophilic archaeon Pyrococcus furiosus. European Journal of Biochemistry. 213: 305-312.
Lebbink, J.H., Kaper, T., Kengen, S.W., van der Oost, J., de Vos W.M. 2001. ß -glucosidase CelB from Pyrococcus furiosus: Production by Escherichia coli, Purification, and in Vitro Evolution. Methods in Enzymology. 330:364-379.
Loey, A.V., Hendrickx, M., Cordt, S.D., Haentjen, T., Tobback, P. 1996. Quantitative Evaluation of Thermal Processes Using Time-Temperature Integrators. Trends in Food Science & Technology. 7(1): 16-26.
Loey, A.V., Haentjens, T., Hendrickx, M. 1998. The Potential Role of
Time-Temperature Integrators for Process Impact Evaluation in the Cook-Chill Chain. In: Sous Vide and Cook-Chill Processing for the Food Industry, S. Ghazala (Ed.). Springer, New York: 89-110.
Loey, A.V., Haentjens, T., Smout, C., Hendrickx, M.E. 1999. Enzymic Time-Temperature Integrators for the Quantification of Thermal Processes in Terms of Food Safety. In: Processing Foods: Quality Optimization and Process Assessment, J.C. Oliveira (Ed.). CRC Press. Boca Raton, Florida: 13-40.
Loey, A.V., Guiavarc’h, W.C., Hendrickx, M. 2004. The Use of Time-Temperature Integrators (TTIs) to Valuate Thermal Processes. In: Improving the Thermal
Processing of Foods, P. Richardson (Ed). Woodhead Publishing Itd. Great Abington, Cambridge: 365-384.
Ma, K., Schicho, R.N., Kelly, R.M., Adams, W.W. 1993. Hydrogenase of the Hyperthermophile Pyrococcus furiosus is an Elemental Sulfur Reductase or Sulfhydrogenase: Evidence for a Sulfur-Reducing Hydrogenase Ancestor. Proceedings of the National Academy of Sciences. 90: 5341-5344.
Mafart, P., Couvert, O., Gaillard, S., Leguerinel, I. On Calculating Sterility in Thermal Preservation Methods: Application of the Weibull Frequency Distribution Model. International Journal of Food Microbiology. 72: 107-113.
Martínez, A., Rodrigo, D., Fernández, P.S., Ocio, M.J. 2006. Time-Temperature Integrators for Thermal Process Evaluation. In: Thermal Food Processing, D.W. Sun (Ed), CRC Press. Boca Raton, Florida: 597-620.
Peleg, M. and Cole, M.B. 1998. Reinterpretation of Microbial Survival Curve. Critical Reviews in Food Science. 38(5): 353-380.
Peleg, M. 2004. Analyzing the Effectiveness of Microbial Inactivation in Thermal Processing. In: Improving the Thermal Processing of Foods, P. Richardson (Ed). Woodhead Publishing Itd. Great Abington, Cambridge: 411-426.
35
Ramaswamy, H.S. and Marcotte, M. Food Processing: Principle and Applications. CRC Press. Boca Raton, Florida.
Regier, M. and Schubert, H. 2001. Retort Technology. In: Thermal Technologies in Food Processing, P. Richardson (Ed.), Taylor and Francis, Boca Raton, Florida: 178-207.
Reynolds, L. 1989. The History of the Microwave Oven. Microwave World. 10(5): 11-15.
Robb, F.T., Maeder, L., Brown, J.R., Diruggiero, J., Stump, M.D., Yen, R.K., Weiss, R.B., Dunn, D.M. 2001. Genomic Sequence of Hyperthermophile, Pyrococcus
furiosus: Implications for Physiology and Enzymology. Methods in Enzymology. 330: 134-157.
Robertson, G.L. 1992. Food Packaging: Principles and Practice. CRC Press. Boca Raton, Florida.
Russell, H.F. 1895. Gaseous Fermentation in the Canning Industry. Wisconsin Agricultural Experiment Station, 12th Annual Report: 227-231.
Scaman, C.H. and Durance, T.D. 2005. Combined Microwave Vacuum-Dring. In: Emerging Technologies for Food Processing, D.W. Sun (Ed.). Elsevier Academic Press. Amsterdam: 419-444.
Shirtz, J. 1999. Validation of Pharmaceutical Processes: Sterile Products. F, D and z Values, F.J. Carleton and J.P. Agalloco (eds.). Informa HealthCare. New York: 381-412.
Singh, R.P. and Heldman, D.R. 1993. Introduction to Food Engineering. Academic Press, Inc., New York.
Snowden, L.J., Blumentals, I.I., Kelly, R.M. 1992. Regulation of Proteolytic Activity in the Hyperthermophile Pyrococcus furiosus. Applied and Environment Microbiology. 58: 1134-1141.
Stoforos, N. and Taoukis, P.S. 1998. A Theoretical Procedure for Using Multiple Response Time-Temperature Integrators for the Design and Evaluation of Thermal Processes. Food Control. 9(5): 279-287.
Stumbo, C.R. 1973. Thermobacteriology in Food Processing. Academic Press, Inc., New York.
Sumnu, G. and Sahin, S. 2005. Recent Developments in Microwave Heating. In: Emerging Technologies for Food Processing, D.W. Sun (ed.), Elsevier Academic Press. Amsterdam: 419-444.
Taoukis, P.S. and Labuza, T.P. 1989. Applicability of Time-Temperature Indicators as Shelf Life Monitors of Food Products. Journal of Food Science. 54(4): 783-788.
Teixeira, A.A. 2006. Simulating Thermal Food Processes Using Deterministic Models. In: Thermal Food Processing, D.W. Sun (Ed), CRC Press. Boca Raton, Florida: 73-106.
Tucker, G.S., Lambourne, T., Adams, J.B., Lach, A. 2002. Application of a Biochemical Time-Temperature Integrator to Estimate Pasteurization Values in Continuous Food Processes. Innovative Food Science & Emerging Technologies. 3: 165-174.
Wang, Y., Wig, T., Tang, J., Hallberg, L. 2003. Dielectric Properties of Foods Relevant to RF and Microwave Pasteurization and Sterilization. Journal of Food Engineering. 57: 257-268.
Vaikousi, H., Biliaderis, C.G., Koutsoumanis, K.P. 2008. Development of a Microbial Time/Temperature Indicator Prototype for Monitoring the Microbiological Quality of Chilled Foods. Applied and Environmental Microbiology. 74: 3242-3250.
Vieille, C.D., Burdette, D.C., Zeikus, J.G. 1996. Thermozymes. Biotechnology Annual Review. 2: 1-83.
37
Voorhorst, W.G.B., Eggen, R.I.L., Luesink, E.J., deVos, W.M. 1995. Characterization of the celB Gene Coding for ß -Glucosidase from Hyperthermophilic Archaeon
39
41
CHAPTER 2
2.1 – Abstract
A heat resistant enzyme (beta-glucosidase) from the hyperthermophilic archaeon Pyrococcus furiosus has been characterized and deemed suitable as an indicator to assess the minimum requirements for assurance of safety of low-acid heat-preserved foods. This exo-enzyme not only shows extreme stability at high temperatures, but it can also be assayed for residual activity by a rapid and simple colorimetric test that requires a low-cost substrate (4-nitrophenyl-beta-D-glucoside). In this study, we present the thermal characterization of beta-glucosidase and its application in the development of Time-Temperature Integrators (TTIs) for validation of in-pack sterilization processes.
TTIs have to be physically small in order to enable precise placement and rapid thermal come-up time. The kinetic parameters describing the heat resistance characteristics of P. furiosus beta-glucosidase were compared against those of proteolytic Clostridium botulinum spores and other organisms commonly used as surrogates for process evaluation and validation in the food industry. Since the heat resistance of P. furiosus beta-glucosidase appears to be higher than any
43
2.2 – Introduction
Quantification of the impact of thermal processes is very important to ensure safe food products. Manufacturers of heat treated products must validate that their products and processes are safe. Heat penetration studies and microbiological assays are commonly used to determine adequate thermal process that will assure the safeness of a given food product (Stumbo, 1948). Validation is usually carried out with thermocouples and data loggers or computer-based data acquisitions and analysis, but this can be difficult for products with freely moving particulates or for some packaging types. If temperature probes cannot be used, alternative approaches commonly used to validate the microbiological process safety are microbiological methods, simulated trials or mathematical models. However, the microbiological assays are time-consuming and expensive. To try to address these issues, the use of time temperature integrators (TTIs) has been proposed. A TTI can be defined as ―a small measuring device that shows a time-temperature dependent, easily, accurately and precisely measurable irreversible change that mimics the change of a target attribute when exposed to the same conditions” (Van
45
of enzymes is easily measured, and finally, their thermo stability allows their use at pasteurization and sterilization temperatures (Van Loey et al., 1997a). Recent studies have indicated that the archaeon Pyrococcus furiosus, a hyperthermophilic organism, has an optimum growth temperature above 85°C. One of the key hyperthermophilic enzymes from Pyrococcus furiosus is beta-glucosidase which shows high activity on the β-1, 4 glucose dimmer (Lebbink et al., 2001). Beta-glucosidase has a thermal inactivation half-life of 85 hours at 100°C and is much more thermo-stable than other glycosyl hydrolases (Bauer and Kelly, 1998). Beta-glucosidase not only shows extreme stability at high temperatures but this enzyme can also react with 4-nitrophenyl-β-D-glucoside to produce a yellow color, and may then provide a convenient bio-indicator for rapid implementation in food processing applications. In this study beta-glucosidase in buffer medium (pH 8.8) was used to develop a shelf-stable TTI to monitor safety of sterilization processes, and the detailed kinetic and inactivation mechanism data on beta-glucosidase were determined under isothermal conditions.
2.3 –Materials and Methods
Purification of Pyrococcus furiosus beta-glucosidase
The CelB genomic DNA (PF0073) encodes beta-glucosidase from P. furiosus. All purification steps were carried out at room temperature using a fast protein liquid chromatography (FPLC) system (Bio-Rad Laboratories, Hercules, CA).
47
FPLC system is a high-performance liquid chromatography system for protein purification. The heat-treated supernatant was loaded onto a column of anion exchange, which had been previously equilibrated with two different buffers. Fractions containing beta-glucosidase activity were pooled, equilibrated with 50mM Tris pH8.8, 20% glycerol. This resulted in pure beta-glucosidase, as was confirmed by SDS-PAGE electrophoresis and was stored at 4°C (Bauer and Kelly, 1998).
Preparation of the Time-Temperature Integrator
Time-Temperature Integrator enclosures were fabricated by adding approximately 15 μL of the initial enzyme solution into 16 gauge thin-walled Teflon tubing (Zeus Industrial Products Inc., Raritan, NJ). The Teflon tubes were heat-sealed using stainless steel hemostat clips and a Bunsen gas burner (Figure 2.1). Two hemostat clips serve as heat sinks during heat-sealing in order to conduct the heat away from the contained sample and avoid boiling, leakage and inactivation of enzymes. The enzyme solution to be used in the TTIs was composed of 430 ng of beta-glucosidase per μl of 50mM Tris pH 8.8 and 20% glycerol solution, to a final pH of 8.8, and the Time-Temperature Integrators were stored at 4oC until they were used.
Enzyme Activity Assay
was read at 405 nm using a a NanoDrop ND-1000 Spectrophotometer (Thermo Fisher Scientific Inc., Wilminton, DE). A beta-glucosidase concentration of 20 ng per μl was determined to be the maximum concentration for the described procedure. An aliquote of 10 μl of the purified enzyme solution was diluted with 205 μl of 50 mM Tris buffer, pH 8.8, containing 20% glycerol.
For beta-glucosidase enzyme assays of the processed TTIs, each tube was opened by cutting off one end, extracting 10 μl of the contained enzyme solution into polypropylene sample vials and diluting with 205 μl of 50 mM Tris buffer, pH 8.8, containing 20% glycerol. Three replicated aliquots of 10 μl were taken from each sample vial, pipetted into three wells of a 96-well PCR plate (Bio-Rad, Hercules, CA) and placed on ice. When the plate was on ice, 100 μL of 1.1x assay reagent (2.2 mM pNP-β-D-glucoside in 55 mM sodium acetate, pH 5.5) was added to each well. The samples were then heated in the PCR detection system at 60oC for 5 minutes. Upon completion, 110μL of 1M sodium carbonate for adjusting pH to 10 to stop the reaction, and the absorbance was read at 405nm. The absorbance readings at 405 nm as a result of p-nitrophenol production were performed by following changes in UV-Vis absorbance values (Figure 2.2) of 1.5 μL samples with 0.1 cm path length in a NanoDrop ND-1000 Spectrophotometer.
Isothermal Calibration of the TTI System
49
predetermined heating times. After withdrawing from the oil bath samples were submerged immediately in ice to interrupt the thermal inactivation. Changes in beta-glucosidase activity (E) were determined following the spectrophotometric describe above. Under isothermal conditions, a first-order reaction can be written as equation (1) or in the thermal inactivation time terminology as equation (2)
kt E
E
0
ln (1)
T D t E E 0
log (2)
where DT is the decimal reduction time (time for one log reduction of the response at a given temperature).
To describe the heat inactivation kinetics of first order reactions, D and z values are commonly used. The decimal reduction time, D-value (min), is defined as the time for one log reduction of the response at a given temperature. The temperature dependence of the D-value is given by the z-value, which is the temperature increase necessary to achieve one log reduction in the D-value (3)
z T T ref refD
D
10
(3)where Dref is the decimal reduction time at reference temperature, Tref, T the
in equation (3), thermal sensitivity of the decimal reduction time D, expressed by the z-value (°C), was estimated by linear regression of log(D) versus temperature.
Effect of Storage Temperatures on Enzyme Activity
The enzymatic TTIs were stored at ambient temperature and incubation temperature of 37oC for two weeks. Additionally, D121°C-values of enzymatic TTI solutions stored at refrigerated temperature (4oC) were analyzed at 0, 1, and 2 months of storage. Enzyme activity determination was carried out by cutting off one end of the TTI tubes, withdrawing the enzyme from the tube, and assaying as described above.
2.4 –Results and Discussion Beta-glucosidase Activity Assay
51
The optimum temperature for obtaining the maximum activity was at 60oC. The enzyme activity assay of beta-glucosidase was verified for linearity of absorbance readings as a function of time. When the samples were heated at 60oC, activity values were determined by dividing the absorbance reading at 5 minutes from the start of reaction with substrate. As reaction occurs very fast, verification of linear behavior was necessary. Data shown in Figure 2.3 illustrates the results of this verification, supporting the validity of the selection of this incubation period.
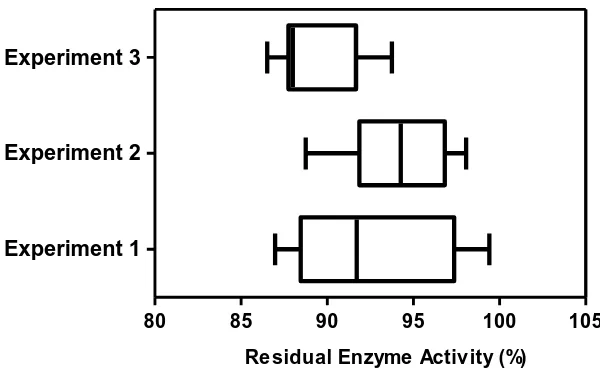
Effect of TTIs Fabrication on Beta-glucosidase Activity
TTIs used in the experiments has been determined using a 0.01 inch diameter type-T thermocouple probe inserted within the cavity of the thin-wall small diameter Teflon tube containing water with heat-sealed top and bottom. The residual enzyme activities after 24 seconds are shown in Figure 2.5. The enzyme activity of beta-glucosidase after the thermal come-up time was inactivated around 20% from initial enzyme activity. In other words, beta-glucosidase TTIs did not show a major reduction in activity after the thermal come-up time of 24 seconds at sterilization reference temperature. Each TTI is an elongated hollow tube filled with beta-glucosidase enzyme solution which can be conveniently used under a variety of thermal processing conditions, and it can be implemented not only in conventional heating technologies but also in advanced thermal processes such as microwave sterilization and continuous-flow microwave sterilization.
Enzyme Inactivation Kinetics under Isothermal Conditions
53
as the negative inverse of the slope of the regression line. The coefficient of determination of the linear regression of log(E/E0) versus time was in a range of 0.92 to 0.99. As illustrated in Figure 2.7, a z value of 6.92 oC was calculated as the inverse negative of the slope of the regression line between the log D values at 105, 110, 115, 121, 125, and 127 oC and treatment temperature values. This graph of the logD values against temperatures was used to determine the z value, which is a measure of how sensitive the D values are to temperature change (Tucker et al, 2002). The z value for most heat resistant spores is around 10 oC, but for vegetative bacteria it is much lower, between 4 to 8 oC. In contrast to microbial inactivation, chemical reaction rates have higher z values (20 to 40 oC) than microbial inactivation (Lewis, 2006). A low z value suggests that a given increase in temperature of exposure for the microbial population results in a big change in D values and means that the reaction in question is very sensitive to temperature differences (Heldman and Hartel, 1997).
one of the main safety concerns for low acid food products (Holdsworth, 1992). Stumbo and other coworkers (1950) studied the heat resistance of Clostridium botulinum spores in a phosphate buffer at pH 7 over the temperature range of 104 and 127°C and found that the D121°C was 0.13 min and the z value was 9°C. Figures 2.8 a-d show relevant comparisons of thermal resistance of the Pyrococcus furiosus beta-glucosidase TTIs with both Clostridium botulinum spores and other various surrogate organisms. The D121°C value of beta-glucosidase is sixty times higher than the D121°C of Clostridium botulinum. Furthermore, D values over a temperature range of 104 to 127°C were higher than those of the alternative surrogate microorganisms. Therefore, beta-glucosidase TTI sensors could potentially serve as an excellent device in process design, evaluation and validation tool, since their thermal resistance appears to be higher than any comparable surrogate organism under the common range of sterilization-level temperatures from 100 to 130°C.
55
be inferred that the process has been equivalent to or greater in lethality than the standard botulinum cook of 12D.
Effect on Enzyme Activity during Storage under Various Temperatures
use in estimation or validation of a thermal process. It is often necessary to transport TTIs to and from factory environments, sometimes in different countries. We recommend to keep beta-glucosidase based TTIs at refrigeration temperature during handing and storage in order to minimize the potential for microbial growth within the enzyme solutions.
2.5 –Conclusions
57
2.6 –References
Asams J.B. and Langley F.M. 1998. Nitrophenyl glucoside hydrolsis as a potential time-temperature integrator reaction. Food Chemistry. 62: 65-68.
Bauer M.W. and Kelly R.M. 1998. The family 1 beta-glucosidases from P. furiosus and A. faecalis share a common catalytic mechanism. Biochemistry. 37(49):17170-17178.
Cameron MS, Leonard SJ, Barrett EL. 1980. Effect of moderately acidic pH on heat resistance of Clostridium sporogenes spores in phosphate buffer and in Buffered Pea Puree. Applied and Environmental Microbiology. 39(5): 943-949.
Feeherry F.E., Munsey D.T., and Rowlwy D.B. 1987. Thermal inactivation and injury of Geobacillus stearothermophylus spores. Applied and Environmental Microbiology. 53(2):356-370.
FDA. 2005. Food and Drugs. Chapter 1- Food and Drug Administration. Department of Health and Human Services. Subchapter B- Food for Human Consumption. Code of Federal Regulations, Title 21, Volumn 2. Revised as of April 1, 2005
(21CFR113.3).
Fox K., and Eder B.D. 1969. Comparison of survivor curves of Bacillus subtilis spores subjected to wet and dry heat. Journal of Food Science. 34:518-512.
Heldman, D.R. and Hartel, R.W. 1997. Principles of Food Processing. Springer, New York.
Lebbink J.H., Kaper T., Kengen S.W., and van der Oost, J., deVos W.M. 2001. Beta-glucosidase CelB from P. furiosus: production by E. coli, purification, and in vitro evolution. Methods in Enzymology. 330: 364-379.
Lewis, M.J. 2006. Thermal Processing. In: Food Processing Handbook. J.G. Brennan (Ed.), Wiley-VCH, Weinheim: 33-70.
Perkins W.E., Ashton D.H., and Evancho G.M. 1975. Influence of the z value of Clostridium botulinum on the accuracy of process calculation. Journal of Food Science.40:1189-92.
Stumbo C.R., Purohit K.S., Ramakrishnan T.V. 1950. Nature of thermal death time curves for PA 3679 and Clostridium botulinum. Food Technology. 4:321-326.
Tucker G.S., Brown H.M., Fryer P.J., Cox P.W., Poole II F.L., Lee H.-S., and Adams M.W.W. 2007. A sterilisation Time–Temperature Integrator based on amylase from the hyperthermophilic organism Pyrococcus furiosus. Innovative Food Science & Emerging Technologies. 8(1):63-72.
Tucker, G.S., Lambourne, T., Adams, J.B., Lach, A. 2002. Application of a Biochemical Time-Temperature Integrator to Estimate Pasteurization Values in Continuous Food Processes. Innovative Food Science & Emerging Technologies. 3: 165-174.
Van Loey, A., Arthawan A., Hendrickx, M., Haentjens T., Tobback P. 1997a. The Development and Use of an α-Amylase-based Time–Temperature Integrator to Evaluate in-Pack Pasteurization Processes. Lebensmittel-Wissenschaft und-Technologie. 30(1):94-100.
59
Figure 2.1. Schematic of the Teflon tubing used for the TTI system
Enzyme (15μ) Teflontube
+ H20 + CelB +
pNp-β-glucopyranoside p-Nitrophenol Glucose
(Absorbance = 405nm)
61
0
0.01
0.02
0.03
0.04
0.05
0.06
0
2
4
6
8
Time (min)
A
b
so
rb
a
n
ce
a
t
4
0
5
n
m
Rep 1
Rep 2
Rep 3
Figure 2.4. The residual enzyme activity of beta-glucosidase after using stainless steel hemostat clips and a Bunsen gas burner to heat-seal the enzyme solution into the Teflon tubing
80 85 90 95 100 105
Experiment 1 Experiment 2 Experiment 3
63
Figure 2.5. The residual enzyme activity of beta-glucosidase after the thermal come-up time of 24 seconds at 121oC
60 70 80 90 100 110
Experiment 1 Experiment 2 Experiment 3 Experiment 4 Experiment 5 Experiment 6
Figure 2.6. Isothermal heat inactivation kinetics for Pyrococcus furiosus
β-glucosidase at (a) 105°C, (b) 110°C, (c) 115°C, (d) 121°C, (e) 125°C and (f) 127°C. Enzyme activity units presented as relative activity values on logarithmic scale 1.9 1.92 1.94 1.96 1.98 2 2.02 2.04
0 20 40 60 80
Time (min) L o g ( E /E 0 )
Rep 1 Rep 2 Rep 3
1.84 1.86 1.88 1.90 1.92 1.94 1.96 1.98 2.00
0 10 20 30 40
Time (min) L o g ( E /E 0 )
Rep 1 Rep 2 Rep 3
(a) (b)
1.70 1.75 1.80 1.85 1.90 1.95 2.00
0 5 10 15 20 25
Time (min) L o g ( E /E 0 )
Rep 1 Rep 2 Rep 3
0.0 0.5 1.0 1.5 2.0 2.5
0 1 2 3 4
Time (min) L o g ( E /E 0 )
Rep 1 Rep 2 Rep 3
(c) (d)
0.0 0.5 1.0 1.5 2.0
0 0.5 1 1.5 2 2.5 3 Time (min) L o g ( E /E 0 )
Rep 1 Rep 2 Rep 3
0.0 0.2 0.4 0.6 0.8 1.0 1.2 1.4
0.00 0.05 0.10 0.15 0.20
Time (min) L o g ( E / E 0 )
Rep 1 Rep 2
65
Table 2.1. Kinetic parameter estimates for thermal inactivation of beta-glucosidase obtained at isothermal conditions at different temperature levels
Temperature (°C) D-value (min)
105 1242.98
110 288.42
115 105.20
121 7.53
125 2.50
127 0.62
z = 6.92 oC
-0.5 0 0.5 1 1.5 2 2.5 3 3.5
100 110 120 130
Temperature (oC)
L
o
g
(
D
T
-v
a
lu
e
s
)