Scholarship at UWindsor
Scholarship at UWindsor
Electronic Theses and Dissertations Theses, Dissertations, and Major Papers
1-28-2019
Exploration of the Lean Limit in a Split-Cycle Engine
Exploration of the Lean Limit in a Split-Cycle Engine
Steven Dal Bello University of Windsor
Follow this and additional works at: https://scholar.uwindsor.ca/etd
Recommended Citation Recommended Citation
Dal Bello, Steven, "Exploration of the Lean Limit in a Split-Cycle Engine" (2019). Electronic Theses and Dissertations. 7634.
https://scholar.uwindsor.ca/etd/7634
This online database contains the full-text of PhD dissertations and Masters’ theses of University of Windsor students from 1954 forward. These documents are made available for personal study and research purposes only, in accordance with the Canadian Copyright Act and the Creative Commons license—CC BY-NC-ND (Attribution, Non-Commercial, No Derivative Works). Under this license, works must always be attributed to the copyright holder (original author), cannot be used for any commercial purposes, and may not be altered. Any other use would require the permission of the copyright holder. Students may inquire about withdrawing their dissertation and/or thesis from this database. For additional inquiries, please contact the repository administrator via email
Engine
By:
Steven Dal Bello
A Thesis
Submitted to the Faculty of Graduate Studies
Through the Department of Mechanical, Automotive and Materials Engineering in Partial Fulfillment of the Requirements for
the Degree of Master of Applied Science at the University of Windsor
Windsor, Ontario, Canada
by
Steven Dal Bello
APPROVED BY:
D. Green
Department of Mechanical, Automotive and Materials Engineering
M. Zheng
Department of Mechanical, Automotive and Materials Engineering
A. Sobiesiak, Advisor
Department of Mechanical, Automotive and Materials Engineering
Declaration of Originality
I hereby certify that I am the sole author of this thesis and that no part of this thesis has been published or submitted for publication.
I certify that, to the best of my knowledge, my thesis does not infringe upon any-one’s copyright nor violate any proprietary rights and that any ideas, techniques, quotations, or any other material from the work of other people included in my the-sis, published or otherwise, are fully acknowledged in accordance with the standard referencing practices. Furthermore, to the extent that I have included copyrighted material that surpasses the bounds of fair dealing within the meaning of the Canada Copyright Act, I certify that I have obtained a written permission from the copyright owner(s) to include such material(s) in my thesis and have included copies of such copyright clearances to my appendix.
Abstract
With increasing focus on efficiency and reduction of greenhouse gases, combustion processes need to be improve. Whether through use of alternative fuel or alternative combustion cycles, improvements to the combustion process are desired. Natural gas composed primarily of methane is an alternative fuel for internal combustion engines that has a potential to meet these goals. It has a high octane number, reduced CO2 output and lower emissions than other gases. Natural gas has a low laminar flame speed, making its implementation in internal combustion engines challenging.
A split-cycle engine has been constructed at the University of Windsor to address is-sues typical of natural gas combustion. The architecture promotes intense turbulence leading to improved burn rates. Testing on the split-cycle has shown burn durations under 30°CA, amongst the fastest for natural gas engines presented in literature.
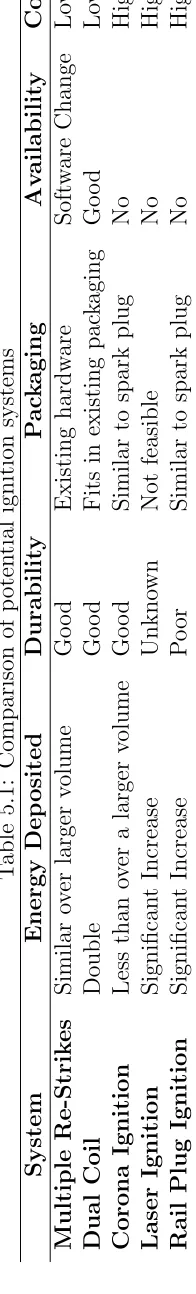
This work will address two issues with the split-cycle engine, the high lean limit of operation and the low loads achieved by the engine. The lean limit of operation is extended using a dual coil ignition strategy, increasing energy input to the kernel, thereby increasing stability. Secondly, it has been shown that early exhaust valve clo-sure results in excessive combustion products being in-cylinder, resulting in 15-25% charge dilution. A change in exhaust valve timing is shown to effect the lean limit of operation.
Acknowledgements
I would like to thank my Supervisor Dr. Sobiesiak for his guidance and support throughout this project. His patience and feedback on the work I have performed is greatly appreciated. I would also like to thank Dr. Green and Dr. Zheng for being on my committee and for the useful feedback and input they have provided.
I would also like to thanks the technicians at the University for their technical assis-tance and fulfilling my machining requests. Specifically I would like to thank Andy Jenner, Dean Poublon, Bruce Durfy, Kevin Harkai, Ram Barakat and Frank Cicchello for there assistance with various parts of this thesis.
Contents
Declaration of Originality iii
Abstract iv
Acknowledgements v
List of Tables x
List of Figures xii
Abbreviations xiii
1 Introduction 1
1.1 Overview . . . 1
1.2 Research Objectives . . . 2
1.3 Thesis Organization . . . 3
2 Split-Cycle Engine 4 2.1 Operating Principles . . . 4
2.2 Natural Gas Use as a Fuel . . . 7
2.3 University of Windsor Split-Cycle Engine . . . 10
2.3.1 Constructed Engine . . . 10
2.3.2 Engine Dynamometer . . . 13
2.4 Split-Cycle Engine Operating Characteristics . . . 13
2.5 Split-Cycle Advantages and Disadvantages . . . 14
2.5.1 Advantages of Split-Cycle Architecture . . . 15
2.5.2 Disadvantages of Split-Cycle Architecture . . . 15
2.6 Data Acquisition, Control and Post-Processing . . . 16
2.6.1 Data Acquisition and Control . . . 16
2.6.3 Data Acquisition Sensors Modifications . . . 20
2.6.4 LabViewTM Code . . . . 21
2.6.5 MATLAB Post-Processing . . . 22
3 Engine and Combustion Performance Metrics 24 3.1 Indicated Performance . . . 24
3.1.1 Indicated Mean Effective Pressure . . . 24
3.1.2 Brake mean Effective Pressure . . . 25
3.2 Mass Fraction Burned (MFB) . . . 26
3.3 Combustion Phasing . . . 27
3.4 Combustion Stability . . . 28
3.4.1 Lean Limit Definition . . . 29
3.5 Volumetric Efficiency . . . 29
4 Engine Operations Benchmark 30 4.1 Operating Characteristics . . . 30
4.1.1 Indicated Output . . . 30
4.1.2 Rates of Combustion . . . 31
4.1.3 Combustion Stability . . . 35
4.1.4 Volumetric Efficiency . . . 36
4.2 Lean Limit of Operation . . . 37
4.2.1 Exhaust Valve Timing Effect on Lean Limit . . . 37
4.2.2 Turbulence Effect on Lean Limit . . . 39
4.3 Head Gasket Failure . . . 40
4.3.1 Evidence of Gasket Failure . . . 40
4.3.2 Head Gasket Failure . . . 42
4.3.3 Head Gasket Re-Design . . . 44
4.3.4 Comments on Combustion with Failed Head Gasket . . . 46
5 Alternative Ignition Strategies 47 5.1 Review of Alternative Strategies in Literature . . . 47
5.1.1 Conventional Ignition Coil Based Strategies . . . 47
5.1.2 Non-Conventional Ignition Strategies . . . 51
5.1.3 Selected Ignition Strategies . . . 52
5.2 Implementation of Selected Coil Strategies . . . 54
5.2.1 Engine Coil . . . 54
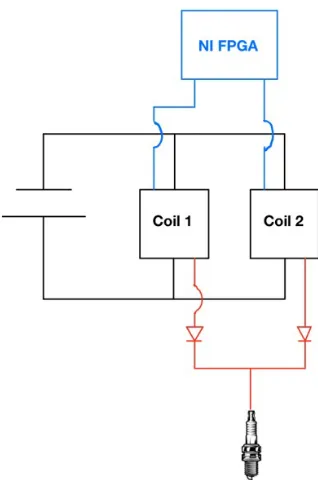
5.2.3 Dual Coil Ignition Implementation . . . 55
5.3 Spark Energy Measurements . . . 56
5.3.1 Energy Measurements . . . 57
5.4 Multi-Strike Testing Results . . . 58
5.4.1 Single Re-Strike Strategy . . . 59
5.4.2 5 Coil Re-Strikes Results . . . 61
5.4.3 Ineffectiveness of the Re-Strike Strategies . . . 62
5.5 Dual Coil Testing Results . . . 63
5.5.1 Engine Output . . . 63
5.5.2 Burn Durations . . . 65
5.5.3 Combustion Stability . . . 67
5.5.4 Misfires . . . 69
5.5.5 Dual Coil Ignition Conclusions . . . 70
6 Valve Timing Effects and Modifications 72 6.1 Valve Timing Effects . . . 72
6.2 New XOVR Cam Profiles and Timing Design . . . 75
6.2.1 Cam Profiles . . . 75
6.2.2 Cam Phasing . . . 76
6.3 New Profiles Testing Results . . . 76
6.3.1 Test Conditions . . . 76
6.3.2 Operating Characteristics . . . 77
6.3.3 Indicated Output . . . 80
6.3.4 Burn Durations . . . 82
6.3.5 Combustion Stability . . . 83
6.3.6 Volumetric Efficiency . . . 85
6.4 Combustion Cylinder Performance Analysis . . . 85
6.4.1 Ideal Gas Law Analysis . . . 86
6.4.2 Indicated Specific Fuel Consumption . . . 88
6.4.3 Crossover Mass Loss . . . 89
6.5 Engine Mass Balance Analysis . . . 90
6.5.1 Mass Compressed Ratio Evaluation . . . 91
6.5.2 Relationship of MCr to Volumetric Efficiency . . . 92
6.5.3 Ideal Expansion Cylinder Volume . . . 92
6.6 Exhaust Valve Timing Closure Effects . . . 93
7 Summary, Conclusions and Recommendations 96
7.1 Conclusions on Operational Lean Limit . . . 96 7.2 Conclusions on Valve Timing Effects . . . 97 7.3 Recommendations and Future Work . . . 97
Bibliography 99
List of Tables
2.1 Split-Cycle Engine Specifications . . . 10
2.2 Channel Allocation NI-6210 . . . 16
2.3 Channel Allocation NI-6356 . . . 17
2.4 Engine Pressure Transducers . . . 18
4.1 Comparison of Split-Cycle Burn Durations to Literature . . . 34
4.2 Nominal Expansion Cylinder Valve Timings . . . 37
5.1 Comparison of potential ignition systems . . . 53
5.2 AEM Coil Manufacturer Specifications . . . 54
5.3 Selected resistor values for Spark Energy Circuit . . . 57
5.4 Measured Energy Values of Spark Strategies . . . 58
6.1 Cam Profile Specifications for XOVI and XOVO . . . 75
6.2 Valve Opening Locations with Modified Cam Profiles . . . 76
6.3 Test Condition for Split-Cycle Engine with New Cam Profiles . . . . 76
6.4 XOVR Pressure Characteristics . . . 78
6.5 Values Used for Cylinder Ideal Gas Analysis . . . 87
List of Figures
2.1 Illustration of the Split-Cycle Engine Arrangement . . . 5
2.2 Ideal Split-Cycle Thermodynamic Cycle . . . 6
2.3 Typical variation in emissions with φ from Stone [1] . . . 8
2.4 Cross-Section of RPV OHC . . . 11
2.5 Engine Dynamometer Set-Up . . . 13
2.6 Pressure Traces for Split-Cycle Engine During Normal Operation . . 14
2.7 Exhaust Pressure Transducer Location . . . 21
3.1 Compression and Expansion Cylinder Pressure Traces . . . 25
3.2 LPP Measurement Location . . . 28
4.1 Engine IMEP [bar] . . . 31
4.2 CA90 . . . 32
4.3 Burn Durations at Stoichiometric Conditions and Best Achievable Ig-nition Timing . . . 33
4.4 COVIM EP at tested ignition timings . . . 35
4.5 COVLP P at tested ignition timings . . . 36
4.6 Pressure Trace Highlighting the EVC . . . 38
4.7 Bridged Spark Plug . . . 41
4.8 Lower head portion after removal . . . 42
4.9 Cylinder Head exposed to Combustion Chamber . . . 43
4.10 Failed Gasket on side exposed to XOVR . . . 44
4.11 New Copper Head Gasket . . . 45
5.1 Voltage Profile of a Typical Spark Event . . . 48
5.2 Energy Profile of a Coil Strike . . . 49
5.3 Energy Profile of a Multiple Strike Ignition Event . . . 49
5.4 Schematic of the Dual Coil Ignition System . . . 55
5.6 Nomenclature Used for Multiple Strike Ignition Event for example with
three strikes . . . 59
5.7 COVLP P atφ= 0.83, θStrikeOne = 20°AT DC, T1= 1°CA andnengine = 850rpm . . . 60
5.8 COVIM EP at φ = 0.83, θStrikeOne = 20°AT DC, T1 = 1°CA and nengine = 850rpm . . . 61
5.9 IM EP for Dual Coil Ignition at 850rpm θIgnition= 18°AT DC . . . . 63
5.10 IM EP for Dual Coil Ignition at 1000rpm θIgnition= 16°AT DC . . . . 64
5.11 IM EP for Dual Coil Ignition at 1200rpm and θIgnition= 16°AT DC . 64 5.12 Total Burn for Dual Coil Ignition atnengine = 1000rpmand θIgnition = 18°AT DC . . . 65
5.13 Flame Development Period for Dual Coil Ignition atnengine = 1000rpm and θIgnition= 18°AT DC . . . 66
5.14 Main Burn Period for Dual Coil Ignition at nengine = 1000rpm and θIgnition= 18°AT DC . . . 66
5.15 Total Burn for Dual Coil Ignition at nengine = 850rpm and θIgnition = 18°AT DC . . . 67
5.16 COVIM EP for Dual Coil Ignition at nengine = 1200rpmand θIgnition = 16°AT DC . . . 68
5.17 COVLP P for Dual Coil Ignition at 1200rpm θIgnition= 16°AT DC . . . 69
5.18 Average number of Misfires per 300 cycles at nengine = 1000rpm and θIgnition= 16°AT DC . . . 70
6.1 Split-Cycle Valve Timing Diagram . . . 74
6.2 Crossover Pressure for a Single Cycle . . . 78
6.3 Fired Cycles with New and Old Cam Profiles . . . 79
6.4 IM EP for Best Achievable Ignition Timing with New Cam Profiles . 80 6.5 IM EPnet Comparison at nengine = 1000rpmwith New Valve Timing . 81 6.6 IM EPCyl2 Comparison at nengine = 1000rpmwith New Cam Profiles 81 6.7 IM EP for Best Achievable Ignition Timing with New Cam Profiles . 82 6.8 COVIM EP at Best Achievable Ignition Timing with New Cam Profiles 83 6.9 COVIM EP at a nengine= 1000rpm comparison between cam profiles . 84 6.10 COVLP P at Best Achievable Ignition Timing with New Cam Profiles . 85 6.11 Fired Expansion Stroke with XOVO-c noted . . . 86
Abbreviations
AFR Air-to-Fuel Ratio.
BAT Best Achievable Ignition Timing.
BBDC Before Bottom Dead Center.
BMEP Brake Mean Effective Pressure.
BTDC Before Top Dead Center.
CA Crank Angle.
CNG Compressed Natural Gas.
CO Carbon Monoxide.
CO2 Carbon Dioxide.
COV Coefficient of Variation.
cRIO CompactRIO.
DAQ Data Acquisition.
EGR Exhaust Gas Recirculation.
EVC Exhaust Valve Closing.
FPGA Field Programmable Gate Array.
HCPC Homogeneous Charge Progressive Combustion.
IGR Internal Gas Recirculation.
IMEP Indicated Mean Effective Pressure.
isfc Indicated Specific Fuel Consumption.
LFE Laminar Flow Element.
LHV Lower Heating Value.
LPP Location of Peak Pressure.
MAF Mass Air Flow.
MCr Mass Compressed Ratio.
MFB Mass Fraction Burned.
MFF Mass Fuel Flow Rate.
NG Natural Gas.
NOx Nitrous Oxides.
OVC Overhead Valve Camshaft.
PM Particulate Matter.
PR Pressure Ratio.
PRn Normalized Pressure Ratio.
RPV Reverse Poppet Valve-Train.
SI Spark Ignition.
TDC Top Dead Center.
TDMS Technical Data Management Solution.
UEGO Universal Exhaust Gas Oxygen.
VI Virtual Instrument.
XOVI Crossover Passage Inlet Valve.
XOVO Crossover Passage Outlet Valve.
XOVO-c Crossover Passage Outlet Valve Closing.
Chapter 1
Introduction
1.1
Overview
Increasingly stringent emissions requirements for internal combustion engines has led to a need to improve the combustion process. Emission regulations from governments have typically measured four major components in exhaust gas; Carbon Monoxide (CO), Nitrous Oxides (NOx), Unburnt Hydrocarbons (UHC) and Particulate Matter
(PM) [2]. Future regulations of combustion engines are to include restrictions on pro-duction of CO2 [3], meaning reductions in CO2 emissions is an area of great concern to combustion researchers and engine designers. As CO2 is a product of complete combustion, decreasing CO2 emissions will require an improvement of the overall ef-ficiency of an engine through an improvement of the combustion process. Typical methods of improving engine efficiency have included better combustion chamber de-sign, use of alternative fuels, and the running engines at leaner equivalence ratios.
spark timing being advanced by up to 10° Crank Angle (CA)[7]. Also presenting an issue with NG engines is the gaseous fuel displacing air in the intake, thereby reducing volumetric efficiency. Previous works have shown to reduce volumetric efficiency up to 10% when converting a port injected engine to NG[8].
In-cylinder turbulence has been shown to increase the rates of combustion for both NG and gasoline fuels [7, 9, 10]. In-cylinder turbulence with large velocity fluctua-tions and small scale turbulent eddies are desired. Typically, in order to achieve this amount of turbulence large squish areas, high engine speeds, and compact combustion chambers are needed [1].
Another approach that has been used in order to achieve the high level of turbulence needed for rapid combustion is through the use of a split-cycle engine [11, 12]. Split-cycle operation is an engine where one cylinder performs intake and compression strokes while a second performs expansion and exhaust. This arrangement will be reviewed in depth in Chapter 2. A split-cycle engine has been constructed at the University of Windsor and evaluated for its performance [11]. Quick burn durations for a natural gas engine have been achieved, however several issues exist limiting the performance of the engine. One of the most significant factors impacting the engine performance is the lean limit of the engine. At this time a lean limit of Φ = 0.85 is the minimum achievable equivalence ratio for this engine, which is high compared to other natural gas engines. In this work reasons for this lean limit are explored along with techniques for extending this lean limit. The applicability of this work extends to not just this engine, but any engine with large amounts of turbulence generation, engines running at lean limit or engines with high amounts of charge dilution.
1.2
Research Objectives
The objective of this work is to continue development and research of the split-cycle engine at the University of Windsor. The previous work on this engine has presented multiple issues with the operation of the engine [11]. The three following points have been chosen as the main focus of this research.
(a) Changing the exhaust valve closing (EVC) to reduce in-cylinder trapped mass
(b) Use of an alternative and/or high energy ignition system to improve igni-tion at lean limits
2. Change the cam profiles on the crossover passage (XOVR) to improve engine output. Values previously tested were those of the first design iteration where little information was known on the engine operation. Effects of changing the XOVR opening duration are explored with a new set of cam profiles that are tested and validated.
3. Use the implemented changes and the amassed data to further characterize the split-cycle engine. Data can be compared with results from the first iteration of valve timing to better characterize the operation of the engine.
1.3
Thesis Organization
Chapter 2
Split-Cycle Engine
In this section an overview of the split-cycle engine is presented. A literature review on the split-cycle engine and use of natural gas as a fuel is given. An overview of the split-cycle engine that has been constructed at the University of Windsor is given, with sections covering the design, control and data acquisition of the engine.
2.1
Operating Principles
A split-cycle engine is an engine in which the four engine strokes are separated into two separate cylinders. In this arrangement the first cylinder will perform the intake and compression strokes while the second will perform expansion and exhaust. In this work the first cylinder will be referred to as the compression cylinder and the second as the expansion cylinder. The two cylinders must be connected by an intermediary volume to allow for the transfer of charge from the compression to the expansion cylinder. This arrangement is beneficial to engine operation as the entire cycle can be completed in one engine revolution. A split-cycle engine would be comparable to a two cylinder four-stroke in terms of the strokes occurring during each revolution of the crankshaft.
proposed by American engineer Carmelo Scuderi [16].
The Scuderi split-cycle engine consists of 2 cylinders connected by a high pressure crossover passage (XOVR). There is an offset between the compression and expan-sion cylinders with the expanexpan-sion cylinder approaching engine top dead center TDC before the compression cylinder. In this arrangement the XOVR passage will ideally remain isobaric throughout the engine cycle. Figure 2.1 shows the arrangement of the split-cycle cylinders and XOVR.
Figure 2.1: Illustration of the Split-Cycle Engine Arrangement
the engine is at TDC. At this time the charge is transferred from the high pressure XOVR to the expansion cylinder. Mass transfer occurs rapidly at sonic velocities leading to intense small scale turbulence at the time of ignition. This is due in part to the expansion cylinder being at TDC, restricting the size of the largest turbulent eddies that can be formed. Also the limited valve height of less than 4mm results in small scale turbulence generated by the flow passing over the valves. This turbulence leads to short burn durations faster than those achieved in a typical four-stroke ar-rangement, potentially leading to greater efficiencies.
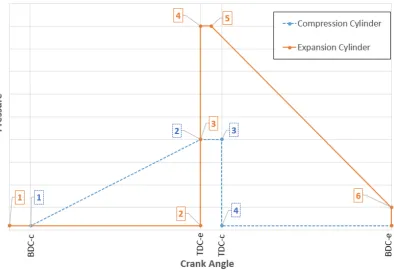
The thermodynamic cycles can be observed to better understand the operation of the split-cycle engine. In Figure 2.2 the ideal thermodynamic cycle is shown on a Pressure-Crank Angle basis.
Figure 2.2: Ideal Split-Cycle Thermodynamic Cycle
Compression Cylinder
1-2 Polytropic Compression
2-3 Mass Transfer to XOVR
3-4 Re-expansion of trapped mass due to mechanical clearances
4-1 Fresh Air Intake
Expansion Cylinder
1-2 Exhaust Stroke
2-3 Mass Transfer from XOVR
3-4 Constant Volume Heat Release
4-5 Constant Pressure Heat Release
5-6 Polytropic Expansion
6-1 Blow Down
The compression cylinder behaves as a compressor operating on a standard compres-sion cycle. In this engine the expancompres-sion pressure trace will differ from the theoretical one. Mass transfer does not happen instantaneously in steps 2-3. Mass transfer will take a finite amount of time. As well any valve train will also require a finite amount of time for valves to open and close, further increasing the duration of this event. Furthermore, ignition must be delayed in order to ensure the flame does not travel into the XOVR. This results in ignition occurring after TDC. How these realities affect engine performance will be later described in Section 2.3
2.2
Natural Gas Use as a Fuel
base on carbon output [17]. Further advantages of NG are due to its high octane rating of 130. This will allow for higher compression ratios to be run in a NG Spark Ignition (SI) engine. In turn, this will lead to higher thermal efficiencies, which can be understood by looking at Equation 2.1.
nth= 1−
1 rk−1
c
(2.1)
In this equation rc is the compression ratio and k is the ratio of specific heat. With
an increasing compression ratio the thermal efficiency will increase.
Natural gas composition varies depending on the origin of the gas. Its major con-stituent is typically methane, which typically makes up 80-95% of the gas composition. Other components vary, often containing ethane, propane, butane, nitrogen gas and CO2. The Lower Heating Value (LHV) of methane is typically 50 MJ/kg. In com-parison to a more common fuel, the LHV of gasoline is typically 42MJ/kg [4].
A further advantage of NG in engines is that it can be run at lean equivalence ratios. Research has shown the ability to run NG engines at a equivalence ratio of up to φ = 0.6. [6, 18] Lean equivalence ratios are desirable in SI engines due to the re-ductions in NOx and CO that accompany lean burn conditions [1]. The decrease in
undesired combustion products can be seen in Figure 2.3 as a function of equivalence ratio φ.
0.8 0.85 0.9 0.95 1 1.05 1.1 1.15 0
0.1 0.2 0.3 0.4 0.5
Equivalence Ratio φ
V olume UHC, N Ox [%]
N Ox
CO UHC
0 0.2 0.4 0.6 0.8 1
V
olume
CO
[%
Issues that arise from the use of NG come from the transport, storage and burning of the fuel. The storage of NG is challenging due to the gaseous state and low density of the fuel. In an automotive application where volume available for fuel storage is extremely limited, storage systems often require complex solutions to increase storage density [19]. Further adding to complications with NG is the primary component of methane which is a significantly more potent greenhouse gas than CO2 [20]. If leakage of methane occurs during production or delivery, it can offset any gain made by using it as a fuel. This results in a necessity to design production facilities to minimize effects of potential leakage occurring during NG production.
Issues that arise for use in internal combustion engines ICE are due to the fuel prop-erties of NG. The laminar flame speed of methane is UL ≈ 0.37cm/s, which is the
slowest amongst hydrocarbon fuels [21]. This results in lower flame speeds and longer burn durations in-cylinder. In order to improve rates of combustion turbulence is needed to wrinkle the flame front and increase the burning velocity. The positive influence of increasing turbulence on the flame speed is well documented in litera-ture [1, 22]. The slower flame speed of NG mixlitera-tures results in some performance inhibiting behaviour in engines when compared to SI engines fueled with traditional hydrocarbon fuels such as gasoline. Spark timing must be advanced in order to com-pensate for the longer burn durations [6]. This results in combustion being initiated further before engine TDC, which results in lower overall work output due to the pressure rise on the compression stroke.
Lower laminar flame speed can be compensated for by designing combustion cham-bers and intake systems to optimize in-cylinder turbulence generation. Specialized combustion chambers with large squish areas [23], and specially designed intake ports to optimize swirl generation [24] have been used as methods of increasing combustion rates through turbulence generation. Both of these methods have been shown to suf-ficiently increase the rate of combustion in SI NG engines. It should be noted that it has been shown that excessive turbulence can be detrimental to engine operation. Excessive turbulence can lead to extra heat transfer through the cylinder walls and therefore the engine should be designed with these limits in mind [25].
the combustion cylinder, resulting in variations in the local air-to-fuel ratio and thus lower combustion stability.
2.3
University of Windsor Split-Cycle Engine
In this section an overview on the constructed split-cycle engine is given. Important and distinguishing design features are reviewed as they directly relate to the perfor-mance of the engine. A detailed overview of the construction can be found in the dissertation of Dr. Iain Cameron [11]. Modifications discussed in Sections 2.6.3 and 4.3 should be noted for their relevant to the future operation and use of the engine.
2.3.1
Constructed Engine
The split-cycle engine constructed at the University of Windsor is based on aKubota Z482 2-cylinder diesel engine. Engine components were reused during construction in order to save on cost and time during construction. Components modified and reused use in the split-cycle include the cylinder block, engine oil pan, crankshaft, pistons and the cam shaft for the intake and exhaust valves. Table 2.1 gives the specifications on the geometry of the engine.
Table 2.1: Split-Cycle Engine Specifications
Bore 67 mm
Stroke 68 mm
Connecting Rod Length 98.2 mm
Cylinder Displacement 240 cm3
Geometric Compression Ratio 108:1
Geometric Expansion Ratio 86:1
Piston Offset Angle 20°
Spark Plug Single Iridium, Centrally Located
impossible to achieve this small head clearance with a typical valve train and high-lights the reason for the construction of the reverse poppet valve train which will be discussed in the following section.
Reverse Poppet Valves
In order to minimize clearance volume the unique inward opening valve train has been developed, referred to as the Reverse Poppet Valve-Train (RPV). As opposed to a conventional valve train where valves are opened into the cylinder, these valves are pulled away from the cylinder and into the XOVR passage. The cam shaft is an Overhead Valve Camshaft (OVC) that operates separate from the conventional valve train for intake and exhaust. A drawing of the cross section of the valve arrangement can be seen in Figure 2.4 [11]
This is a unique arrangement only seen in the split-cycle engine. All components had to be designed and fabricated at te University of Windsor and the process is documented in the thesis of Dr.Iain Cameron [11].
Another item of note with the valve train is the low valve lift and short opening duration of the valves. Nominal valve opening duration is 50°CA, significantly shorter than durations of typical 4-stroke engine. Maximum lift was initially designed with a 3.5mm lift on both intake and exhaust, however has it been minimized based on results from testing tests. The short opening duration and low valve lift are only needed due to the high pressure of the XOVR passage. Since flow is occurring at sonic velocities large lifts and durations are not required to fill the cylinder. The arrangement of the sonic flow passing through the valves with low lift also leads to intense, small scale turbulence at the time of ignition.
Engine Head Construction
In order to accommodate the RPV discussed in the previous section a custom engine head needed to be constructed. During design precedence was given to existing com-ponents from the stock Kubota engine. The design that was chosen was a two piece cylinder head. The lower mates with the deck of the engine block using the stock Kubota gasket. In the top of the lower head the crossover passage is machined. To seal this high pressure volume a copper gasket is constructed to seal between the up-per and lower head. The failure of the original design of this gasket is documented in Section 4.3. The upper head contains all valvetrain components and seals the XOVR passage.
Fuel System
2.3.2
Engine Dynamometer
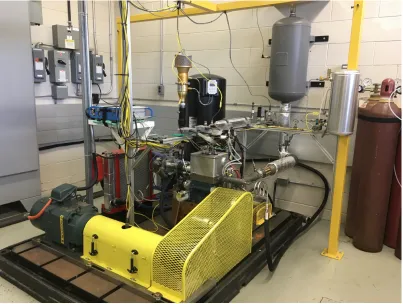
The split-cycle engine is connected to an 15V AC dynamometer, often shortened to dyno. The dyno is used for both energy dissipation and motoring of the engine. The engines output shaft is connected to the AC dyno using a belt drive. Due to the frictional losses caused by a belt, the presented values for indicated performance of this work will be the Indicated Mean Effective Pressure (IMEP), obtained from the in-cylinder pressure. An image of the set-up is given in Figure 2.5.
Figure 2.5: Engine Dynamometer Set-Up
2.4
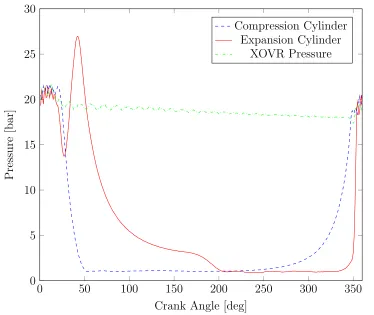
Split-Cycle Engine Operating Characteristics
0 50 100 150 200 250 300 350 0
5 10 15 20 25 30
Crank Angle [deg]
Pressure
[bar]
Compression Cylinder Expansion Cylinder
XOVR Pressure
Figure 2.6: Pressure Traces for Split-Cycle Engine During Normal Operation
This figure shows many of the realities of the actual split-cycle engine cycle. It should be noted that the XOVR pressure is decreasing slightly throughout the cycle. This pressure drop is partially attributed to heat transfer losses, but is also due to mass loss occurring in the XOVR. The second characteristic to note is the opening duration of the compression and expansion cylinder, from roughly 350°(10°BTDC) to 30°ATDC. Mass transfer from the compression cylinder and to the expansion cylinders take a finite amount of time, limiting the operation of the engine. The last characteristic to note is the effect of the late ignition timing. A unique characteristic of the split-cycle engine is the pressure drop that occurs before the heat release begins in-cylinder (from 25-35°ATDC). Ignition timing is limited by the closing of the XOVR outlet valve, as any earlier ignition would result in flame propagating into the XOVR passage.
2.5
Split-Cycle Advantages and Disadvantages
disadvantages of the split-cycle engine constructed at the University of Windsor are given in this section.
2.5.1
Advantages of Split-Cycle Architecture
Engine only takes one crankshaft revolution (360°) to complete an entire engine cycle.
A power stroke occurs on every cycle. This results in the split-cycle having performance characteristics similar to a 2-stroke engine without the problems associated with two strokes, such as short circuiting and burning of engine oil.
Fuel is injected into the XOVR passage allowing for good mixing of air and fuel, creating a well pre-mixed charge.
No risk of knocking on the compression stroke as only air is compressed.
Turbulence generation is decoupled from engine speed, not requiring higher engine speeds for turbulence generation. Allows for quick burn to occur at all conditions, including part load.
Mixture transfer from the XOVR to the combustion cylinder occurs at TDC of expansion cylinder. Causes intense small scale turbulence at the time of ignition, leading to fast burn rates.
2.5.2
Disadvantages of Split-Cycle Architecture
The split-cycle engine with its two valvetrains and the RPV is more complex than a traditional 2-stroke or 4-stroke engine
Ignition occurs after TDC, resulting in an expanding volume during the entire flame development and main burn periods.
Ignition timing is limited by the closing of the XOVR outlet valve, which retards ignition timing.
2.6
Data Acquisition, Control and Post-Processing
2.6.1
Data Acquisition and Control
Data acquisition is done using three separate data acquisition cards. The acquisition can be divided into three classifications:
1. Temperature Data Acquisition
2. Low Speed Data Acquisition for mass flow meters and lambda measurement 3. High Speed Data Acquisition for crank angle dependent variables and Low Level
Control
NI-9213 Thermocouple DAQ Device
Designed for use with thermocouple measurements. Records all of the thermocouple channels with cold junction temperature compensation.
NI-6210 USB DAQ Device
The NI-6210 Data Acquisition (DAQ) device is a multi-use DAQ device capable of 250 kS/s aggregate sampling. In previous work on this engine it was used as the data acquisition device for the emissions bench. Since the emissions bench is no longer in use this device has been re-purposed for general data acquisition. Slower sampled, non-time dependent variables have been acquired with this device. This arrangement opens up acquisition channels on the high speed NI-6356 USB device and reduces the size of the saved data files. A list of signals and the channel locations are given in Table 2.2.
Table 2.2: Channel Allocation NI-6210
Channel Signal
AI1 Mass Fuel Flow AI2 Mass Air Flow AI3 λ Horiba MEXA-730 AI4 Room Relative Humidity
NI-6356 X-Series USB DAQ
is sufficient speed for acquiring the data at the rates needed for 0.1 CA resolution. The device is also used to acquire the digital input signal from the rotary crank angle encoder.
The device is also capable of analogue output which is used for low level control. The device is used to control the dyno speed, throttle position and fan control. A full list of the inputs and outputs of the data acquisition card are given in Table 2.3.
Table 2.3: Channel Allocation NI-6356
Channel Signal
AI0 Intake Pressure
AI1 In-Cylinder Pressure 1 AI2 In-Cylinder Pressure 2 AI3 Crossover Pressure AI4 Exhaust Pressure AI5 Torque
AO0 Dyno Speed Control AO1 Throttle Control Port2:Line3 Fan Control
ctr3 Encoder Channel
Engine Control
As the split-cycle is a custom-built engine there is no existing control program to for the ignition system and fuel injection. As such, a program had to be developed. In order to control the engine a LabView CompactRIO (cRIO) device with a Field Pro-grammable Gate Array (FPGA) was chosen. The FPGA allows for fast data refresh rates (40MHz). The control program which is written in LabView is converted to a Xilinx file. The program is written to the cRIO device, allowing it to operate with-out directly relying on a computer. This is a desirable arrangement as it allows the engine to run without fear of a computer program causing latency during operation and potentially causing damage to the set-up.
2.6.2
Instrumentation
Pressure Transducers
The split-cycle engine has been instrumented with multiple pressure transducers in order to monitor and characterize the performance of the engine. Pressure trans-ducers are used to monitor operation of both cylinders and the XOVR passage, and then used to analyze engine performance. All pressure transducers used in the exper-imental set-up have been purchased from Kistler. In-cylinder pressure measurements for the compression and expansion cylinders are made with piezoelectric sensors and require zero-level correction. This correction is made with transducers located on the intake and exhaust ports. A list of the sensors is given in Table 2.4.
Table 2.4: Engine Pressure Transducers
Location Transducer Type Cooling Range Amplifier
Intake Port Kistler 4043A5 Piezoresistive Uncooled 0-5 bar Kistler 4618A0 In-Cylinder Kistler 6052C Piezoelectric Uncooled 0-100 bar Kistler 5064 Crossover Passage1 Kistler 4260A Piezoresistive Uncooled 0-51 bar Internal Exhaust Port2 Kistler 4049B Piezoresistive Water Cooled 0-5 bar Kistler 4665
1Updated pressure transducer from previous work 2Additional pressure transducer for this work
Crank Angle Position Measurement
Crank angle position was measured with a BEI H25 crank angle encoder mounted directly to the crankshaft. Measurements are made at a resolution of 0.1° CA, a commonly used measurement resolution for IC engines research. This resolution is sufficient to capture all characteristics of normal combustion. The data can be down sampled for analysis if required [27].
Alignment of the encoder to indicate engine TDC was performed. Accurately indicat-ing TDC is crucial to accurate data analysis. Davis and Patterson have shown that an offset of 1°CA can result in an error of 4−5% for the calculation of IMEP [28]. Three methods of alignment are typically used in combustion analysis.
Motoring Cylinder Pressure Trace:The engine is motored without firing and engine TDC can be found by plotting pressure and volume logarithmically. On this plot, TDC will be represented by a sharp peak. This is not practical with the split-cycle engine as neither of the cylinders valves are closed at TDC, and thus this peak pressure is not achieved.
TDC Sensor: Use of a commercially available TDC indicating system with accuracy of ±0.1° CA [29]. The high cost of these sensors often makes it im-practical to implement.
The engine was indicated to TDC using the mechanical alignment method described by Lancaster et al. [30] This method would achieve accuracies of TDC setting within
±3°CA. While this would result in large errors with respect IMEP and MFB, since all tests are performed with this same error all results would carry the same bias. While a TDC sensor is significantly more accurate, its high cost has made it cost prohibitive to use for this work.
Air-to-Fuel Ratio Measurements
Air flow rate and mass fuel flow rate were monitored in this work. Mass Air Flow (MAF) is measured using a Meriam Z50MC2-2F Laminar Flow Element (LFE) and a Dwyer Instruments Series 616 Weatherproof Differential Pressure Transmitter. A pressure drop will occur over the precisely manufactured LFE which will be measured by the pressure meter. The pressure drop is used to calculate the MAF by convert-ing the measured pressure drop to the MAF. The total uncertainty of the system is
±0.54%.
Mass Fuel Flow Rate (MFF) is measured using a Sierra Smart-Trak M100L mass flow meter. The flow meter is capable of measuring MFF at the high pressures of the fuel delivery system with a full scale accuracy of ±1% [31].
measurements made in previous works on this engine. The Horiba meter gives a read-ing of λ, the value which is the inverse of the equivalence ratio (φ). The definition of AFR is given in equation 2.2.
φ= 1 λ =
AF RStoich
AF RActual
(2.2) Where the air-to-fuel ratio is defined in Equation 2.3.
AF R= M AF
M F F (2.3)
Temperature Measurements
Thermocouples were also used to measure the temperature of various points on the engine. All outfitted thermocouples are K-Type thermocouples purchased from Omega®Engineering. K-Type thermocouples have been selected for use due to their large operating range (up to 1260° C), low cost and ability to function in rugged conditions caused by the engine. The standard accuracy of a K-type thermocouple is
±2.2°C or ±0.75%, whichever is greater [32]. Thermocouples of 1/16 inch diameter are used and are sampled at 10Hz. The slower sampling rate is used due to the long response time of thermocouples in air flow which can be up to 4s in a flow of 3m/s. [33].
2.6.3
Data Acquisition Sensors Modifications
Throughout the work on the engine various components of the engine have been upgraded or replaced. This has been due to certain components failure or in order to improve operation. The modifications will be listed and the rational behind the changes discussed.
Crossover Passage Transducer
Exhaust Pressure Transducer
A Kistler 4049B water-cooled pressure transducer has been added to the exhaust sys-tem of the set-up. The transducer is located roughly 50mm upstream of the exhaust valve between the engine and the exhaust thermocouple. It is capable of measuring pressures ranging from 0-5bar with accuracy of ±0.3%F SO. The new transducer location is shown in Figure 2.7
Figure 2.7: Exhaust Pressure Transducer Location
The exhaust pressure transducer is cooled using the existing cooling set-up that was used with the old XOVR passage transducer. With this transducer the exhaust pressure can be monitored and used to accurately pegging the expansion cylinder transducer.
2.6.4
LabView
TMCode
Changes to the LabViewTM VI have been made in order to ease the burden on the author for the processing of data. Data acquisition files are now saved in a procedu-rally generated folder based on the date of the test. Network acquired variables are now enabled with the VI, allowing for data to be passed between the FPGA control program and the data acquisition VI. This allows for variables such as the set engine speed, injector control pulse duration, and spark timing parameters to be monitored and logged from the acquisition program. The last improvement on the code that has been made is that a text file gets saved with every set of acquired data. This allows for the parameters for each test to be saved for easier evaluation and organization by the operator.
The LabView program records 300 consecutive engine cycles. Previous studies have shown that 300 cycles will give 99% confidence in average values of recorded data [30] and is picked to be consistent with previous work on this engine. Data is acquired as raw signals from LabView and saved in the Technical Data Management Solution (TDMS) format. All data is post-processed in the Matlab code described in Section 2.6.5.
2.6.5
MATLAB Post-Processing
Data analysis is done using a MATLAB program written by the author. Three separate files that were generated by the LabViewTMcode are imported into MATLAB for analysis. The text file that was generated during the data acquisition is imported for the purpose of bookkeeping. The text file contains information about the operating parameters of the engine such as spark timing, engine speed and equivalence ratio. The other two imported files are for the crank angle dependent and time dependent signals.
Data Filtering
It is also necessary to select a filter that does forward and backward filtering. A filter will inherently cause a phase shift of the data if unidirectional, which will cause errors with calculation of combustion phasing and IMEP calculation [35]. Therefore a filter with forward and backward filtering must be selected.
Chapter 3
Engine and Combustion
Performance Metrics
In this section the engine and combustion performance metrics will be discussed. Metrics are evaluated on a cycle-by-cycle basis and the values for individual cycles are used to perform statistical analysis on engine operation. Data is acquired from the LabViewTM VI, analyses using a MATLAB program written by the author and statistics for each test exported automatically to a master EXCEL sheet
3.1
Indicated Performance
Mean effective pressure is the selected method of evaluation of the indicated engine performance. Mean effective pressure is a normalized value which allows for compar-isons to be made to engines of larger displacement, number of cylinders or running at different engine speeds.
3.1.1
Indicated Mean Effective Pressure
The Indicated Mean Effective Pressure (IMEP) is the work transferred from the in-cylinder gas to the piston, normalized by the displacement volume of the engine. The equation for the IMEP is given in Equation 3.1.
IM EP = H
P(v)dV Vd
(3.1) In this equation Vd is the displacement volume and Pressure (P) is acquired with
cy-cle. Acquired data was numerically integrated in this work using the Simpson’s 1/3 method. Simpson’s method was selected to maintain consistency with previous work and to minimize truncation errors [36].
The split-cycle engine requires that the IMEP be evaluated method unique to this engine. Cylinder 1 performs intake and compression strokes while cylinder 2 performs expansion and exhaust. This means that the first cylinder represents work input while cylinder 2 represents work output. As a result the IMEP must be evaluated for each cylinder and net IMEP calculated as in Equation 3.2.
IM EPN et =IM EPCyl.1+IM EPCyl.2 (3.2)
The necessity of the calculation of IM EPN et can be better understood by observing
Figure 3.1. In this figure two real pressure traces are given from a random cycles representative of average operation of the engine. The area enclosed by the compres-sion cylinder trace represents the work input and the expancompres-sion cylinder the positive work.
0 0.5 1 1.5 2 2.5
·105 0
10 20 30
-W
Volume [mm3]
Pressure
[bar]
Compression Cylinder
0 0.5 1 1.5 2 2.5
·105
+W
Volume [mm3] Expansion Cylinder
Figure 3.1: Compression and Expansion Cylinder Pressure Traces
3.1.2
Brake mean Effective Pressure
will be calculated using the brake torque. The equation for BMEP is given in equation 3.3.
BM EP = Wb Vd
(3.3) In the preceding equation Wb is the brake work per cycle cylinder and Vd is the
dis-placement volume. This is a useful parameter to study the work output of the engine while accounting for frictional losses.
As the split-cycle is currently setup, the BMEP is not suitable for evaluation due the engine being connected to the dynamometer via a belt drive. This results in high friction losses from the belt, resulting in decreased torque and BMEP values. As a result, the IMEP will be the reported value in this work.
3.2
Mass Fraction Burned (MFB)
Given that the main motivation behind the investigation of the split-cycle engine was to achieve short burn durations the calculation of Mass Fraction Burned (MFB) is of great interest. The MFB is used to compute the crank angle burn duration in terms of °CA. The Normalized Pressure Ratio (PRn) method is the selected evaluation
method for this work, maintaining consistency with previous works on this engine. The PRn was selected over methods such as the Rassweiler and Withrow method [37]
as theP Rn method was found to give more accurate results in previous works on this
engine [11].
Normalized Pressure Rise Method
TheP Rnmethod is a way of evaluating the burn durations in an engine. The
method-ology of theP Rnis by establishing the deviation of the pressure trace between a fired
engine cycle and a motored one. The equations and methodology of the PRn method
are described in the following equations [38].
P R(θ) = Pf(θ) Pm(θ)
−1 (3.4)
trace. As such, with the PRn method it is necessary to obtain motored engine
pres-sure traces for the engine speed that the analysis is being performed at.
After the P Rhas been calculated for each cycle they must be normalized. With this method the cycle with the maximum P R is taken as the normalizing cycle. This assumes that this cycle has complete combustion and all other cycles are incomplete with respect to this one. The equation for the PRn is given in Equation 3.5
P Rn(θ) =
P R(θ)
M ax[P R(θ)] (3.5) The advantage of the use of the PRn method is that the motoring trace inherently
includes the effects of the flow occurring into the cylinders of the engine. Given that ignition occurs before the valves are closed it is believed that this can cause issues when using more traditional methods of MFB.
3.3
Combustion Phasing
Combustion phasing is of great importance to the operation of an engine. Combustion phasing provides information to the burn durations and phasing of the durations. The evaluated phasing parameters are described in the following sections.
CA10
The CA 10 is a measure from the ignition timing to the point where 10% of mass has burned in cylinder as determined using the PRn method. The CA 10 is referred to
as the flame development period.
CA10-90
The CA10-90 is the measure of the duration of the 10-90% burn. This is referred to as the main burn duration. The duration is measured to the 90% value as after this the evaluation becomes unreliable for analysis. This is the accepted methodology applied to all engines.
CA90
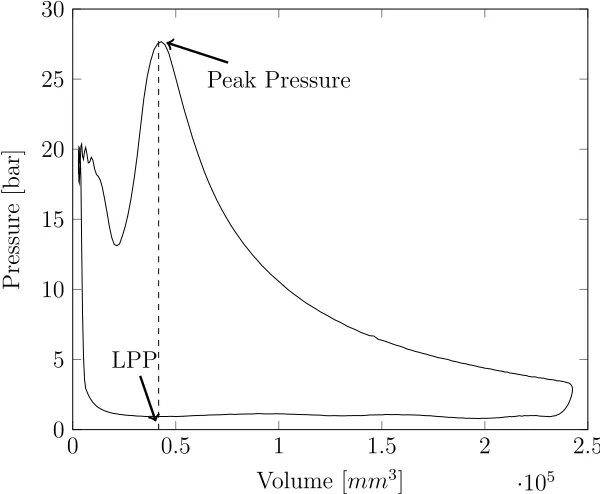
Location of Peak Pressure
The Location of Peak Pressure (LPP) is the absolute crank angle position of the maximum fired pressure. Indication of the combustion phasing and the combustion stability. The LPP and the peak pressure are indicated in Figure 3.2.
0 0.5 1 1.5 2 2.5
·105 0
5 10 15 20 25 30
LPP
Peak Pressure
Volume [mm3]
Pressure
[bar]
Figure 3.2: LPP Measurement Location
3.4
Combustion Stability
Combustion stability is important for the determination of the stability of the engine, especially as the lean limit of operation is approached. The main parameter used to evaluate the stability is the Coefficient of Variation (COV).
Coefficient of Variation
The coefficient of variation (COV) is a statistical measure of the dispersion of a measured value. The COV is used to measure the cycle-cycle variations of various parameters. The COV is the ratio of the standard deviation (σ) normalized with respect to the mean value (x). The formula for the COV is given in Equation 3.6.
%COV = σ
The COV is an accepted indicator of combustion stability [1, 22]. In this work the % COV of the IMEP, and LPP have been used for evaluation.
3.4.1
Lean Limit Definition
As the main focus of this work on this engine is the lean limit of operation, the def-inition of the limit is essential. There is no formal defdef-inition of the lean operating limit of an engine, therefore it is left up to the discretion of the operator. Stone has noted that the typical acceptable limit of COVIM EP ranges from 5-10% [1]. After
this point engine fluctuations become prevalent and can lead to issues with the dura-bility of engine components if run for an extended period of time at this condition. Furthermore, an increase the number of misfires and durations of combustion can be seen as the lean limit of operation is approached.
For this work the author has chosen to define the lean limit at the point when COVIM EP begins to rapidly increase beyond 5%. This point corresponds with an
increase in misfires and COVLP P , as well as the AFR meter reading becomes
unsta-ble. The results pertaining to the stability of operation will be presented later in this work.
3.5
Volumetric Efficiency
The volumetric efficiency is a measure of the amount of fresh air brought into an engine cylinder normalized with respect to the swept volume of the cylinder. This parameter indicates the efficiency of the gas exchange process during the intake stroke. High volumetric efficiency is desired in engines as the more charge brought into the engine, the greater the amount of fuel that can be used, and therefore the greater output that can be achieved. Volumetric efficiency is calculated using Equation 3.7
ηv =
˙ ma
ρ∞VdN
×100% (3.7)
where: ˙
ma = Mass Flow Rate of Air [kg/s]
ρ∞ = Density of Air at Standard Conditions [kg/m3]
Vd = Displacement Volume of Compression Cylinder [m3]
Chapter 4
Engine Operations Benchmark
In this chapter the engine has been tested as configured in previous work[11] and the results will be presented as evaluated by this author. The engine has been tested at engine speeds of 850, 1000 and 1200rpm and best achievable ignition timings for each engine speed. An emphasis is given to the lean limit of operation, with analysis performed by the author. Further discussed in this section is the head gasket failure that occurred and its effects on engine operation.
The best achievable ignition timing(BAT) of this engine is the ignition timing that will provide the greatest work output at stoichiometric conditions and a given engine speed. This value is similar to the minimum advance for best torque value presented in other works on combustion engines. However given the very retarded ignition occurring well after engine TDC, the use of this parameter would not be fully accurate. With the split-cycle the BAT occurs at the ignition timing closest to engine TDC where any further advancement would allow the flame to propagate into the XOVR passage and ignite pre-mixed fuel.
4.1
Operating Characteristics
4.1.1
Indicated Output
0.82 0.84 0.86 0.88 0.9 0.92 0.94 0.96 0.98 1 1.02 0
2 4 6
Equivalence Ratio φ
IMEP
[bar]
850rpm 1000rpm 1200rpm
Figure 4.1: Engine IMEP [bar]
Compared to other state of the art engines the indicated IMEP produced is low. In comparison, an efficient spark ignited engine would have a full load IMEP of above 10 bar [39]. Limitations are attributed to the fact that this is still an experimental engine with several factors limiting load. Changes in valve timing may yield better indicated output and will be explored later in this work. A major limiting factor with this engine is the RPV valve train. Currently the valve will open under high peak pressures, limiting the load. This limits the advancement of ignition under the current operating regime of the engine.
4.1.2
Rates of Combustion
With the split-cycle engine the total burn durations are of great interest. Burn dura-tions are calculated using the PRn method described in the combustion metrics. In
0.82 0.84 0.86 0.88 0.9 0.92 0.94 0.96 0.98 1 1.02 0
10 20 30 40
Equivalence Ratio φ
CA90
[
°
CA]
850rpm θign= 18°AT DC
1000rpmθign = 16°AT DC
1200rpm θign = 16°AT DC
Figure 4.2: CA90
From this figure one can see that fast burn durations can be achieved with the split-cycle engine despite the late ignition. Burn durations of approximately 30°CA have been achieved for a range of equivalence ratios and engine speeds. The duration of combustion does not begin to increase until the equivalence ratio (φ) is less than 0.9. This is evidence of the engine beginning to reach the lean limit of operation.
Flame Development Period and Main Burn Durations
850rpm BA
T
1000rpm BA
T
1200rpm BA
T 0
10 20 30
13.5 14 13.6
14 13.9 15.1
Duration
[
°
CA]
CA 10 CA 10-90
Figure 4.3: Burn Durations at Stoichiometric Conditions and Best Achievable Ignition Timing
From figure 4.3 it is possible to see that each portion of the burn takes roughly half of the total burn duration. The development of the kernel takes a significant portion of the total burn, totaling roughly half the burn. The CA 10-90 suggests that once the flame is a certain size the turbulence is successful at improving rates of combustion. It is believed that the kernel is relatively unaffected by the turbulence until it reaches a critical size at which point the turbulence can wrinkle the flame front and accelerate flame growth.
Comparison to Similar Engines
Table 4.1: Comparison of Split-Cycle Burn Durations to Literature
Authors
Ignition Delay
Main Burn
Total
Rousseau et al. [18]
10
°
40
°
50
°
Johansen & Olsson [23]
14
°
15
°
29
°
Ma et al. [40]
N/A
N/A
43
°
Ma et al.
*[40]
N/A
N/A
30
°
Huang et al. [41]
22.5
°
26
°
48.5
°
Split-Cycle Engine
13.9
°
14
°
27.9
°
* Fuelled with 50% H
2 content
From Table 4.1 one can see that the split-cycle engine is amongst the fastest NG fueled engines in literature. The engines that the split-cycle have been compared to often have combustion enhancing characteristics that the split-cycle does not have. Given examples are turbocharged and have complex combustion chamber geometries leading to enhanced combustion. The work by Johansen & Olsson [23] was able to achieve burn durations similar to the split-cycle engine. This example used a complex combustion chamber with large squish areas to achieve the fast rates of combustion. While this design led to fast combustion rates in a 4-stroke arrangement, the chamber construction is so complex that it would likely not be practical for mass production.
Another example that did achieve similar combustion rates was the second example by Ma et al. [40]. This engine was a dual-fuel engine which was fuelled with hydrogen as well as NG. This arrangement relies on a pilot injection of hydrogen which is used to ignite the mixture. Since hydrogen is a faster burning fuel, shorter burn durations can be achieved when using dual fuel strategies. This result shows how impressive the split-cycle burn durations are, given that comparable durations are achieved despite not using this enrichment.
4.1.3
Combustion Stability
The overall combustion stability of the split-cycle engine is on average for well running spark ignited engines near stoichiometric operating conditions (2-3% COVIM EP) [1].
For the tested best achievable ignition timings theCOVIM EP remains under 3%. The
COVIM EP for the tested ignition timings from stoichiometric to the lean operating
limits is given in Figure 4.4.
0.82 0.84 0.86 0.88 0.9 0.92 0.94 0.96 0.98 1 1.02 0
5 10 15 20
Equivalence Ratio φ
C
O
VI
M
E
P
[bar]
850rpm θign= 18°AT DC
1000rpmθign = 16°AT DC
1200rpm θign = 16°AT DC
Figure 4.4: COVIM EP at tested ignition timings
As can be seen from the figure COVIM EP will remain under 5% for the equivalence
0.82 0.84 0.86 0.88 0.9 0.92 0.94 0.96 0.98 1 1.02 0
5 10 15 20 25 30
Equivalence Ratio φ
C
O
VLP
P
[bar]
850rpm θign= 18°AT DC
1000rpmθign = 16°AT DC
1200rpm θign = 16°AT DC
Figure 4.5: COVLP P at tested ignition timings
As with the COVIM EP, the COVLP P only begins to increase at φ < 0.9. Before this
limit is reached the COVLP P remains below 10%. After this point the COV begins
to increase until the lean limit of operation is reached around φ ≈ 0.85. The engine can not be run at leaner equivalence ratios than those presented as the number of misfires increase and stability decreases to the point where the engine can not be run without potential damage occurring.
Overall the Coefficient of Variation (COV) for the engine near stoichiometric are on par for spark ignited engines. With the late ignition timing and large amounts of in-cylinder turbulence it was believed that the split-cycle may suffer from unstable combustion, however the results at stoichiometric operating conditions do not indi-cate this.
Of interest from these results is the lean limit of operation. Typical spark ignited NG engines can run at equivalence ratios ofφ ≈0.6, significantly leaner than that of the split-cycle engine [6, 18, 24]. The proposed reason for this higher than expected lean limit are explored in Section 4.2
4.1.4
Volumetric Efficiency
to the volumetric efficiency of the Kubota Z482 it is based off of, this is a significant reduction. Volumetric efficiency ranges from 80-90% with the stock Kubota engine, meaning that the split-cycle has a large drop in volumetric efficiency when compared to normal 4-stroke operation. It should be noted that poor volumetric efficiency is a characteristic of the split-cycle type designs and is a noted obstacle to achieve high overall efficiencies with such poor volumetric efficiency.[42].
4.2
Lean Limit of Operation
The lean limit of operation can be attributed to two effects caused by the operation of the split-cycle engine. The first one is the effects of early exhaust valve closure in the engine. The second is the effects of turbulence which were previously attributed as the leading cause of the high lean limit in this engine.
4.2.1
Exhaust Valve Timing Effect on Lean Limit
To understand the effect of the exhaust valve closing (EVC) on the engine performance one has to first understand the valve timing of the combustion cylinder. The nominal valve timings are given in Table 4.2. Due to fluid boundary layers, the valve must be open a certain amount before the flow can pass through the valve. This results in fluid quenching which changes the effective valve opening and closing times.
Table 4.2: Nominal Expansion Cylinder Valve Timings
Valve Opening Centerline Closing
XOVR Outlet 15°BTDC 6°ATDC 27°ATDC
Exhaust Valve 21°BBDC 108°BTDC 12°BTDC
Figure 4.6: Pressure Trace Highlighting the EVC
As the valve timing is set at 12°BTDC, some of the combustion products are trapped in the cylinder for each cycle. This is evidenced by the pressure rise which occurs after valve closes and before engine TDC. Given the location of the pressure rise it has been determined by the author that the valve is effectively closed around 30°BTDC due to fluid effects. The effective valve timing is defined as the point where the in-cylinder pressure exceeds the measured exhaust pressure. It is conservatively estimated using ideal gas assumptions that the engine is operating with 15-25% of the mass of com-bustion products trapped per cycle. This trapped mass acts similarly to Exhaust Gas Recirculation (EGR), slowing down the rate of combustion in the following cycle and making mixtures harder to ignite [43].
leading cause of the higher-than-expected lean limit of operation. The amount of IGR in this engine (15-25%) is excessive for engine operation. Typical amounts of EGR for NG engines range from 12-20% before becoming detrimental to combustion [44, 45].
The second reason this amount of IGR can be detrimental to the engine is that the mass trapped in-cylinder restricts the amount of fresh charge brought into the cylin-der during each cycle. Typical engines rely on valve overlap to ensure that all the exhaust products are removed from the cylinder after each cycle [1]. Since valve overlap does not result in combustion products removed from the cylinder, the fresh mixture transfer from the XOVR is limited, therefore limiting the engine performance.
The problems presented by the early valve closure and high IGR will be addressed with two new strategies in this work. The first way is with the use of alternative ignition strategies as discussed in Chapter 5. The second way this will be evaluated is with a change in EVC timing in order to vary the amount of trapped mass. This will be explored in the results of Chapter 6.
4.2.2
Turbulence Effect on Lean Limit
The second feature of the split-cycle that will contribute to the lean limit of the engine is the amount of turbulence at the time of ignition. Various works have shown the effect of increasing turbulence intensities on ignition, both in IC engines and other combustion setups. In the work of Shy et al. [46] kernel development was studied under increasing turbulence intensity, showing increasing ignition difficulty with high intensities. Given the high amount of turbulence generated by the split-cycle engine architecture this may contribute to the high lean limit. Work by Atibeh at al. [47] studies lean limit ignition in an experimental engine. Their work concluded that with lean and dilute mixtures the probability of flame quench increased with increasing in-cylinder turbulence levels. Given the excessive amount of turbulence in the split-cycle when compared to typical IC engines it is possible to suggest that the turbulence can lead to flame quenching during kernel development.
eddies can wrinkle the flame front leading to enhanced flame growth. At this point it is not possible for an eddy to extinguish the flame.
In order to deal with the large amounts of in-cylinder turbulence alternative ignition strategies that deposit more energy to kernels are explored in Chapter 5. With this strategy an increase in energy will result in greater stability in the case of lean turbulent mixtures.
4.3
Head Gasket Failure
During routine testing of the split-cycle engine it was noted that operation was de-teriorating. The COV of the engine kept increasing compared to previous tests and misfires occurred more frequently, even at stoichiometric equivalence ratios. The cause of these misfires was determined to be excessive oil leakage caused by a failed engine head gasket. The engine gasket that failed is the copper gasket located between the two pieces of the engine head. This gasket is required for sealing the crossover passage, cooling and oil passages. An analysis of the failure of the gasket is given, followed information on the re-design of the new copper head gasket. Finally, an assessment of the engine operation with the failed gasket is given with results compared to the new, properly functioning gasket.
4.3.1
Evidence of Gasket Failure
Fouled Spark Plug
Figure 4.7: Bridged Spark Plug
This was initially a perplexing thing to occur with the split-cycle engine. Gaseous fuels such as NG do not typically form solid particulate when burning, making a bridged spark plug a completely unexpected. This solid build up was determined to be caused by a leakage of oil that had made its way into the combustion cylinder and undergoing incomplete combustion resulting in the carbon build up discovered on the spark plug.
Decreasing Combustion Stability
4.3.2
Head Gasket Failure
Failed Head Gasket
Upon removal of the engine head it was evident that a complete failure of the head gasket had occurred. Mass leakage of oil was evident in both the lower parts of the engine head and on the gasket itself.
Evidence of the leakage was easy to spot on the engine head. The crossover passage was coated with a carbon build up. In the coolant passages there was a sludge build up that is evidence of the mixing of lubricating oil and engine coolant. Figure 4.8 shows the lower portion of the head after removal from the engine.
Figure 4.8: Lower head portion after removal
of the particulate entering the combustion chamber can be seen on the engine head around the combustion chamber. The combustion chamber after removal from the engine can be seen in Figure 4.9.
Figure 4.9: Cylinder Head exposed to Combustion Chamber
4.3.3
Head Gasket Re-Design
Failure Analysis
An analysis of the failed copper gasket was conducted. Figure 4.10 shows the XOVR side of the failed gasket with key points of failure annotated .
1
O
1
O
O
1
2
O
3
O
O
3
O
A
A
O
Figure 4.10: Failed Gasket on side exposed to XOVR
These three key areas of the failure are:
1. Coolant Passages: On the gasket the passages are dark, discoloured and covered with a sludge.
2. XOVR Passage: Coated with soot on both sides of gasket. Pressure reaches the back side of the gasket through valve stem clearance holes. This pressure reaching the back side of the gasket may be a location for failure propagation to begin.
Gasket Re-Design
When re-designing the gasket three criteria were developed.
1. Maximize the sealing area between the XOVR and any other features
2. Minimize the surface area of the gasket, increasing the average pressure through-out the clamped areas
3. Remove any areas where pressure can enter the backside of the gasket leading to propagation
With these criteria in mind the gasket was modified with reference to Figure 4.10. The clearance holes for the valves were reduced, giving more material in the areas indicated 3O. All material has been removed from the XOVR in area 2O in order to minimize the chance of the pressure propagating from underneath the gasket. Material around the coolant passages 1Owas left in the revised gasket design in order to prevent coolant from corroding the aluminium upper head. Material was removed from areas indicated AO in order to reduced the clamped area and increase pressure in the rest of the gasket. A new gasket was manufactured out of a sheet of 1mm thick copper sheet. After manufacturing the surface was run over with a stone in order to minimize any burs near the edges. The new gasket is shown in Figure 4.11.