ABSTRACT
MCNUTT, MAXWELL TANOA. Development of a Surrogate Machining System to Study Dry Turning of Plutonium. (Under the direction of Dr. Thomas A. Dow).
To reduce time and costs (300,000 usd/ft^3) associated with disposing of cutting fluids used to machine radioactive materials like plutonium, dry machining is being investigated at Los Alamos National Laboratory (LANL). However, such soft radioactive materials present machinability issues when a cutting fluid is not used. Under dry conditions, extreme heat causes the already ductile and reactive plutonium chips to become extremely “sticky” or “gummy.” This stickiness results in a phenomenon known as chip seizure. This occurs when the chip adheres to the rake face of the tool, altering the flow of material away from the part and damaging the machined surface, leading to poor surface finish. Due to the scarcity and hazardous nature of plutonium, the first phase of this project was to identify a surrogate metal that could be studied in its place.
the rake face of the tool. These videos also provided evidence that chip seizures occur in a cyclic manner, as described by Ashoktov [24].
Next, a single factor parameter study was conducted on 1199 aluminum to learn how each machining parameter effects the process of chip seizure and therefore surface roughness. While the exact optimized parameters of machining experiments for 1199 aluminum are likely not optimized for plutonium, general trends to reduce the presence of chip seizures are likely to be applicable to any material that tends to seize to the tool. Parameters of interest were rake angle, cross-feed, depth of cut, cutting speed and tool coating. All cutting tools were Kennametal V-Series carbide inserts, like those used at LANL.
After conducting three experiments at each set of parameters it was determined that high positive rake angles, large cross feeds, large depths of cut, and higher cutting speeds were found to reduce chip seizures and improve surface finish on 1199 aluminum. This result is due to decreased shear strain at high rake angles, increased chip stiffness at large feeds and depths, and decreased rake face friction at higher cutting speeds. Tool coatings did not make a significant impact on surface finish.
Development of a Surrogate Machining System to Study Dry Turning of Plutonium
by
Tanoa Maxwell McNutt
A thesis submitted to the Graduate Faculty of North Carolina State University
in partial fulfillment of the requirements for the degree of
Master of Science
Mechanical Engineering
Raleigh, North Carolina 2019
APPROVED BY:
_______________________________ _______________________________ Dr. Paul Cohen Dr. Gracious Ngaile
_______________________________ Dr. Thomas Dow
BIOGRAPHY
ACKNOWLEDGMENTS
First off, thank you to my parents Cam McNutt and Stacey Hodges for grooming my interests in engineering from a very young age, providing unwavering support throughout my entire life, and being the best role models I could ever hope for.
Thanks to Dr. Dow for providing me this opportunity to work under him at the PEC, and happily sharing your wealth of experience in precision manufacturing, as well as how to conduct research in a university environment.
Thanks to Dr. Ngaile for serving on my advisory committee
Thanks to Dr. Cohen for your guidance and seemingly endless knowledge of metal cutting Thanks to Anthony Wong for providing me your experienced insight on life as a graduate student, complex engineering problems, and barbecue.
Thanks to Ken Garrard for providing numerous analytical tools designed to decipher complex data sets and your experience to make almost anything on a diamond turning machine.
TABLE OF CONTENTS
List of Figures ... viii
List of Tables ... xii
1. Background ... 1
1.1 Introduction to Lathes and Turning ... 1
1.2 Single-Point Turning Process ... 3
1.2.1 Orthogonal Cutting Mechanics ... 4
1.3 Chip Cross-Section ... 7
1.3.1 Post Cut Chip Measurement ... 8
1.3.2 Rq and PV Measurements ... 10
1.3.3 Parabolic Model for Theoretical Surface Roughness ... 10
1.3.4 Real Surface Roughness vs Theoretical Surface Roughness ... 11
1.4 Material Properties and Machining Behavior of Plutonium ... 11
1.4.1 Metallurgy and Allotropes of Plutonium ... 11
1.4.2 Material Properties of Stabilized δ Phase Plutonium... 12
1.4.3 Machining Behavior of δ Phase Plutonium ... 14
1.4.4 Dead Metal: Built-Up-Edge versus Seized Chips ... 16
2.1.2 Nanoform 600 Diamond Turning Machine ... 22
2.2 Machining Force Measurement ... 23
2.2.1 Drift Correction ... 25
2.3 Surface Finish Measurement ... 27
2.3.1 Non-Overlapping Facing: Detection of Dead Metal ... 29
2.3.2 Spectral Analysis of Machined Surfaces ... 32
2.4 Tool Inspection ... 35
3. Search for a Surrogate Material ... 38
3.1 Testing of Surrogate Materials ... 40
3.1.1 OFHC Copper ... 41
3.1.2 1100 Aluminum Testing ... 44
3.1.3 1199 Aluminum Testing ... 45
3.1.4 Surrogate Machining Results- Non Overlapping Feed ... 47
3.2 1199 Aluminum- Overlapping Feedrate and Surface Roughness ... 48
4. Chip Seizure Cycle ... 53
5. Optimization of Machining Parameters for Surface Roughness on Aluminum ... 60
5.1 Rake Angle Experiments ... 60
5.1.1 Surface Roughness ... 61
5.1.2 Machining Forces... 63
5.2 Tool Coating Experiments ... 66
5.2.1 Kennametal Tool Coatings [26] ... 67
5.2.2 Surface Roughness ... 68
5.2.3 Machining Forces... 69
5.2.1 Surface Spectral Analysis ... 70
5.3 Depth of Cut Experiments ... 72
5.3.1 Surface Roughness ... 72
5.3.2 Machining Forces... 74
5.3.3 Surface Spectral Analysis ... 75
5.4 Cutting Speed Experiments ... 77
5.4.1 Surface Roughness ... 78
5.4.2 Machining Forces... 78
5.4.3 Surface Spectral Analysis ... 80
5.5 Cross-Feed Experiments ... 82
5.5.1 Surface Roughness ... 83
5.5.2 Machining Forces... 85
5.5.3 Surface Spectral Analysis ... 85
6. Conclusions ... 88
LIST OF FIGURES
Figure 1-1. Late 19th century Hendey lathe [3] ... 2
Figure 1-2. Nomenclature for single point turning [6] ... 4
Figure 1-3. Orthogonal cutting ... 5
Figure 1-4. Force components for orthogonal cutting [7]... 6
Figure 1-5. Uncut chip cross section [11] ... 7
Figure 1-6. Surface finish for single point machining [10] ... 8
Figure 1-7. Micrograph of a semielliptical chip cross-section ... 9
Figure 1-8. Allotropes of plutonium-gallium alloys [4] ... 12
Figure 1-9. Stress-strain plot of delta plutonium [15]... 13
Figure 1-10. Dead metal mass of plutonium seized to the carbide turning insert [2] ... 15
Figure 1-11. Poor surface finish that is common on machined plutonium components [1] ... 15
Figure 1-12. Dead metal contacts the machined surface ... 16
Figure 1-13. Built-up edge ... 17
Figure 1-14. Chip seizure ... 18
Figure 2-1. Kennametal V-series carbide inserts used in surrogate experiments ... 20
Figure 2-2. Multi-view drawing of V-series inserts, units in mm [16] ... 21
Figure 2-3. Nanoform 600 diamond turning machine setup used in experiments ... 22
Figure 2-4. Kistler load cell used for all force measurements [18] ... 24
Figure 2-5. Force data as collected, no drift correction ... 26
Figure 2-9. Surface produced by a round-nosed tool without a BUE or seizure [18] ... 30
Figure 2-10. Surface produced by a round-nosed tool with a BUE [18] ... 31
Figure 2-11. Surface produced by a round-nosed tool with a seizure ... 31
Figure 2-12. Frequency-magnitude plot of a surface with dead metal defects ... 33
Figure 2-13. Machined surface corresponding with Figure 2-12 ... 34
Figure 2-14. Frequency-magnitude plot of a surface with few of dead metal defects ... 35
Figure 2-15. Cutting edge of a V-series insert on the SEM ... 36
Figure 2-16. Schematic of tool removing a chip from the workpiece [20]... 37
Figure 2-17. 100x view of the V-series cutting tool ... 37
Figure 3-1. MSS for the four metals considered ... 40
Figure 3-2. Three grooves in OFHC copper turned with tool 1 ... 42
Figure 3-3. Tool 1 after turning a non-overlapping face on OFHC copper ... 43
Figure 3-4. Three grooves in 1100 aluminum turned with tool 1 ... 44
Figure 3-5. Tool 1 after turning a non-overlapping face on 1100 aluminum ... 45
Figure 3-6. Three grooves in 1199 aluminum turned with tool 1 ... 46
Figure 3-7. Tool 1 after turning a non-overlapping face on 1199 aluminum ... 47
. Figure 3-8. Surface profile of 1199 aluminum turned with tool 2 ... 49
Figure 3-9. Video evidence of the smooth chip flow experienced to the right of the 20 mm radius line on Figure 3-8 ... 50
Figure 3-10. Video evidence of the chip seizure experienced to the left of the 20 mm radius line on Figure 3-8 ... 51
Figure 4-2. Geometry of the cutting process with a fixed tool – phase 1. No seizure of chip
to the tool ... 54
Figure 4-3. Due to high temperature and pressure at the chip/tool interface, the chip becomes welded to the tool. As a result, the tool/chip becomes the “new” tool. Forces and part roughness will increase. ... 55
Figure 4-4. After the chip is welded to the tool, a new flow process begins with the workpiece coming in from the right ... 56
Figure 4-5. In phase 3, the chip is stuck to the tool ... 57
Figure 4-6. The motion of the incoming metal ejects the dead metal region and starts a new chip. ... 58
Figure 4-7. The image of a chip generated cutting 1199 aluminum. ... 58
Figure 5-1. Surface roughness and shear plane angle as a function of rake angle ... 62
Figure 5-2. Shear strain as a function of rake angle ... 62
Figure 5-3. Machining forces as a function of rake angle ... 63
Figure 5-4. Fourier spectrum for the surface machined with a +3° rake angle ... 64
Figure 5-5. Fourier spectrum for the surface machined with a +15° rake angle ... 65
Figure 5-6. Surface roughness and shear plane angle for all 6 tool coatings... 69
Figure 5-7. Machining forces for all 6 tool coatings ... 70
Figure 5-8. Fourier spectrum for the surface machined with a KC5010 coating ... 71
Figure 5-9. Fourier spectrum for the surface machined with a KC5410 coating ... 71
Figure 5-10. Surface roughness and shear plane angle as a function of depth of cut ... 73
Figure 5-13. Fourier spectrum for the surface machined with a 20µm depth of cut ... 75
Figure 5-14. Fourier spectrum for the surface machined with a 120 µm depth of cut ... 76
Figure 5-15. Surface roughness as a function of cutting speed ... 78
Figure 5-16. Machining forces as a function of cutting speed ... 79
Figure 5-17. Coefficient of friction as a function of cutting speed ... 80
Figure 5-18. Fourier spectrum for the surface machined with a 0.5 m/s cutting speed ... 80
Figure 5-19. Fourier spectrum for the surface machined with a 2 m/s cutting speed ... 81
Figure 5-20. Surface fidelity and shear plane angle as a function of cross feed ... 83
Figure 5-21. Surface finish as a function of chip stiffness ... 84
Figure 5-22. Machining forces as a function of cross feed ... 85
Figure 5-23. Fourier spectrum for the surface machined with a 20µm/rev cross feed ... 86
LIST OF TABLES
Table 1-1. Mechanical properties of delta phase plutonium [15] ... 13
Table 1-2. Thermal properties of delta plutonium [15] ... 14
Table 2-1. Timeline of analytical methods ... 19
Table 2-2. Geometry of carbide tools [16]... 21
Table 2-3. Control machining parameters used on 1199 aluminum [17] ... 23
Table 2-4. Specifications for Kistler 50993 load cell [11]... 25
Table 2-5. Settings for Kistler 50993 load cell ... 25
Table 3-1. Material properties of potential surrogates and plutonium [22] ... 39
Table 3-2. Feeds and speeds used in surrogate machining experiments... 41
Table 3-3. Surrogate machining results ... 48
Table 3-4. 1199 aluminum surface roughness at LANL machining parameters ... 51
Table 5-1. Machining parameters used for rake angle experiments ... 61
Table 5-2. Parameters used for tool coating experiments ... 66
Table 5-3. Parameters used for depth of cut experiments ... 72
Table 5-4. Parameters used for cutting speed experiments... 77
1.
BACKGROUND
This project investigates possible techniques to machine plutonium (Ga-alloyed, δ phase) [1] without the use of cutting fluid. Dry machining presents Los Alamos National Laboratory (LANL) with an opportunity to reduce time and costs associated with separating and disposing of radioactive mixed waste that is a byproduct of machining plutonium with a coolant or lubricant [1]. Unfortunately, dry machining also presents a challenge: how to prevent soft materials such as plutonium from “sticking” to the tip of the tool [1]. This sticking behavior ultimately leads to poor surface finish [1]. Since plutonium is a controlled material and is highly hazardous to handle and machine, another material must be studied in its place. This surrogate material should behave similarly to plutonium when being machined without cutting fluid. This means that using similar feeds and speeds to those used at Los Alamos, the surrogate material should show signs of adhesion to the cutting tool and the subsequent poor surface finish on the machined part.
1.1
Introduction to Lathes and Turning
In the world of machine tools, the lathe is likely the oldest form [2]. Due to its relative simplicity, lathes are easier to construct than many modern machine tools such as milling and grinding machines. Even in its simplest form, lathes can be used to create complex geometries, so long as they are rotationally symmetrical. Force example, some decorative turned bowls discovered in Etruscan tombs have been dated to the 6th century BC [2].
While lathes had been used for thousands of years, their modern application as a shop floor workhouse burgeoned during the industrial revolution of the early 19th century [2]. At the time,
roundness not previously possible in manufacturing. Figure 1-1 shows a drawing of an early lathe that could have been used to produce a part such as a gun barrel or a pool cue.
Figure 1-1. Late 19th century Hendey lathe [3]
Though modern turning centers are much more precise, powerful, efficient and versatile than the Hendey Lathe, the basic principle remains the same. The spinning workpiece is fixed to the chuck, while the non-rotating tool is moved through the spinning workpiece to remove a chip and yield the final, rotationally symmetric surface. Machining with a lathe is called turning.
features enable for excellent surface finish and low form error on machined parts. As an example, DTMs at the PEC have been used in to create precision optics for space telescopes.
In a research context, turning offers a unique opportunity to study the underlying physics of chip formation. This is because the tool is stationary relative to the workpiece and can be monitored and modeled as a static structure. The Nanoform 600 DTM was the machine tool used as a tool to study dry machining in this thesis.
1.2
Single-Point Turning Process
After the plutonium at LANL is cast, the part must be machined into its final shape. This allows LANL to achieve form errors and surface finish not currently feasible with a production casting or forming process at the lab [4]. This machining process can be described as single-point turning since a lathe is used and only one cutting edge contacts the workpiece. This is also the process used at the PEC in this thesis.
Figure 1-2. Nomenclature for single point turning [6]
Depth of cut (h), feed rate (f) and cutting velocity (Vc), shown in Figure 1-2, are set by the machinist and are largely determined by the work material, tool material, desired surface roughness, and machine power available. These parameters have a large influence on the surface finish of the final machined part. The specific effects of each will be studied in this thesis.
All turning operations in this thesis are classified as facing cuts. This means that the tool feeds from the outer diameter of a disc-shaped part to the center, creating a machined face on the surface orthogonal to the machine “Z” axis. If the tool is located on the “Y” axis center line of the disc, then this process can be effectively considered an orthogonal turning operation.
1.2.1 Orthogonal Cutting Mechanics
Figure 1-3. Orthogonal cutting
In the 1940s, Ernst and Merchant modeled the chip formation process in its simplest form. Assumptions made by Ernst and Merchant were that the chip formation process plane stress, plane strain, no work hardening, one plastic zone, and perfect sliding at the tool-chip interface [7]. In reality, all of these assumptions are over-simplified, but this model provides an intuitive method to think about the chip formation process in metal cutting.
Figure 1-4 shows a schematic of the chip formation proposed by Ernst and Merchant. These forces can be broken into three sets, with respect to the: cutting velocity (Fc and Ft), rake face (Fn and Ff), and the shear plane (Fs and Fns). The vector summation of each of these three sets will form the same resultant force (Fr) acting on the tool. By Newton’s laws of motion, it is deduced that each force has an equal opposite force being projected on the workpiece by the tool, these reaction forces lead to the plastic deformation and fracture that result in chip formation.
Figure 1-4. Force components for orthogonal cutting [7]
𝐹𝑡 and 𝐹𝑐 can be measured directly via a load cell. 𝐹𝑓 and 𝐹𝑛 can then be calculated from Ft and Fc since the tool has a known rake angle, ϕ. Equations (1.1) and (1.2) can be used to calculate 𝐹𝑓 and
𝐹𝑛 [8].
𝐹𝑓 = 𝐹𝑐 + 𝐹𝑡tan(∝) (1.1) 𝐹𝑛 = 𝐹𝑐 − 𝐹𝑡tan(∝) (1.2)
𝐹𝑠 and 𝐹𝑠𝑛 are more difficult to calculate since the shear plane angle is difficult to precisely locate. The shear plane can be defined as the shortest plane connecting the tool tip to the free surface.
of the shear plane angle is possible. One method of approximately measuring the shear plane angle is collecting chips and measuring their thicknesses with micrometers, since the depth of cut and rake angle are known quantities. Equation (1.3) describes this relationship [8].
𝜑 = 𝑡𝑎𝑛−1( 𝑟𝑐𝑜𝑠(𝛼)
1−𝑟𝑠𝑖𝑛(𝛼)) , 𝑟 = 𝑎𝑐
𝑎0 (1.3)
Shear plane angle relates to the amount of shear strain occurring during chip formation [8]. Cohen proposes the amount of shear strain can relate to the surface finish of the machined part [9]. The method for determining chip thickness is detailed below in Section 1.3.1.
1.3
Chip Cross-Section
With a round nosed tool, the geometry of the un-cut chip like shown in Figure 1-2 can be described by the drawing in Figure 1-5. Notice how the thickness at the far right and left-hand corners is zero. Since this cannot be achieved, it is a limiting factor for surface roughness [10]. Figure 1-6 proposes how this property of the chip will alter surface roughness.
Figure 1-6. Surface finish for single point machining [10]
PV in Figure 1-6 is the measured peak-to-valley surface roughness of this machined surface. PVt represents the theoretical peak-to-valley surface roughness that would be expected from the prescribed tool radius and cross-feed. This difference is described by Arcona [10] as the Minimum Chip Thickness (MCT) for the given cutting tool. This minimum chip thickness was also described by Albrecht [12] as “thickness of bite”. When the uncut chip thickness is smaller than this “thickness of bite”, the cutting edge will push the material into the workpiece rather than removing it in the chip. After the tool has passed, this “ploughed” material will spring back, resulting in the features labeled “minimum chip thickness” in Figure 1-6. In a machining context, the term ploughing was introduced by Albrecht [12] in 1960 to describe the effects of the imperfect cutting tool.
1.3.1
Post Cut Chip Measurementas shear plane angle and chip flow velocity can be evaluated. Changes in these parameters could potentially be symptomatic of chip formation issues such as BUE or chip seizure.
Figure 1-7. Micrograph of a semielliptical chip cross-section
𝐴 =𝜋2(CT)(CW)
(1.4)
𝑀𝑅𝑅 = 𝑣𝑠𝑢𝑟𝑓𝑎𝑐𝑒𝑓𝑑 = 𝑣𝑐ℎ𝑖𝑝𝜋2(CT)(CW)
(1.5)
Equation (1.4) describes the relationship between chip thickness (CT), chip width (CW) and Chip Cross Sectional Area (𝐴). The Material Removal Rate (𝑀𝑅𝑅) is related to known input parameters, Surface Speed (𝑣𝑠𝑢𝑟𝑓𝑎𝑐𝑒), Crossfeed (𝑓), and Depth of Cut (𝑑). By assuming that chip volume is conserved during the chip formation process, Equation (1.5) can be derived. From Equation (7), Chip velocity ( 𝑣𝑐ℎ𝑖𝑝), can be calculated.
Chip were collected at the onset of the cut and at the conclusion of the cut. The average of the two chips width and thickness are the reported values for each experiment. The maximum chip thickness measurements were done with micrometers, while width measurement was done via an optical microscope. As shown in Figure 1-7.
1.3.2 Rq and PV Measurements
After a part is machined, its surface roughness can be measured to determine the quality or finish of the part. To quantify the bulk surface roughness or figure error of a machined part, many metrics can be used. Two of the most common are peak-to-valley (PV) and root-mean-square (Rq). PV simply represents the elevation difference between the highest single point on the surface and the lowest single point. This is a quick and easy way to quantify surface roughness but fails to summarize the characteristics of the surface at large, since it considers only two data points. Rq is a better measure of bulk surface roughness since it represents a mathematic average of every measurement point on a surface. The formula to calculate Rq roughness from a dataset is shown in Equation (1.6) [13].
𝑅𝑞= √1𝐿∫ 𝑍0𝑙 2(𝑥)𝑑𝑥 (1.6)
1.3.3 Parabolic Model for Theoretical Surface Roughness
𝑃𝑉𝑡 = 𝑓 2
8𝑅 (1.7) 𝑅𝑞𝑡 = 𝑓
2
26.6𝑅 (1.8)
1.3.4 Real Surface Roughness vs Theoretical Surface Roughness
Real machining operations do not generate the theoretical surfaces described by Equations 1.7 and 1.8. Surface finish from single point turning is affected by many factors which sum up to give the actual surface roughness. Researchers at the PEC [11] have identified the following factors to have an effect on the machined surface finish.
• Machine Vibrations
• Tool Wear
• Tool Geometry
• Built up Edge
• Ploughing
• Lubrication
Equations 1.5 and 1.6 can be used as a lower bound for machined surface roughness, but often are offer poor estimates for real machined surfaces [9].
1.4
Material Properties and Machining Behavior of Plutonium
Before any surrogates for plutonium were identified or tested, the metallurgy, material properties and physical description of dry machining were examined.
1.4.1 Metallurgy and Allotropes of Plutonium
alloying it with gallium [4]. Depending on the percentage of gallium and the temperature, the metal can take on the form of 11 different allotropes [4]. These allotropes are shown in Figure 1-8. The delta phase of the Pu-Ga alloy is shown in grey, it was the allotrope of interest for this thesis. This particular allotrope is used in plutonium production operations because of its stability at room temperature, high plutonium content and its ability to be cast [4].
Figure 1-8. Allotropes of plutonium-gallium alloys [4]
In its stabilized delta phase, the plutonium alloy has a face-centered-cubic (FCC) crystal structure [4]. Data with regards to the grain structure of the metal used at LANL was not available.
1.4.2 Material Properties of Stabilized δ Phase Plutonium
interesting mechanical properties; it is dense and soft, similar to gold, but has tensile strain properties similar to pure aluminum, a very lightweight metal. These properties are shown in Table 1-1. Figure 1-9 shows the similar tensile behavior of δ phase plutonium and pure aluminum.
Table 1-1. Mechanical properties of delta phase plutonium [15]
ρ (𝒄𝒎𝒈𝟑) Hardness (Hv) 𝝈𝒚𝒊𝒆𝒍𝒅 (MPa) 𝝈𝒖𝒍𝒕𝒊𝒎𝒂𝒕𝒆 (MPa) E (GPa)
19.8 45 110 130 43
Figure 1-9. Stress-strain plot of delta plutonium [15]
displayed in Table 12 combination with its high density, give plutonium a very low thermal diffusivity, similar to a nickel superalloy like Inconel.
Table 1-2. Thermal properties of delta plutonium [15]
k (𝑾
𝒎𝑲) c (
𝑱
𝒈𝑲) α (
𝒎𝟐 𝒔 )
0.84 0.13 4.0e-6
1.4.3 Machining Behavior of δ Phase Plutonium
Figure 1-10. Dead metal mass of plutonium seized to the carbide turning insert [2]
It can be seen in Figure 1-10 that the dead metal forms a blockage on the cutting edge of the tool. Essentially, the dead metal zone has dulled the edge of the carbide tool, which will result in more ploughing effects [5]. The tool in Figure 1-10 created the turned plutonium surface shown in Figure 1-11.
Figure 1-11. Poor surface finish that is common on machined plutonium components [1]
The turned surface in Figure 1-11 has many dark scars. These are the result of the dead metal on the tool, either by contact to the machined surface or by increased ploughing effects. Figure 1-12 shows the geometry of where this material transfer occurs. Even a small amount of
Vc
Cutting Edge
material transfer back to the machined surface can result in scarring and poor surface finish. Ploughing’s effects on surface roughness are described in Figure 1-6.
Figure 1-12. Dead metal contacts the machined surface
1.4.4 Dead Metal: Built-Up-Edge versus Seized Chips
Figure 1-13. Built-up edge
The other form of dead metal is called a chip seizure. Trent describes that “Under seizure conditions, it can no longer be assumed that relative movement takes place at the interface [8].” Figure 1-14 shows this phenomenon. Notice how the chip itself is the dead metal. This is in contrast to a BUE where the chip flows over the dead metal zone. This sort of feature would be expected in pure metals rather than alloys.
Depth of Cut
Chip
Tool
W
o
Figure 1-14. Chip seizure
In the remainder of the thesis, metals will be machined and investigated for their ability to form either of these dead metal features, which will indicate similarity to δ phase plutonium.
2.
EXPERIMENTAL SETUP, MEASUREMENT METHODS, AND
ANALYTICAL APPROACH
In traditional machining, a cutting fluid is used to lower temperatures, reduce friction and increase the quality of the machined surface. However, due to excessive disposal costs associated with plutonium ($300,000 per cubic foot [5] LANL is attempting to remove it from the machining process. For this reason, all machining experiments in this thesis were conducted “dry” or without the presence of a cutting fluid.
Machining experiments in this thesis were designed to achieve one of three goals; understand the fundamental difficulties of dry machining, identify a suitable surrogate metal to study in the place of plutonium, and optimize machining parameters on this surrogate metal. For each experiment, forces were measured, footage was captured, the tool was imaged, and the machined surface was measured.
Table 2-1 details the general framework for when measurements were made relative to the machining operation. All of these measurements can provide insight into the presence or lack of dead metal on the tool during a machining operation.
Table 2-1. Timeline of analytical methods
Time Measurement Process Measurement Device
During Machining Force Measurement Kistler Load Cell
During Machining Filming SuperEyes Camera
After Machining Tool Imaging Quanta FEI SEM
2.1
Tooling and Machining Setup
Every experiment, regardless of its goal, was a lathe facing operation, used off the shelf turning inserts, no cutting fluid and was on the same machine, the Nanoform 600 Diamond Turning Machine (DTM).
2.1.1 Carbide Inserts
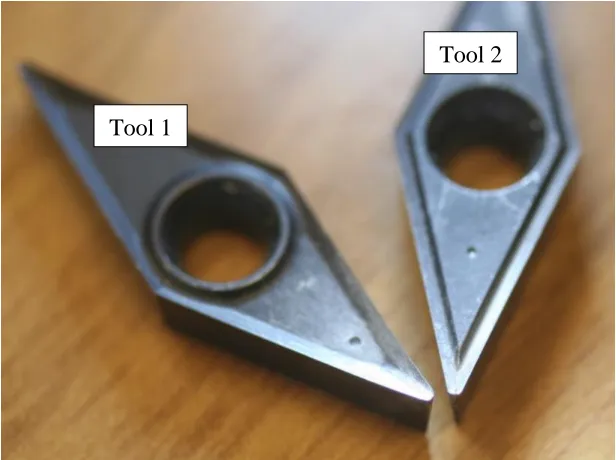
Two different carbide tool geometries were used during the study. Both were Kennametal V-Series carbide inserts, identical to those used for turning plutonium at LANL [1]. Figure 2-1 shows a side by side comparison of the two tool geometries. Figure 2-2 shows the general geometry of a Kennametal V-Series carbide tool, without the specific tool chip geometry. Carbide tools will be referenced by their tool number defined in Table 2-2. Rake angle is defined in Figure 1-4 as α. Convention says that the tool shown in Figure 1-4 has a positive rake angle [7]. The differences in the two geometries are highlighted in Table 2-2.
Tool 1
Figure 2-2. Multi-view drawing of V-series inserts, units in mm [16]
Table 2-2. Geometry of carbide tools [16] Tool
Number Manufacturer Model No.
Nose Radius
(mm)
Rake Angle
(°)
Chip Breaker
(yes or no)
1 Kennametal VBGT331HP 0.4 15 no
2 Kennametal VBGT331LF 0.4 5 yes
2.1.2 Nanoform 600 Diamond Turning Machine
During each machining experiment, the carbide turning insert was fed inward from the outside radius of the surrogate to a final radius. Though each set of experiments varied the machining parameters, all parameters tested were based on a set of “control” parameters used for plutonium at LANL [17]. These parameters are listed in Table 2-3.
Table 2-3. Control machining parameters used on 1199 aluminum [17]
Machining Parameter Value
Rake Angle (degrees) +15
Tool Coating None
Depth of Cut (μm) 120
Cross-Feed (µm/rev) 40
Cutting Speed (m/s) 1.8-3.0
Tool Nose Radius (µm) 400
Note the range of cutting speed (1.8 m/s-3.0 m/s) is given in Table 2-3. This is because, at a constant spindle speed of 573 rpm, the cutting speed drops from 3 m/s at the 50 mm outer radius of the disc, to 1.8 m/s at the minimum radius of 20 mm.
2.2
Machining Force Measurement
pre-calibrated gain. Fc is along the direction of “Y” and Ft is along the direction of “X” as shown in Figure 1-2.
While machining under steady-state conditions, spikes in measured forces can indicate dead metal phenomena on the tool. In addition to force data, parameters such as coefficient of friction (𝐹𝑓
𝐹𝑛) can also be calculated if the rake angle and both Fc and Ft are known, as shown in Equations (1.1) and (1.2). The Kistler load cell is shown in Figure 2-4. Specifications and settings for the specific load cell are displayed in Table 2-4 and Table 2-5, respectively.
Table 2-4. Specifications for Kistler 50993 load cell [11]
Compression Range (Z – axis) [N] +5000 to -5000
Shear Range (X, Y axis) [N] +2500 to -2500
Rigidity (Z – direction) 1000
Rigidity (X, Y-axis) 300
Natural Frequency (Y- direction)
[KHz]
11
Weight [grams] 32
Sensitivity (FZ) [pC/N] -4.1
Sensitivity (FX, FY) [pC/N] -7.5
Noise Floor (N) 0.01
Table 2-5. Settings for Kistler 50993 load cell
Cutting Force Thrust Force
Sensitivity settings 6.76 6.76
Capacitor decay Long Long
Scale (Mech
units/volt)
10 10
2.2.1 Drift Correction
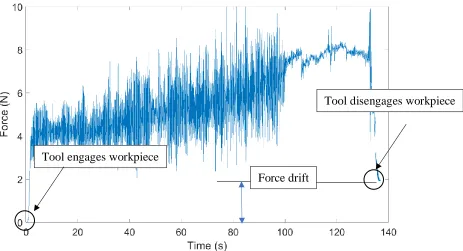
point is equal to 0 force. Both of these points should be equal to zero force since the first and last data points occur when the tool is not in contact with the workpiece. Figure 2-5 shows a force graph without any drift correction.
Figure 2-5. Force data as collected, no drift correction
Notice how the final data point is equal to 2 N. Since the tool is no longer in contact with the workpiece, this should be equal to zero.
Tool engages workpiece
Tool disengages workpiece
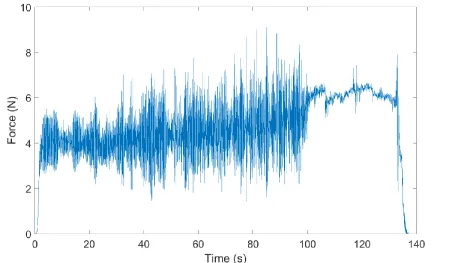
Figure 2-6. Processed force data, with drift corrected
Figure 2-6 shows the same force data after drift has been corrected. The Matlab code for the correction is available in the Appendix A.
2.3
Surface Finish Measurement
Figure 2-7. General schematic of a contact profilometer like the Talysurf [19]
After the face of the disc was machined, it was measured in the Talysurf stylus profilometer. For each surface, three radial measurements were made; each clocked 120° apart. From these three profiles, Rq (root mean square) surface roughness was calculated for the entire profile. Any features larger than 3 mm in wavelength were filtered out on the Talysurf software and classified as form error and not considered for Rq roughness measurements. The reported roughness for each experiment is the average of the three bulk surface roughness values.
Figure 2-8. A surface profile created with an overlapping feed rate of 40 µm/rev
Notice the vertical magnitude of the repeating features in Figure 2-8. The average magnitude of these grooves can be quantified for comparison as root-mean-square or Rq surface roughness. Calculation of Rq roughness is described in Equation (1.4). Note that this is an example of a surface created with an overlapping feedrate.
2.3.1 Non-Overlapping Facing: Detection of Dead Metal
The machining operation used for surrogate testing experiments was a facing operation with a non-overlapping feed rate. An example of a surface created for these conditions is shown in Figure 2-9. Notice how the grooves in the machined surface are not in contact with the grooves on either side. This provides insight into the state of the tool and chip flow at the time each groove was cut.
a theoretical groove from the published tool radius. An increase in groove area and depth will be observed if a BUE is generated during the cut. Figure 2-9 and Figure 2-10 show this phenomenon. The parabolic lines show the published shape of the tool. The shaded area illustrates area that is present in the groove but does not represent the cross section of the tool.
Figure 2-9 below shows an example where no significant BUE is present, notice the small size of the shaded area. Figure 2-10 shows an example where BUE was present. Notice the large difference between the theoretical tool shape and the shape that the tool produced.
Figure 2-10. Surface produced by a round-nosed tool with a BUE [18]
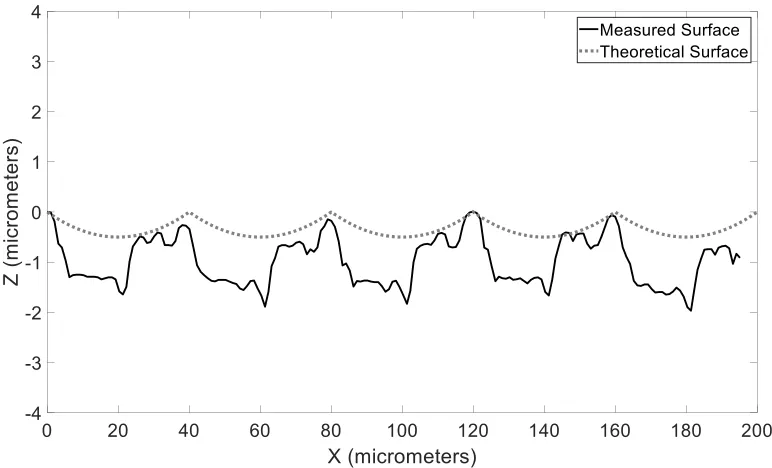
While the method in shown Figure 2-9 and Figure 2-10 is effective for detecting BUE, other metrics must be used to detect seizure events. To detect chip seizures using a non-overlapping cut, the shape of the grooves above the Z=0 line was used. Figure 2-11 shows what these features looks like on a profilometer measurement.
Figure 2-11 has large peaks above the Z = 0 line, indicating significant ploughing. On a new tool with a sharp cutting edge, these peaks are indicative of a seizure since it inhibits the cutting edge’s ability to form a chip. Contrast this profile with Figure 2-9, which lacks any evidence of BUE or chip seizures. Notice how the shaded area above the Z = 0 line is about the same size as the groove area below the line. This indicates very poor chip formation and lots of ploughing, consistent with chip seizures.
2.3.2 Spectral Analysis of Machined Surfaces
In addition to vertical magnitude, the spatial frequency of the features on the machined surface gives insight to the cutting mechanics at the moment the surface was created. Features of a much higher frequency (X direction) than the cross-feed of the tool are likely due to the imperfect cutting edge of the tool. On Figure 2-8, these features exist within the confines of a single groove and are usually very small in magnitude.
When optimizing machining parameters on the surrogate metal, an overlapping feedrate was used. This leaves a machined surface similar to Figure 2-8. Using this surface profile, the frequency of the features on the surface provided insight into the conditions at the tip of the tool at the time of machining.
An effective tool to graphically quantify the frequency of surface features, as well as their prominence, is a frequency-magnitude plot, with data from a fast Fourier transform of the surface features. Figure 2-12 and Figure 2-14 show examples of frequency-magnitude plots for machined surfaces. For these particular plots, the vertical scale is in μm.
Figure 2-12. Frequency-magnitude plot of a surface with dead metal defects
Figure 2-13. Machined surface corresponding with Figure 2-12
On the right side of Figure 2-13, low magnitude repeating features can be seen. These features have a spacing at or above the frequency of the crossfeed. This indicates a strong flow at the time that the right side of the figure was machined. The vertical black lines indicate the crossfeed of 40 µm. The large peak on the left side of Figure 2-13 is indicative of a dead metal chip seizure altering the machined surface. This large, infrequent feature is indicated by the data points below 10 on the X axis of Figure 2-12. Figure 2-14 shows the spectrum of a surface without large dead metal defects.
Figure 2-14. Frequency-magnitude plot of a surface with few of dead metal defects
Figure 2-14 displays a strong peak at integer multiples of the crossfeed since this resembles the frequency spectrum of the theoretical surface. Few peaks are lower than the crossfeed frequency of 25 features/mm, this indicates few dead metal defects on the surface.
2.4
Tool Inspection
Figure 2-15. Cutting edge of a V-series insert on the SEM
While a part was being turned, the high magnification (100x) Supereyes video camera was used to record the interaction between the tool and the part. This provided real-time evidence of chip seizures on the tool. Since BUE occurs between the chip and tool, it cannot be witnessed using this camera setup. Figure 2-16 shows a cartoon denoting the camera angle used for in-situ video recording. Figure 2-17 shows the same camera angle on a V-series carbide insert.
Rake Flank
Figure 2-16. Schematic of tool removing a chip from the workpiece [20]
Figure 2-17. 100x view of the V-series cutting tool
The camera angle shown in Figure 2-17 allows visual confirmation of chip seizures during machining, even at the limited framerate of the Supereyes (60 Hz). The image on the left shows a large dead metal seizure on the tool during machining. The image on the right shows, normal, smooth chip flow.
3.
SEARCH FOR A SURROGATE MATERIAL
Rather than machine a large number of materials, a material property approach was taken to identify a small group of potential surrogate materials to plutonium. Properties of the plutonium such as crystallographic structure, thermal diffusivity (α), tensile yield strength (σ), and hardness characteristics were identified to find potential surrogates. Materials to be considered were soft (𝐻𝑣 < 50), Face Center Cubic (FCC) metals. In addition to these material property similarities, a good surrogate should display dead metal formations and surface degradation during dry machining, similar to plutonium.
Four metals were identified using these criteria; 1199 aluminum, 1100 aluminum, annealed OFHC copper, and lead-based babbitt. Both species of aluminum and copper are commercially pure. The OFHC copper was recommended and supplied by LANL. Next, a composite scoring system was devised to predict the machining performance of these four metals. This Machining Surrogate Score (MSS) is a single number to compare each material to plutonium on the basis of thermal diffusivity and tensile yield strength. All of these properties are crucial to machining performance. Thermal diffusivity describes the materials ability to remove heat from the cutting zone. It is a function of thermal conductivity, density and specific heat, as shown in Equation (3.1) [21].
𝛼 =𝜌𝑐𝑘
𝑝 (3.1)
chip formation is strongly dependent on the tensile yield strength of the material [8]. Equation (3.2) describes the relation between thermal diffusivity, yield strength, and MSS.
𝑀𝑆𝑆x = (𝜎𝑃𝑢𝜎−𝜎𝑥 𝑃𝑢 ) ∗ (
𝛼𝑃𝑢−𝛼𝑥
𝛼𝑃𝑢 )
(3.2)
The MSS of a material is essentially the product of the normalized differences between the yield strengths and thermal diffusivities of plutonium (Pu) and the potential surrogate (x). Note that a smaller MSS for a surrogate indicates that it is similar to plutonium with regards to these two parameters. This means that a surrogate may be a suitable surrogate to study the dry machining of plutonium. The properties of interest for plutonium, 1199 aluminum, 1100 aluminum, OFHC copper and babbitt are shown in Table 3-1.
Table 3-1. Material properties of potential surrogates and plutonium [22]
Material σ (MPa) k (𝑾 𝒎°𝒌⁄ ) ρ (𝒌𝒈 𝒎⁄ 𝟑) 𝒄𝒑 (𝑱 𝒌𝒈°𝑲)⁄ α (𝒎𝒎𝟐⁄ )𝒔
1199 aluminum 110 240 2700 900 99
1100 aluminum 103 220 2710 904 90
OFHC copper 35 398 8930 385 116
lead babbitt 42 24 10200 163 14
Plutonium [1] 100 8.4 19800 130 3
Table 3-1 shows that 1199 and 1100 aluminum are closest to plutonium with regards to yield strength, while lead babbitt is closest with respect to thermal diffusivity. Assuming that both of these material parameters are equally important with respect to machining performance, the MSS will serve as a deciding factor to determine which materials should be tested extensively on
the Nanoform diamond turning machine. Figure 3-1 displays the MSS for the four materials listed in Table 3-1.
Figure 3-1. MSS for the four metals considered
Figure 3-1 indicates that 1199 and 1100 aluminum have much lower MSS than babbitt or copper, indicating that they are good candidates for plutonium surrogacy. Note that if plutonium were plotted in Figure 3-1, it would have a MSS of zero. In the following section, both aluminum and copper will be tested to validate or disprove the MSS system and determine which metal should be used for the remainder of the project as a surrogate to plutonium.
3.1
Testing of Surrogate Materials
To identify which materials best behave as surrogates to plutonium, the non-overlapping feedrate geometry was used in cutting experiments on each material. The machining parameters for these experiments are in Table 3-2. The Tool 1 geometry was used.
0 5 10 15 20 25
Aluminum 1100 Aluminum 1199 OFHC Copper Babbitt
Table 3-2. Feeds and speeds used in surrogate machining experiments Non- Overlapping Feedrate
Feedrate (mm/min) 300
Depth of Cut (μm) 25
Spindle Speed (rev/min) 573
These experiments were conducted on the face of a 50mm radius disc. At 573 rpm, this equates to an average cutting velocity of 2 m/s, from the control parameters in Table 2-3. The depth of cut was designed to match the chip load (uncut chip area) of those same control parameters. Each experiment was repeated 3 times.
3.1.1 OFHC Copper
Figure 3-2. Three grooves in OFHC copper turned with tool 1
Figure 3-3. Tool 1 after turning a non-overlapping face on OFHC copper
3.1.2 1100 Aluminum Testing
Figure 3-4 shows the same method of measuring BUE as shown in Figure 2-9 and Figure 2-10. The light shaded region represents the 1100 aluminum workpiece. The dark shaded region is the area that cannot be accounted for by the theoretical shape of the round tool. The depth of cut can be seen as the depth of the three grooves, about 25 μm.
Figure 3-4. Three grooves in 1100 aluminum turned with tool 1
Figure 3-5. Tool 1 after turning a non-overlapping face on 1100 aluminum
Figure 3-5 shows flank wear marks are present on the SEM image of the tool. These are a common type of flank wear. No BUE or chip seizures are present in this micrograph. This is in agreement with the profile in Figure 3-4.
3.1.3 1199 Aluminum Testing
Figure 3-6 shows the same method of measuring BUE as shown in Figure 2-9 and Figure 2-10. The light shaded region represents the 1199 aluminum workpiece. The darkly shaded region is an area that differs between the shape of the theoretically round tool and the measured grooves. This difference is much smaller than 1 μm. The depth of cut for the three grooves is about 25 μm.
Figure 3-6. Three grooves in 1199 aluminum turned with tool 1
Figure 3-7. Tool 1 after turning a non-overlapping face on 1199 aluminum
Figure 3-7 shows a large chip welded or “seized” to the tip of the tool after machining 1199 aluminum. This corroborates the evidence displayed above in Figure 3-6. This presence of a seized chip was observed on three consecutive experiments.
3.1.4 Surrogate Machining Results- Non Overlapping Feed
Table 3-3. Surrogate machining results Material Average Plough Height (µm) Seizure Observed? BUE Observed?
OFHC Copper 13.5 No No
1100 Aluminum 12.2 No No
1199 Aluminum 17.2 Yes No
Table 3-3 indicates that no evidence of a BUE was observed in the SEM for any of the three metals. In addition to lack of SEM evidence, the machined grooves also showed little evidence of BUE. This is expected according to Trent [8] who stated “The built-up edge is not observed when cutting pure metals.” Seized chips were not observed in the SEM for 1100 aluminum and copper. However, large chips welded to the tool were repeatedly observed for the 1199 aluminum. Some ploughing occurred with all three metals tested, but it was consistently larger for the 1199 aluminum, with an average of 17.2 µm, 41% higher than 1100 aluminum and 28% higher than OFHC copper. This is in agreement with Figure 3-7, which shows a large chip seizure that is likely the cause of the ploughing shown in Figure 3-6.
Due to its ability to seize to the tool and cause ploughing events, 1199 aluminum was chosen to study further, using similar feeds and speeds to those used for plutonium at LANL.
3.2
1199 Aluminum- Overlapping Feedrate and Surface Roughness
and dead metal structures using the feeds, speeds, and tooling used at LANL for plutonium. This poor finish as a result of dead metal seizures is detailed in Section 0. A set of surface overlapping feed experiments were conducted using the parameters prescribed in Table 2-3. Tool 2 was used for these experiments since it was the geometry reported by LANL to most exhibit dead metal problems like shown in Figure 1-10 and Figure 1-11 [1].
The 50 mm radius disc of 1199 aluminum was turned and measured three times. Part of one of the machined surfaces is shown below in Figure 3-8.
Figure 3-8. Surface profile of 1199 aluminum turned with tool 2
Figure 3-8 shows an interesting trend on the surface of a machined part. This surface can be divided into two regimes. To the right of x=20 mm, the surface is consistent, smooth, and contains no features larger than 2 µm in Z amplitude. This correlates with the formation of a smooth, continuous chip, which was recorded by a high magnification video camera. Video evidence of this smooth, continuous chip flow can be seen in the bottom right.
Higher Speed
Smooth Chip Flow Observed Lower Speed
Chip Seizures Observed
To the left of the 20 mm line, the surface contains many tall, irregular features. This correlates with poor chip flow across the tool. Video evidence of this poor chip flow is shown in the bottom left. This poor chip flow is characterized by slow-moving, massive chips periodically seizing to the tool’s rake face like photographed Figure 4-7. This was evidence of a “cyclical” chip flow pattern.
This change across the machined surface is due to the cutting speed decreasing as the tool feeds towards the center of the disc. Higher cutting speeds resulted in continuous chip flow and improved surface finish, while low surface speeds resulted in intermittent, cyclic chip flow and bad surface finish. This phenomenon was observed for all three repetitions of the experiments.
Figure 3-9 and Figure 3-10 highlight the differences in chip flow on either side of the 1.77 m/s line in Figure 3-8. Figure 3-8 shows a straight, smooth chip being removed from the workpiece and flowing up the rake face of the tool. This smooth chip flow was recorded at a cutting speed above 1.77 m/s, and correlates with the surface on the right side of Figure 3-8.
Figure 3-9. Video evidence of the smooth chip flow experienced to the right of the 20 mm radius line on Figure 3-8
side of Figure 3-8. Features like this are the cause for the degradation of the machined surface on both 1199 aluminum and plutonium. This is a similar seizure formation to the one shown in Figure 1-14.
Figure 3-10. Video evidence of the chip seizure experienced to the left of the 20 mm radius line on Figure 3-8
Table 3-4 displays the results for the overlapping feedrate experiments at the control parameters used at LANL for plutonium.
Table 3-4. 1199 aluminum surface roughness at LANL machining parameters
Rq (μm) Rqt (μm)
Seizures
Observed?
Test 1 0.999 0.15 yes
Test 2 0.6920 0.15 yes
Test 3 0.8570 0.15 yes
4.
CHIP SEIZURE CYCLE
During conversations with Los Alamos engineers in 2017, it was determined that chip seizure, not BUE was the principle concern with plutonium [23]. This chip seizure, as described by LANL, is when a reactive chip of plutonium adheres to the rake face of the tool forming a piled up formation. This ball then contacts the already machined surface, smearing the soft plutonium surface and causing large streaks and poor surface finish like shown in Figure 1-12. This is consistent with the dry machining behavior of 1199 aluminum.
During the machining experiments in Section 3.2, an effort to generally describe the seizure process of ductile metals like 1199 aluminum and plutonium was initiated. By collecting chips and filming the cutting process, it was hypothesized that the seizure process occurs cyclically, this cycle has also been observed by Ashoktov [24]. The 5 stages of the process as observed are detailed below:
Figure 4-1. Geometry of the pickup of workpiece material on the carbide tool at small depths of cut or initial contact
Figure 4-2 shows the cutting model for a deeper cut than Figure 1 with a fixed tool and a workpiece moving into it from the right to produce a chip. This phase is described by traditional modeling like that of Ernst and Merchant [7]. The chip slides over the rake face of the tool and the contact region between the chip and tool is heated due to chip deformation and friction.
Figure 4-2. Geometry of the cutting process with a fixed tool – phase 1. No seizure of chip to the Phase 1
When the contact temperature and pressure reach a certain level (for a given workpiece and tool material), the force required for the chip to slide over the rake face of the tool becomes greater than that needed to plastically deform the workpiece ahead of the tool. The bottom of the chip is now welded to the tool, forming a dead metal structure. At this point, the chip/tool is the “new cutting tool.” It changes the “normal” chip formation process causing an increase in force to move the tool through the workpiece.
As a result, cutting force increases leading to an increase in the dimensions of the plastic zone in front of the tool. (Phase 2 shown in Figure 4-3).
Figure 4-3. Due to high temperature and pressure at the chip/tool interface, the chip becomes welded to the tool. As a result, the tool/chip becomes the “new” tool. Forces and part roughness
will increase.
In Phase 2(a), shown in Figure 4-4, the lack of chip flow leads to the formation of a growing deposit of the workpiece material on the tool. The boundary ac. As the workpiece approaches the tool, the material in the plastic zone is compressed and squeezed in the direction of its only free
surface cd so that zone acd expands. As the chip is motionless and has already been severely deformed, the plastic zone expands into the workpiece; that is, γ1 gets larger. This is equivalent to
a diminishing shear plane and ϕ.
Figure 4-4. After the chip is welded to the tool, a new flow process begins with the workpiece coming in from the right
Figure 4-5. In phase 3, the chip is stuck to the tool
During this transformation shown in Figure 4-5, the angle γ1 approaches 90º which leads
to a change in the mode of deformation from compression to the shear. When γ1 approaches 90º,
the reaction force R1 (from elastically deformed part of the layer being removed) has changed its direction to become more parallel to the tool rake face leading to Phase 4, shown in Figure 4-6. When the cutting force reaches a certain value, the reaction force R1 becomes great enough to shear the chip fragment and the shear bands from the tool and they become part of the chip as shown in Figure 4-6. Once the seizure has been removed, the normal chip formation returns until contact temperature and pressure become large enough again to reform a new seizure.
Figure 4-6. The motion of the incoming metal ejects the dead metal region and starts a new chip.
Figure 4-7. The image of a chip generated cutting 1199 aluminum.
The photo in Figure 4-7 shows a chip that was stuck to the cutting edge during machining until the force became large enough to stall the spindle motor. The image on the right in Figure
4-7 represents the same phenomenon as the photograph on the left side, but in the photo the chip has formed a spiral at region “B”, due to the chip breaker.
The chip in Figure 4-7 was collected as a result of the spindle stalling with the chip still attached to the tool. It started as a normal chip at the left, C is a region where the chip stuck to the tool, B is a normal chip but with a twist probably caused by interaction with the chip breaker design of this tool and A is another stuck region that took more torque than the motor could produce and ended the experiment. Observation during the experiment showed at A and C the chip seem to stop (it was probably moving slowly) and moving much faster at B and the beginning of the cut to the left of C.
5.
OPTIMIZATION OF MACHINING PARAMETERS FOR SURFACE
ROUGHNESS ON ALUMINUM
Up to this point, several potential surrogates for plutonium have been studied using a non-overlapping feed. One of which, 1199 aluminum, showed a strong tendency to form dead metal structures that adhere to the tool. This is a trait that has been observed when dry machining plutonium. Next, the 1199 aluminum was tested using the control parameters and tool 2. This test confirmed that the 1199 aluminum exhibited similar dead metal seizures and poor surface finish under similar cutting conditions as used on plutonium at LANL. To form a theory on how to prevent dead metal chip seizures on 1199 aluminum and plutonium, a single factor study was performed on the aluminum.
Each set of experiments varied one machining parameter from the control parameters of Table 2-3. These parameters were back rake angle, tool coating, depth of cut, cross-feed, and cutting speed. By examining the effect of each of these parameters, conclusions could be drawn to whether or not LANL should alter their feeds, speeds, or tools used for turning plutonium. Each experiment was repeated three times.
5.1
Rake Angle Experiments
Using the 50 mm diameter disc of 1199 aluminum disc, 5 different rake angles of Kennametal V-Series carbide inserts were studied.
Machining Parameter Value
Rake Angle (degrees) +15,+12,+9,+6,+3
Tool Coating None
Depth of Cut (μm) 120
Cross-Feed (µm/rev) 40
Cutting Speed (m/s) 3-1.8
Tool Nose Radius (µm) 400
5.1.1 Surface Roughness
Figure 5-1. Surface roughness and shear plane angle as a function of rake angle
Figure 5-2. Shear strain as a function of rake angle
15 16 17 18 19 20 21 22 23 24 0.0 0.1 0.2 0.3 0.4 0.5 0.6 0.7 0.8 0.9
0 2 4 6 8 10 12 14 16
S h ear P lan e A n gl e (° ) R q S u rfac e R ou gh n es s (µ m )
Rake Angle (°)
Roughness Shear Plane Angle Shear Plane Angle
R² = 0.9273
2 2.1 2.2 2.3 2.4 2.5 2.6 2.7 2.8 2.9 3
0 5 10 15 20
S h ea r S tra in
5.1.2 Machining Forces
Figure 5-3 cutting force decreased 11% from a rake angle of +3° to +15°, while thrust force decreased 21% and total force decreased 14%. This change is on the same order of magnitude reported research on other metals and is likely due to the more concentrated stress field projected ahead of the tool as a result of higher rake angles [25], essentially meaning the tool is sharper. Figure 5-4 and Figure 5-5 display the frequency spectra as measured on the machined surfaces at +3° and +15° degrees, the roughest and smoothest surfaces, respectively.
Figure 5-3. Machining forces as a function of rake angle
5.1.3 Surface Spectral Analysis
Figure 5-4 and Figure 5-5 display the frequency spectra as measured on the machined surfaces at +3° and +15° degrees, the roughest and smoothest surfaces, respectively.
0 5 10 15 20 25
0 2 4 6 8 10 12 14 16
F
or
ce
(N
)
Rake Angle (+°)
As shown in Figure 5-4, strong peaks are present at 25, 50 and 75 features per millimeter. These are integer multiples of the cross-feed of 40µm per revolution. These dominant peaks indicate that chip seizure and smearing were not prevalent on these surfaces machined by positive rake angles. Negative rake and zero rake tools were tested in previous experiments on 1199 aluminum and deemed to be inappropriate for ductile materials due to extreme chip seizure and high machining forces.
Figure 5-4. Fourier spectrum for the surface machined with a +3° rake angle
Figure 5-5. Fourier spectrum for the surface machined with a +15° rake angle
5.2
Tool Coating Experiments
Using the 50 mm diameter disc of 1199 aluminum, 6 different PVD (physical vapor deposition) tool coatings on Kennametal V-Series carbide inserts were studied. Table 5-2 shows the machining parameters used for the 6 experiments. The Kennametal descriptions for each of the coatings tested are in Table 5-2. All tool coatings tested are available off the shelf from Kennametal and are recommended for use on non-ferrous metals. Geometric theoretical Rq roughness for all four of these experiments is 0.15 µm.
Table 5-2. Parameters used for tool coating experiments
Machining Parameter Value
Rake Angle (degrees) +15
Tool Coating None (K313), KC730,
KC5410, KC5020, KC5010, KCU25
Depth of Cut (μm) 120
Cross-Feed (µm/rev) 40
Cutting Speed (m/s) 3-1.8
5.2.1 Kennametal Tool Coatings [26]
KC730: A PVD TiN coating over a very wear-resistant unalloyed substrate. Application:
For general purpose machining of high-temperature alloys, aerospace materials, refractory metals, and 200 or 300 series stainless steels. The thin, uniformly dense, smooth coating increases wear resistance and reduce problems with a built-up edge. It also provides an unusually good combination of properties for machining difficult-to-machine materials and aluminum. The substrate offers superior thermal deformation resistance, depth of cut notch resistance, and edge strength. Run at higher speeds than uncoated grades. Most ground periphery inserts have a sharp edge.
KC5410: An extremely hard TiB2-PVD-coated grade that provides very good wear
characteristics at high cutting speeds and is best suited for machining aluminum with <10% silicon and other non-ferrous materials. KC5410 resists built-up edge, can help reduce the burring effect and will generate excellent surface finish.
K313: A hard, low binder content, unalloyed WC/Co fine-grained grade. Application:
Exceptional edge wear resistance combined with very high strength for machining titanium, cast irons, austenitic stainless steels, non-ferrous metals, nonmetals, and most high-temperature alloys. Superior thermal deformation and depth of cut notch resistance. The grain size is well controlled for minimal pits and flaws which contributes to long, reliable service.
KC5010: This grade is ideal for finishing to general machining of most workpiece
non-ferrous materials and superalloys under stable conditions. It also performs well machining hardened and short chipping materials.
KCU25: An advanced PVD TiAlN coated grade with a tough, ultra-fine grain unalloyed
substrate. Application: For general purpose machining of most steels, stainless steels, high-temperature alloys, titanium, irons, and non-ferrous materials. Speeds may vary from low to medium and will handle interruptions and high feed rates.
KC5025: For general purpose machining of most steels, stainless steels, high-temperature
alloys, titanium, irons, and non-ferrous materials. Speeds may vary from low to medium and will handle interruptions and high feed rates.
5.2.2 Surface Roughness
Figure 5-6. Surface roughness and shear plane angle for all 6 tool coatings
5.2.3 Machining Forces
Figure 5-7 displays the average cutting and thrust forces for all tool coating tested. KC5025 produced the highest cutting and thrust forces, while KCU25 had the lowest. However, the difference between these was only about 2 N (~15%) for cutting and thrust (~20%). The three coatings that yielded the best surface finishes (KC730, KC5410 and uncoated (K313)) have cutting and thrust forces within 1 N of each other.
28.94 24.21 26.00 26.61 26.10 30.41 0.00 5.00 10.00 15.00 20.00 25.00 30.00 35.00 0.00 0.50 1.00 1.50 2.00 2.50
KC730 KC5410 K313 KC5025 KC5010 KCU25
S u rfac e F in is h (µ m )
Figure 5-7. Machining forces for all 6 tool coatings
5.2.1 Surface Spectral Analysis
Figure 5-8 shows the Fourier spectrum for the surface machined with the KC5010 tool. While strong peaks are seen at integer multiples of the cross-feed frequency (25, 50 and 75 features per mm), many strong peaks are also present below 10 features per mm. These peaks are indicative of features on the surface created by low-frequency phenomena such as chip seizure and the resulting smearing.
0 2 4 6 8 10 12 14 16 18
KC730 KC5410 K313 KC5025 KC5010 KCU25
F
or
ce
(N
)
Figure 5-8. Fourier spectrum for the surface machined with a KC5010 coating
Figure 5-9 describes the surface machined with the KC5410 tool and is a very different than the one shown in Figure 5-8. The peaks are much smaller and occur at integer multiples of the cross-feed frequency. This indicates a smooth surface, void of low-frequency features caused by chip seizure and smearing on the machined surface.
5.3
Depth of Cut Experiments
Using the 50 mm diameter disc of 1199 aluminum disc, 5 different depths of cut were tested using Kennametal V-Series carbide inserts. Table 5-3 displays the machining parameters used for the 5 experiments.
Table 5-3. Parameters used for depth of cut experiments
Machining Parameter Value
Rake Angle (degrees) +15
Tool Coating None
Depth of Cut (μm) 20, 40, 60,
80, 100, 120
Cross-Feed (µm/rev) 40
Cutting Speed (m/s) 3-1.8
Tool Nose Radius (µm) 400
5.3.1 Surface Roughness
![Figure 1-1. Late 19th century Hendey lathe [3]](https://thumb-us.123doks.com/thumbv2/123dok_us/1343600.1167230/17.612.77.541.152.468/figure-late-th-century-hendey-lathe.webp)
![Figure 1-2. Nomenclature for single point turning [6]](https://thumb-us.123doks.com/thumbv2/123dok_us/1343600.1167230/19.612.98.519.72.307/figure-nomenclature-single-point-turning.webp)
![Figure 1-4. Force components for orthogonal cutting [7]](https://thumb-us.123doks.com/thumbv2/123dok_us/1343600.1167230/21.612.151.460.70.367/figure-force-components-orthogonal-cutting.webp)
![Figure 1-8. Allotropes of plutonium-gallium alloys [4]](https://thumb-us.123doks.com/thumbv2/123dok_us/1343600.1167230/27.612.137.466.217.474/figure-allotropes-of-plutonium-gallium-alloys.webp)
![Figure 2-7. General schematic of a contact profilometer like the Talysurf [19]](https://thumb-us.123doks.com/thumbv2/123dok_us/1343600.1167230/43.612.167.449.73.309/figure-general-schematic-contact-profilometer-like-talysurf.webp)
![Figure 2-9. Surface produced by a round-nosed tool without a BUE or seizure [18]](https://thumb-us.123doks.com/thumbv2/123dok_us/1343600.1167230/45.612.132.480.292.498/figure-surface-produced-round-nosed-tool-bue-seizure.webp)
