ISSN(Online): 2320-9801
ISSN (Print): 2320-9798
I
nternational
J
ournal of
I
nnovative
R
esearch in
C
omputer
and
C
ommunication
E
ngineering
(An ISO 3297: 2007 Certified Organization)
Vol. 4, Issue 8, August 2016
Class-dependent Adaptive Score
Normalization for Multimodal Biometric
Systems
D. Gayathri1, R. Uma Rani2
Dept. of Computer Science, Periyar University College of Arts & Science, Mettur Dam, Salem, Tamilnadu, India1 Dept. of Computer Science, Sri Sarada College for Women, Salem, Tamilnadu, India2
ABSTRACT: Biometric systems using multiple traits produce better recognition than the unimodal biometric systems. The fusions of multiple biometric traits are done at different levels such as feature level, score level and decision level. Among these levels the score level fusion achieves better performance than the other. However, a major limitation in score level fusions is that the scores from different biometric traits are heterogeneous in general. This issue can be resolved by normalizing the scores into a common range before integrating them. There is various normalization approaches are presented in the literature, they are broadly classified into two categories: non-adaptive and adaptive normalization methods. In this paper, most prevalent normalization techniques has been studied and proposed an improved approach for adaptive scores normalization. The proposed normalization approach takes the data samples of each class and normalizes them by making use of conventional normalization technique. The performance of the proposed normalization technique is studied with the face and fingerprint biometric traits of 80 people. The results illustrate that the proposed normalization technique improves the performance of the conventional methods.
KEYWORDS: Score-Level fusion, Normalization, False Acceptance Rate, Classification, etc.
I. INTRODUCTION
Multimodal biometrics is a new approach in person identification which resolves the issues in unimodal biometric systems by integrating multiple biometric data. These systems significantly improve the recognition performance in addition it also handles outliers, high dimensional data, and reduces the false acceptance rate. However, the space and time complexity is high than that for a unimodal biometric system, the aforesaid merits leads to the use of multimodal biometric systems in real-time applications (Down and Sands, 2004). The choice of an effective fusion scheme to integrate the multiple biometric data; plays a vital role towards the performance of the multimodal biometric system (Ross et al., 2006). Three different choices are available for the fusion: feature level, score level and decision level. The features extracted from different biometric data may be incompatible hence the feature level fusion is difficult. Fusion at the decision level is too abstract since only a less amount of information is available at this level. Therefore, integration at the matching score level is mostly favoured due to the comfort in accessing and conjoining matching scores.
ISSN(Online): 2320-9801
ISSN (Print): 2320-9798
I
nternational
J
ournal of
I
nnovative
R
esearch in
C
omputer
and
C
ommunication
E
ngineering
(An ISO 3297: 2007 Certified Organization)
Vol. 4, Issue 8, August 2016
matching scores generated by the different modalities are heterogeneous, normalization is required to transform these scores into a common domain before combining them. While several normalization techniques have been proposed, there has been no detailed study of these techniques.
Jain et al., (2005) systematically studied the effects of different normalization schemes on the performance of a multimodal biometric system based on the face, fingerprint and hand-geometry modalities. Seven different score normalization techniques and three fusion techniques on the normalized scores were tested in their study. Except for one normalization technique (the median MAD), all other fusion approaches outperform the unimodal approaches. The purpose of this paper is to contribute a new adaptive combination approach to score level fusion, introducing an improved approach called CLass-dependent AdaPtive (CLAP) Normalization technique.
The rest of the paper is organized as follows: Section 2 describes the related works. Section 3 presents the background on score level fusion and state the need for score normalization. Section 4 illustrates the numerous normalization approaches. Section 5 presents the proposed class-dependent adaptive normalization method. Section 6 explains the experimental setup and the results are quantified and discussed in Section 7. Section 8 concludes the paper.
II. RELATED WORKS
Poh and Bengio (2006) studied several fusion approaches in different circumstances and presented a set of evaluation tools to encourage researchers to focus on the problem of biometric authentication score-level fusion. Park and Park (2007) proposed a new iris recognition method based on score level fusion, using two Gabor wavelet filters and SVM (support vector machine). For score level fusion, typical Hamming distance (HD) produced by a Gabor filter has been used. Experimental results displayed that the authentication error of this method was much smaller than that when using methods like single Gabor filter, filter-bank, and decision level fusion and conventional score level fusion. Singh and Gupta (2007) deals with the consequence of normalization techniques of matching scores on the performance of multimodal biometric systems using face, fingerprint and offline-signature. The performance of Four-Segments-Piecewise-Linear (FSPL) normalization technique is better at lower False Acceptance Rate (FAR). The experimental analysis suggests that an extensive testing of score normalization is required to estimate the performance of any multimodal biometric system. Morizet and Gilles (2008) present a new combination technique to fuse scores deriving from face and iris biometric matchers. This most successful combination technique maximizes the separation between impostors and genuine, using statistical moments. This method is user-specific and considers the shapes of score distributions to improve the global recognition rate of the multi-biometric system. Nandakumar et al., (2008) proposed a framework for the optimal combination of match scores that is based on the likelihood ratio test. The distributions of genuine and impostor match scores are modelled as finite Gaussian mixture model. The proposed fusion approach is able to handle discrete match score values in arbitrary scales and correlation between the scores of multiple matchers. Experiments on three multimodal biometric databases indicate that this fusion framework achieves consistently high performance compared to commonly used score fusion techniques based on score transformation and classification.
ISSN(Online): 2320-9801
ISSN (Print): 2320-9798
I
nternational
J
ournal of
I
nnovative
R
esearch in
C
omputer
and
C
ommunication
E
ngineering
(An ISO 3297: 2007 Certified Organization)
Vol. 4, Issue 8, August 2016
Wang and Han (2009) proposed a multimodal biometric identification method integrating face and iris based on score level fusion. For score level fusion, two matching scores respectively from face verifier and iris verifier was combined by using SVM based fusion rule to generate a single scalar score which is used to make the final decision. SVM−based
fusion rule can achieve better fusion effect than the conventional score level fusion rules such as sum, product and fisher. He et al., (2010) studied the performance of sum rule-based score level fusion and support vector machines (SVM)-based score level fusion with fingerprint, face and finger vein biometrics. Experiments on four different multimodal databases suggest that integrating the proposed scheme in sum rule-based fusion and SVM-based fusion leads to consistently high accuracy. Zhang and Gu (2013) proposed a fusion scheme based on score level fusion. At first the directional matching score of the two images are received by the competitive coding method. And the global matching score of the two images are estimated by the two-phase test sample sparse representation method. At last, the two scores are combined to classify the test sample. The experimental results show that integration of the global and direction features of the palmprint can achieve the highest recognition rate. Sim et al., (2014) presented a method that combines face and iris biometric traits with the weighted score level fusion technique to flexibly fuse the matching scores from these two modalities based on their weight availability. This framework achieves high accuracy, and had a high decidability index which significantly separate the distance between intra and inter distance.
Though the score level fusion achieves superior performance than the rest of the fusion schemes, normalization techniques are necessary to combine the heterogeneous scores as they are received from distinct biometric data. The literature shows that the normalization techniques could be classified into two categories: adaptive and non-adaptive. The non-adaptive techniques are not robust and low efficient than the adaptive techniques. However, the adaptive techniques could be further improved by considering the user-specific model rather than achieving the adaptiveness with the complete user data. This issue motivates us to develop a novel approach called CLass-dependent Adaptive (CLAP) normalization approach for multimodal biometric system. The following sections describe the backgrounds and the proposed method in detail.
III. SCORE LEVEL FUSION
Score level fusion is mostly preferred in multimodal biometric systems because matching scores are easy to acquire and comprise adequate information to distinguish genuine and impostor cases. The estimated of matching scores is simple as it doesn’t require the knowledge of feature extraction and matching algorithms of each biometric traits. This behaviour of score level fusion schemes make it both feasible and practical (Dass et al., 2005). Sanderson and Paliwal (2002) have classified information fusion in biometric systems into two broad categories: pre-classification fusion and post-classification fusion. Pre-classification fusion denotes to combining information prior to the application of any classifier or matching algorithm. In post-classification fusion, the information is integrated after the decisions of the classifiers have been obtained.
This paper follows the combination approach to pre-classification (measurement level) fusion. Kittler et al., (1998) have developed a theoretical framework for combining the evidence obtained from multiple classifiers using schemes like the sum rule, product rule, max rule, min rule, median rule and majority voting. In order to implement these rule-based schemes, initially the matching scores are converted into posterior probabilities for a better separation between genuine and impostor user. Consider a problem of classifying an input score D into one of ‘m’ classes based on the scored generated by R different matching algorithms (classifier). Let xi be the feature vector (match score derived from
the input pattern) presented to the ith classifier. Let the outputs of the individual matching algorithm be P(j|xi), i.e.,
the posterior probability of the pattern D belonging to class j given the feature vector xi. Let c {1, 2, ... , m} be the
class to which the input pattern D is finally assigned. The following rules can be used to determine c:
Product Rule: This rule is based on the assumption of statistical independence of the representations x1, x2, ... , xR. The
input pattern is assigned to class c such that
ISSN(Online): 2320-9801
ISSN (Print): 2320-9798
I
nternational
J
ournal of
I
nnovative
R
esearch in
C
omputer
and
C
ommunication
E
ngineering
(An ISO 3297: 2007 Certified Organization)
Vol. 4, Issue 8, August 2016
In general, different biometric traits of an individual (e.g., face, fingerprint and palm-print) are heterogeneous, which allows the independence assumption based rule is a suitable scheme.
Sum Rule: The sum rule works based on independence assumption and also assumes that the posteriori probabilities calculated by the individual classifiers do not deviate much from the prior probabilities. This rule in insensitive to outliers, hence the problem of ambiguity in classification could be reduced. The sum rule assigns the input pattern to class c such that
= argmax |
Max Rule: The max rule approximates the mean of the posterior probabilities by the maximum value. In this case, we assign the input pattern to class c such that
= argmax max |
Min Rule: The min rule is derived by bounding the product of posteriori probabilities. Here, the input pattern is assigned to class c such that
= argmax min |
Jain and Ross (2005) have proposed the use of user-specific weights for computing the weighted sum of scores from the different modalities. The motivation behind this idea is that some biometric traits cannot be reliably obtained from a small segment of the population. For example, we cannot obtain good quality fingerprints from users with dry fingers. For such users, assigning a lower weight to the fingerprint score and a higher weight to the scores of the other modalities reduces their probability of being falsely rejected. This method requires learning of user specific weights from the training scores available for each user. Consider a multimodal biometric system with three modalities. Let w1i,
w2i, and w3i be the weights assigned to the three modalities for user i. The process of learning these weights for user i
can be described as follows:
The weights w1i, w2i, and w3i are varied over the range [0, 1] in steps of 0.02, such that the constraint w1i + w2i +
w3i = 1 is satisfied.
The weighted sum of scores (sw) for user i is computed as sw = w1is1 + w2is2 + w3is3, where s1, s2, and s3 are the
scores provided by the three biometric matchers for user i.
The set of weights that minimizes the total error rate (sum of the false accept and false reject rates) at some specified threshold (t) is chosen. If more than one set of weights minimize the total error rate, then the set of weights that assigns almost equal weights to all the modalities is chosen. The threshold t is set to a common value for all users. In Jain and Ross (2005), user-specific thresholds had been suggested.
These fusion strategies take into account the performance of the individual characteristic in weighting their contributions. Several algorithms can be used to perform score fusion going from simple addition or product rules to more complicated ones including classification using SVM or score density estimation as discussed above. However, recent works Ross et al., (2006), Nandakumar et al., (2008) show that, all these methods give roughly equivalent performance to that of the weighted SUM rule on the condition that the weights reflect the relative difference in performance of the individual systems.
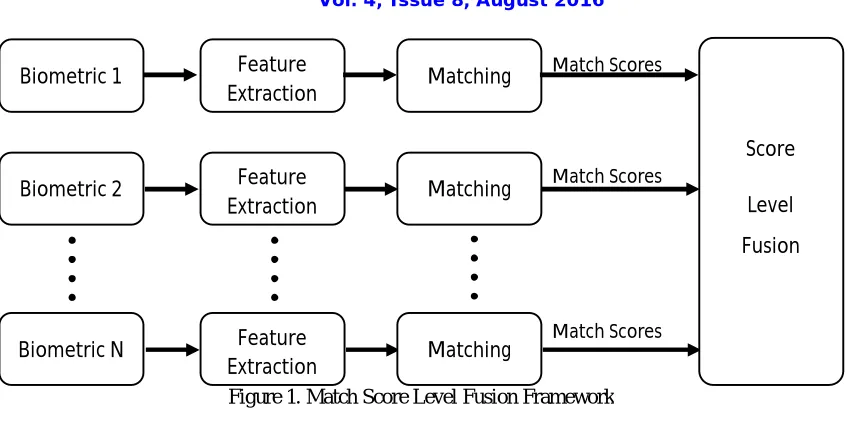
In general, the matching scores are real numbers that measure the degree of similarity between the test data and reference patterns. These scores are further fused for performing rule based classification. Figure 1 shows the general scheme for match score level fusion. Fusion at match score level is challenging for the following reasons:
The scores obtained from the different matchers are heterogeneous. Some may measure distances while other compute similarities.
The different match scores need not be in the same range. Hence, normalization schemes have to be applied.
Match scores obtained from different matchers are linked to the underlying probability distribution function of client and imposter scores. These distributions may be very different from one matcher to another. Therefore, in order to obtain good fusion performance, it is necessary to accurately model the distribution before fusing the scores.
ISSN(Online): 2320-9801
ISSN (Print): 2320-9798
I
nternational
J
ournal of
I
nnovative
R
esearch in
C
omputer
and
C
ommunication
E
ngineering
(An ISO 3297: 2007 Certified Organization)
Vol. 4, Issue 8, August 2016
Figure 1. Match Score Level Fusion Framework
IV. SCORE NORMALIZATION
Normalization of matching scores improves the performance of the multimodal biometric system. Normalization refers to the process of transforming the scores from different matching algorithms into a common numerical range. There is various normalization methods reported in the literature. In Jain et al., (2005) the performance of the min-max, z-score and tanh normalization methods are studied and found to be better than other approaches. However, the min-max and z-score normalization techniques are sensitive to noise and outliers, where the tanh normalization technique is efficient and robust comparatively. Snelick et al., (2005) proposed an adaptive normalization procedure, though it outperforms the classical (non-adaptive) normalization techniques, its computationally expensive and requires an optimal parameter selection. In overall, the normalization methods are evaluated by their robustness and efficiency. Robustness represents the impact of outliers on normalization, and efficiency estimate the genuine and impostor score distributions. Some of the more commonly used score normalization methods and their characteristics are discussed in the following Table.
Table 1. Summary of Score Normalization Methods
Name Characteristics Robustness Efficiency
Min-Max Best suited for known score ranges; sensitive to outlier data
No N/A
Decimal Scaling Assumes scores on a logarithmic scale No N/A Z-Score Assumes normal distribution and symmetry around the
mean
No High
Median Absolute Deviation (MAD)
Insensitive to outliers and extreme values; performs best on normal distribution
Yes Moderate
Double Sigmoid Provides a linear transformation of the scores in the region of overlap, while the scores outside this region are transformed non-linearly.
Yes High
Tanh estimators Insensitive to outliers in case of few points on the extreme trails of distribution; for tail-heavy distributions,
parameter selection influences efficiency
Yes High
Adaptive methods: Two Quadratics, Logistic, Quadratic-Line-Quadratic
Assumes nonlinearity of data; uses iterative normalization process to increase separation between genuine and imposter distributions
Yes High
ISSN(Online): 2320-9801
ISSN (Print): 2320-9798
I
nternational
J
ournal of
I
nnovative
R
esearch in
C
omputer
and
C
ommunication
E
ngineering
(An ISO 3297: 2007 Certified Organization)
Vol. 4, Issue 8, August 2016
A. Non-Adaptive Normalization Methods
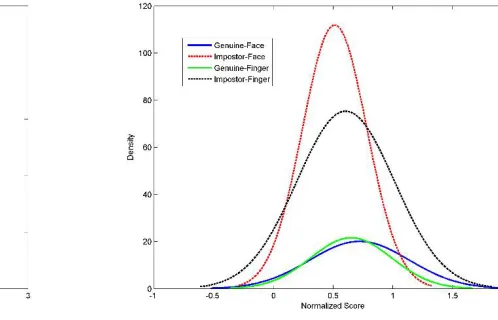
Min-Max (MM) Normalization: It is the simplest technique and best suited for the scores where the minimum and maximum bounds are known, it could be estimated if it is not bounded. In this case, the scores are transformed between minimum (0) and maximum (1). Given a set of matching scores {sk}, k= 1, 2,...,n, the normalized scores are given by
= −min( ) max( )−min( )
Min–max normalization retains the original distribution of scores except for a scaling factor and transforms all the scores into a common range [0, 1]. Distance scores can be transformed into similarity scores by subtracting the min– max normalized score from 1. Figure 2 shows the score distribution of face and fingerprint scores after min–max normalization.
Figure 2. Distribution of genuine and impostor scores after Min-Max normalization
Figure 3. Distribution of genuine and impostor scores after z-score normalization
Z-score (ZS): This method transforms the scores to a distribution with mean of 0 and standard deviation of 1. The operators and denote the arithmetic mean and standard deviation of matching scores, respectively:
= −
ISSN(Online): 2320-9801
ISSN (Print): 2320-9798
I
nternational
J
ournal of
I
nnovative
R
esearch in
C
omputer
and
C
ommunication
E
ngineering
(An ISO 3297: 2007 Certified Organization)
Vol. 4, Issue 8, August 2016
Figure 4. Distribution of genuine and impostor scores after Median MAD normalization
The median and Median Absolute Deviation (MAD) are insensitive to outliers and the points in the extreme tails of the distribution. Hence, a normalization scheme using median and MAD would be robust and is given by
= −
where MAD=median(|sk−median|). However, the median and the MAD estimators have a low efficiency compared to
the mean and the standard deviation estimators, i.e., when the score distribution is not Gaussian, median and MAD are poor estimates of the location and scale parameters. Therefore, this normalization technique does not retain the input distribution and does not transform the scores into a common numerical range. This is illustrated by the distributions of the normalized face and fingerprint scores in Figure 4.
Double Sigmoid (DS) Method based normalized score is given by
=
⎩ ⎪ ⎪ ⎨ ⎪ ⎪
⎧ 1
1 + exp −2
, <
1
1 + exp −2
, ℎ
ISSN(Online): 2320-9801
ISSN (Print): 2320-9798
I
nternational
J
ournal of
I
nnovative
R
esearch in
C
omputer
and
C
ommunication
E
ngineering
(An ISO 3297: 2007 Certified Organization)
Vol. 4, Issue 8, August 2016
Figure 5. Distribution of genuine and impostor scores after Double Sigmoid normalization
Figure 6. Distribution of genuine and impostor scores after tanh normalization
Tanh (TH): This method is among the so-called robust statistical techniques [10]. It maps the raw scores to the (0, 1) range [30], the corresponding score distributions are shown in Figure 6.
=1
2 tanh 0.01 × −
+ 1
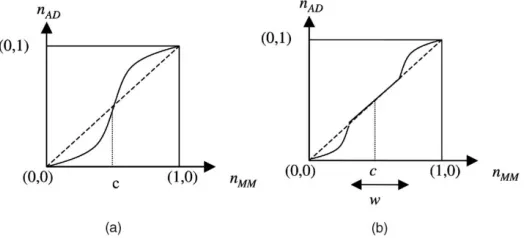
B. Adaptive (AD) Normalization Methods
The errors of individual biometric matchers stem from the overlap of the genuine and impostor score distributions. Snelick et al., (2005) characterize this overlap region by its centre c and its width w. To decrease the effect of this overlap on the fusion algorithm, they proposed to use an adaptive normalization procedure that aims to increase the separation of the genuine and impostor distributions, while still mapping the scores to [0, 1] range. The adaptive normalization is formulated as nAD = (nMM), where () denotes the mapping function that is applied to the MM
normalized scores, nMM. We have considered the following three choices for the function (). These functions use two
parameters of the overlapping region, c and w, which can be either provided by the vendors or estimated by the system integrator. Snelick et al., (2005) estimate these parameters.
Figure 7. Mapping functions for (a) QQ and (b) QLQ adaptive normalizations.
Two-Quadrics (QQ): This function is composed of two quadratic segments that change the concavity at c (Figure 7a):
= 1
, ≤
ISSN(Online): 2320-9801
ISSN (Print): 2320-9798
I
nternational
J
ournal of
I
nnovative
R
esearch in
C
omputer
and
C
ommunication
E
ngineering
(An ISO 3297: 2007 Certified Organization)
Vol. 4, Issue 8, August 2016
For comparison, the identity function, nAD = nMM, is also shown by the dashed lines in Figure 7. The matching score
distribution from face and fingerprint biometric traits are shown in Figure 8.
Figure 8. Distribution of genuine and impostor scores after two-quadrics normalization
Figure 9. Distribution of genuine and impostor scores after LG normalization
Logistic (LG): Here, () takes the form of a logistic function. The general shape of the curve is similar to that shown for function QQ in Figure 7a. It is formulated as
= 1
1 + .
where the constants A and B are calculated as =
∆−1 and = .Here, () is equal to the constant , which is
selected to be a small value (0.01 in this study). Note that, due to this specification, the inflection point of the logistic function occurs at c, the centre of the overlap region. Figure 9 presents the genuine and impostor score distribution with LG normalization technique.
Quadric-Line-Quadric (QLQ): The overlap zone, with center c and width w, is left unchanged while the other regions are mapped with two quadratic function segments (Figure 7b): Figure 10 depicts the score distribution of two biometric traits.
=
⎩ ⎪ ⎪ ⎨ ⎪ ⎪
⎧ 1
( − ) , ≤( −2)
, −
2 < < ( +2)
+
ISSN(Online): 2320-9801
ISSN (Print): 2320-9798
I
nternational
J
ournal of
I
nnovative
R
esearch in
C
omputer
and
C
ommunication
E
ngineering
(An ISO 3297: 2007 Certified Organization)
Vol. 4, Issue 8, August 2016
Figure 10. Distribution of genuine and impostor scores after QLQ normalization
V. CLASS-DEPENDENT ADAPTIVE (CLAP) NORMALIZATION METHOD
Normalization involves transforming the raw scores of different modalities to a common domain using a mapping function. When the function parameters are determined from a fixed training set, it is known as fixed score normalization (Brunelli and Falavigna, 1995). Alternatively, these parameters can be derived for each probe-gallery interaction yielding different parameters for different probes. This is known as adaptive normalization where user and modality specific information can be incorporated in the normalization framework (Snelick et al., 2005), where, adaptive score normalization is used to transform a score and the function parameters are determined from the set of scores obtained by matching the current probe to the entire gallery. The adaptiveness is obtained by finding the overlap region between the genuine and imposter scores distribution as discussed in the previous section. Though the adaptive normalization improves performance of the multi-biometric system, it highly depends on the careful estimation of the parameters c and w. Snelick et al., (2005) estimated these parameters manually to achieve the adaptiveness in normalization. However, there is no evidence in the literature for automated parameter selection. Moreover this parameter selection is sensitive to noise and outliers and the adaptiveness is achieved with the entire gallery rather than user specific model. Here in this paper, user-specific adaptive normalization model is proposed to further enhance the performance of the multimodal biometric systems. The proposed approach eliminates the dominance of long sequences of zeros in templates and, therefore, improves the overall performance.
ISSN(Online): 2320-9801
ISSN (Print): 2320-9798
I
nternational
J
ournal of
I
nnovative
R
esearch in
C
omputer
and
C
ommunication
E
ngineering
(An ISO 3297: 2007 Certified Organization)
Vol. 4, Issue 8, August 2016
Figure 11. Proposed Multimodal System Framework
For example, consider the min-max normalization approach, and assume that the matching score vectors are grouped by their class labels. The class dependent normalizations for a jth class is defined by
= −min( )
max( )−min( ), ℎ = 1, 2, … ,
These class-dependent scores are joined together to form the user-specific adaptive scores (nc). Further, the min-max approach is applied to the overall score vectors (ns) and the final adaptive score is calculated as
= ×
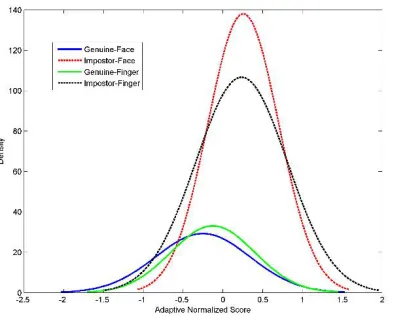
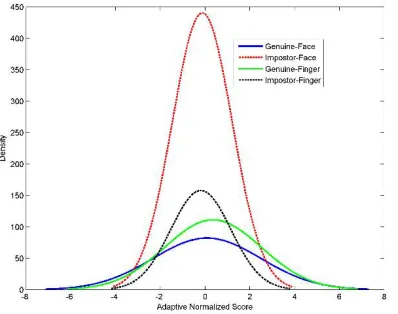
The genuine and impostor score distribution of proposed Class-dependent Adaptive procedure based normalization methods are depicted in the Figures 12 – 19. The comparison between the classical & CLAP based score distribution reveals that the proposed adaptive technique provides effective distribution than the classical normalization techniques.
Figure 12. Distribution of genuine and impostor scores after min-max normalization
ISSN(Online): 2320-9801
ISSN (Print): 2320-9798
I
nternational
J
ournal of
I
nnovative
R
esearch in
C
omputer
and
C
ommunication
E
ngineering
(An ISO 3297: 2007 Certified Organization)
Vol. 4, Issue 8, August 2016
Figure 14. Distribution of genuine and impostor scores after Median Mad normalization
Figure 15. Distribution of genuine and impostor scores after Double-Sigmoid normalization
Figure 16. Distribution of genuine and impostor scores after tanh normalization
Figure 17. Distribution of genuine and impostor scores after two-quadrics normalization
Figure 18. Distribution of genuine and impostor scores after LG normalization
ISSN(Online): 2320-9801
ISSN (Print): 2320-9798
I
nternational
J
ournal of
I
nnovative
R
esearch in
C
omputer
and
C
ommunication
E
ngineering
(An ISO 3297: 2007 Certified Organization)
Vol. 4, Issue 8, August 2016
VI. EXPERIMENTAL SETUP
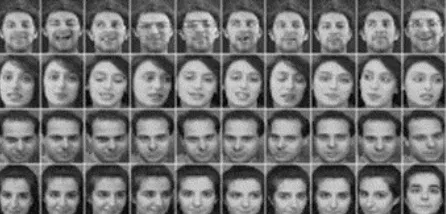
The face and fingerprint biometric datasets are collected and merged to construct the multimodal database (of 40 users each) for our experiments. The first biometric is received from the Cambridge ORL face database, which contains 40 distinct persons. Each person has ten different images, taken at different times. Four individuals (in four rows) of the ORL face images are shown in Figure 20. There are variations in facial expressions such as open/closed eyes, smiling/nonsmiling, and facial details such as glasses/no glasses. All the images were taken against a dark homogeneous background with the subjects in an up-right, and largely frontal position, with tolerance for some side movements. There are also some variations in scale.
Figure 20. Four individuals (each in one row) in the ORL face database. There are 10 images for each person
The second biometric images taken from FVC 2002 (http://bias.csr.unibo.it/fvc2002/), provides four different fingerprint databases: Db1, Db2, Db3 and Db4, three of these databases are acquired by various sensors, low-cost and high quality, optical and capacitive. The fourth database contains synthetically generated images. Each database consists 8 fingerprint samples of 10 persons, we merge these four datasets to construct one database of 40 persons. As this dataset has only 8 samples, we reduce the ORL face samples also from 10 to 8. Figure 21 shows a sample fingerprint image from each database.
Figure 21. Fingerprint Image Datasets
In biometrics, the number of extracted features is usually high, which increases the computational complexity and decreases the performance of the system because of the curse of dimensionality. In order to address these issues, dimensionality reduction approaches are applied to reduce the length of the feature vectors and their redundancies (Haghighat & Namjoo, 2011). A non-linear feature reduction technique such as Generalized Discriminant Analysis (GDA) is used here to resolve this issue (Baudat & Anouar, 2000). These reduced feature vectors are further used to find the matching scores and score level fusion to classify the person.
VII. RESULTS AND DISCUSSIONS
ISSN(Online): 2320-9801
ISSN (Print): 2320-9798
I
nternational
J
ournal of
I
nnovative
R
esearch in
C
omputer
and
C
ommunication
E
ngineering
(An ISO 3297: 2007 Certified Organization)
Vol. 4, Issue 8, August 2016
biometric systems is estimated by calculating the confidence associated with these outputs, measured by the following two error rates.
False acceptance rate (FAR), defined as the probability of an impostor being accepted as a genuine individual. It is measured as the fraction of impostor score (matching score which involves comparing two biometric samples originating from different users) exceeding the predefined threshold.
False rejection rate (FRR), which is defined as the probability of a genuine individual being rejected as an impostor. It is measured as the fraction of genuine score (matching score which involves two samples of the same biometric trait of a user) below the predefined threshold.
FAR and FRR are dual of each other. A small FRR usually leads to a larger FAR, while a smaller FAR usually implies a larger FRR. Generally, the system performance requirement is specified in terms of FAR. A FAR of zero means that no impostor is accepted as a genuine individual. Sometimes, another term, Genuine Accept Rate (GAR), is used to measure the accuracy of a biometric system. It is measured as the fraction of genuine score exceeding the predefined threshold. We use the following equation to find out the GAR of a system:
GAR = 1 − FRR
Even with the best of unimodal biometric systems, it is often not possible to achieve a higher recognition rate, and attempting to improve the performance of single matchers in such situations may not prove to be effective due to inherent problems. By utilizing a multimodal biometric system, these problems can easily be alleviated by providing multiple pieces of evidence of the same identity, thus achieving higher and more reliable recognition performance.
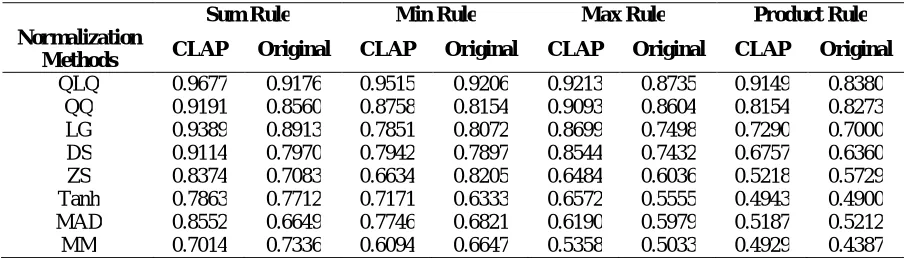
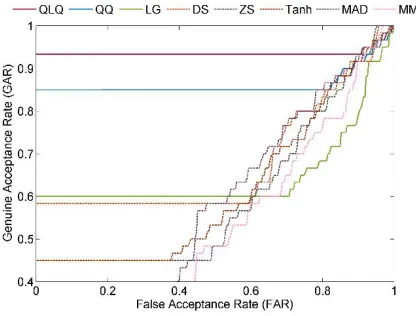
Table 2 depicts the results obtained for the various normalization schemes under different score fusion rules. The sum fusion and min fusion rules outperform the other two rules with the highest GAR of 96.77% and 95.15% for the normalized scores from QLQ method. Among the normalization methods the QLQ and LG methods outperforms the other normalization schemes. The maximum of 96.77% and 93.89% of GAR indicates that the adaptive normalization methods are superior to the non-adaptive normalization methods. The double-sigmoid normalization method performs better in non-adaptive normalization category. The comparison between the original normalization methods and the proposed Class-dependent Adaptive (CLAP) normalization approach directs that the CLAP guarantees the improvements in classical normalization methods. Figures 22–29 depicts the performance comparison of different normalization method with various score fusion rules using ROC analysis.
Table 2. Performance Analysis of Normalization Methods
Sum Rule Min Rule Max Rule Product Rule
Normalization
Methods CLAP Original CLAP Original CLAP Original CLAP Original
ISSN(Online): 2320-9801
ISSN (Print): 2320-9798
I
nternational
J
ournal of
I
nnovative
R
esearch in
C
omputer
and
C
ommunication
E
ngineering
(An ISO 3297: 2007 Certified Organization)
Vol. 4, Issue 8, August 2016
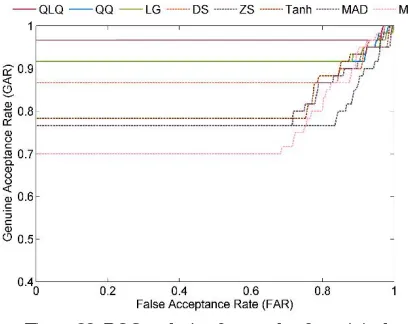
Figure 22. ROC analysis of sum-rule after original normalization methods
Figure 23. ROC analysis of sum-rule after CLAP normalization methods
Figure 24. ROC analysis of min-rule after original normalization methods
Figure 25. ROC analysis of min-rule after CLAP normalization methods
Figure 26. ROC analysis of max-rule after original normalization methods
ISSN(Online): 2320-9801
ISSN (Print): 2320-9798
I
nternational
J
ournal of
I
nnovative
R
esearch in
C
omputer
and
C
ommunication
E
ngineering
(An ISO 3297: 2007 Certified Organization)
Vol. 4, Issue 8, August 2016
Figure 28. ROC analysis of product-rule after original normalization methods
Figure 29. ROC analysis of product-rule after CLAP normalization methods
VIII. CONCLUSIONS
A novel improvement in score normalization for multimodal biometric system is proposed in this paper. The score level fusion methods are able to achieve higher genuine acceptance rate then the feature level and decision level fusion schemes. However, the score level fusion requires that the matching scores has to be normalized to proceed to the fusion step. This paper studies normalization methods in two categories: adaptive and non-adaptive. The proposed normalization scheme selectively chooses some of these classical methods from both the categories and tries to improve by applying the normalization procedure for each user independently rather than implementing for the entire biometric sets. The proposed normalization method, Class-dependent Adaptive (CLAP) normalization, works based on user model. The performance is studied and analysed with GAR and FAR. The higher GAR indicates the superior performance of the proposed normalization approach.
REFERENCES
[1] Down, M. P., & Sands, R. J. (2004). Biometrics: An overview of the technology, challenges and control considerations. Information Systems Control Journal, 4, 53-56.
[2] Ross, A. A., Nandakumar, K., & Jain, A. (2006). Handbook of multibiometrics (Vol. 6). Springer Science & Business Media. [3] Ross, A., & Jain, A. (2003). Information fusion in biometrics. Pattern recognition letters, 24(13), 2115-2125.
[4] Jain, A., Nandakumar, K., & Ross, A. (2005). Score normalization in multimodal biometric systems. Pattern recognition, 38(12), 2270-2285.
[5] Poh, N., & Bengio, S. (2006). Database, protocols and tools for evaluating score-level fusion algorithms in biometric authentication. Pattern Recognition, 39(2), 223-233.
[6] Park, H. A., & Park, K. R. (2007). Iris recognition based on score level fusion by using SVM. Pattern Recognition Letters, 28(15), 2019-2028.
[7] Singh, Y. N., & Gupta, P. (2007, August). Quantitative evaluation of normalization techniques of matching scores in multimodal biometric systems. In International Conference on Biometrics (pp. 574-583). Springer Berlin Heidelberg.
[8] Morizet, N., & Gilles, J. (2008, December). A new adaptive combination approach to score level fusion for face and iris biometrics combining wavelets and statistical moments. In International Symposium on Visual Computing (pp. 661-671). Springer Berlin Heidelberg.
[9] Nandakumar, K., Chen, Y., Dass, S. C., & Jain, A. (2008). Likelihood ratio-based biometric score fusion. IEEE transactions on pattern analysis and machine intelligence, 30(2), 342-347.
[10] Wang, Y., Tan, T., & Jain, A. K. (2003, June). Combining face and iris biometrics for identity verification. In International Conference on Audio-and Video-Based Biometric Person Authentication (pp. 805-813). Springer Berlin Heidelberg.
[11] Toh, K. A., Jiang, X., & Yau, W. Y. (2004). Exploiting global and local decisions for multimodal biometrics verification. IEEE Transactions on Signal Processing, 52(10), 3059-3072.
[12] Snelick, R., Uludag, U., Mink, A., Indovina, M., & Jain, A. (2005). Large-scale evaluation of multimodal biometric authentication using state-of-the-art systems. IEEE Transactions on Pattern Analysis and Machine Intelligence, 27(3), 450-455.
ISSN(Online): 2320-9801
ISSN (Print): 2320-9798
I
nternational
J
ournal of
I
nnovative
R
esearch in
C
omputer
and
C
ommunication
E
ngineering
(An ISO 3297: 2007 Certified Organization)
Vol. 4, Issue 8, August 2016
[14] He, M., Horng, S. J., Fan, P., Run, R. S., Chen, R. J., Lai, J. L., ... & Sentosa, K. O. (2010). Performance evaluation of score level fusion in multimodal biometric systems. Pattern Recognition, 43(5), 1789-1800.
[15] Zhang, S., & Gu, X. (2013). Palmprint recognition method based on score level fusion. Optik-International Journal for Light and Electron Optics, 124(18), 3340-3344.
[16] Sim, H. M., Asmuni, H., Hassan, R., & Othman, R. M. (2014). Multimodal biometrics: Weighted score level fusion based on non-ideal iris and face images. Expert Systems with Applications, 41(11), 5390-5404.
[17] Dass, S. C., Nandakumar, K., & Jain, A. K. (2005, July). A principled approach to score level fusion in multimodal biometric systems. In International conference on audio-and video-based biometric person authentication (pp. 1049-1058). Springer Berlin Heidelberg. [18] Sanderson, C., & Paliwal, K. K. (2002). Information fusion and person verification using speech and face information. Research Paper
IDIAP-RR, 02-33.
[19] Kittler, J., Hatef, M., Duin, R. P., & Matas, J. (1998). On combining classifiers. IEEE transactions on pattern analysis and machine intelligence, 20(3), 226-239.
[20] Jain, A. K., & Ross, A. (2002). Learning user-specific parameters in a multibiometric system. In Image Processing. 2002. Proceedings. 2002 International Conference on (Vol. 1, pp. I-57). IEEE.
[21] Brunelli, R., & Falavigna, D. (1995). Person identification using multiple cues. IEEE transactions on pattern analysis and machine intelligence, 17(10), 955-966.
[22] Haghighat, M. B. A., & Namjoo, E. (2011, October). Evaluating the informativity of features in dimensionality reduction methods. In Application of Information and Communication Technologies (AICT), 2011 5th International Conference on (pp. 1-5). IEEE.
[23] Baudat, G., & Anouar, F. (2000). Generalized discriminant analysis using a kernel approach. Neural computation, 12(10), 2385-2404. [24] Hong, L., & Jain, A. (1998). Integrating faces and fingerprints for personal identification. IEEE transactions on pattern analysis and
machine intelligence, 20(12), 1295-1307.
BIOGRAPHY
D. Gayathri has completed her M.C.A from J.K.K Nataraja College of Arts and Science, Komarapalayam, affiliated with Periyar University. She received her M.Phil Degree from Periyar University in June 2005. Now pursuing her Part time Ph.D., research in Periyar University, Salem. Now she is working as Asst. Professor, Department of Computer Science in Periyar University College of Arts and Science, Mettur Dam, Salem Dt. Her research area is of Information security.