ABSTRACT
GEORGIANNA, WESLEIGH FOWLER EDWARDS. Development of Novel
Methodologies for the Photoregulation of Biological Processes. (Under the direction of Dr. Alexander Deiters.)
Development of Novel Methodologies for the Photoregulation of Biological Processes
by
Wesleigh Fowler Edwards Georgianna
A dissertation submitted to the Graduate Faculty of North Carolina State University
in partial fulfillment of the requirements for the Degree of
Doctor of Philosophy
Chemistry
Raleigh, North Carolina 2010
APPROVED BY:
Alexander Deiters, PhD Committee Chair
David Muddiman, PhD
Ralph Dean, PhD
Jonathan Lindsey, PhD
ii
DEDICATION
This work is dedicated to
My Mom and Dad, for their unconditional love and guidance,
Steve Buchau, an exemplary teacher and scientist who put me on the right path, Asha Balakrishnan, for sharing piano lessons, tennis balls, and this amazing lifelong
friendship,
The wonderful friends and fellow graduate students I’ve met along the way,
iii BIOGRAPHY
The author, Wesleigh F. Edwards Georgianna, was born December 23, 1982 to parents Bill and Lisa Edwards in Virginia Beach, VA. She grew up at the beach and enjoyed playing tennis and volunteering at Sentara Leigh Hospital in the Emergency and Surgical Recovery Rooms during the summers. After graduating from Norfolk Academy in 2001, she attended Virginia Polytechnic Institute and State University, and worked in the lab of Dr. Timothy Long to investigate the use of poly(lactide)s as vascular sutures. Additionally, she was an Associate Justice with the Virginia Tech Undergraduate Honor System, and earned her Emergency Medical Technician license. She graduated from Virginia Tech in 2005, receiving a B.S. in Biochemistry with a concentration in Biotechnology.
iv
ACKNOWLEDGEMENTS
I express my sincerest appreciation to everyone who has made this work possible. I would particularly like to acknowledge my advisor, Prof. Dr. Alex Deiters, for his research supervision and financial support during my graduate studies. I would also like to thank the former and current members of the Deiters Lab, especially Andrew, Yan, Jeane, Colleen, Jie, Hank, Jesse, and Harry for their humor and advice. Thank you also to my advisory committee for their assistance in the completion of my doctoral research.
Additionally, thank you to those who have particularly contributed to my graduate studies through their guidance and indispensible fellowship. Doug, there are not enough words to tell you how grateful I am for your help over the last five years, and more importantly, your friendship. Virginia, thank you for your research counsel and for always being there to listen, both in graduate school and beyond. Thank you also to Elke, Rania, and Jennifer, with whom I served on PLU and whose camaraderie I very much enjoyed.
v
TABLE OF CONTENTS
LIST OF TABLES………. viii
LIST OF FIGURES………... ix
CHAPTER 1: INTRODUCTION TO PHOTOCHEMICAL BIOLOGY……… 1
CHAPTER 2: PHOTOCHEMICAL REGULATION OF THE POLYMERASE CHAIN REACTION……… 22
2.1 Introduction to the polymerase chain reaction……… 22
2.2 Hybridization studies with photocaged DNA………. 23
2.3 Light-activation of PCR……….. 26
2.4 Light-deactivation of PCR……….. 29
2.5 Concurrent up- and down-regulation of PCR………. 32
2.6 Summary and outlook………. 32
2.7 Experimental methods……….………34
CHAPTER 3: THE EFFECT OF MICROWAVE IRRADIATION ON OLIGONUCLEOTIDE HYBRIDIZATION………. 36
3.1 Introduction to DNA hybridization and microwave irradiation………. 36
3.2 Development of a fluorescence hybridization assay………... 37
3.3 Microwave irradiation of DNA……….. 40
3.4 Summary and outlook………. 48
vi
CHAPTER 4: LIGHT-REGULATION OF PROTEIN FUNCTION THROUGH
PHOTOCAGING……… 52
4.1 Lysozyme………. 52
4.1.1 Introduction to lysozyme………... 52
4.1.2 PhotoPEGylation of lysozyme………... 54
4.1.3 In vitro activity assays of lysozyme function……… 58
4.1.4 Summary and outlook……… 61
4.1.5 Experimental methods………... 62
4.2 Cre Recombinase………... 64
4.2.1 Introduction to DNA recombination and Cre recombinase………... 64
4.2.2 Expression and purification of wild type Cre……… 71
4.2.3 In vitro non-specific caging of lysine residues………... 74
4.2.4 Unnatural amino acid mutagenesis ………... 76
4.2.5 Expression and purification of CreONBY………. 80
4.2.6 In vitro light-activation………... 82
4.2.7 In vivo light-activation to demonstrate spatiotemporal control of gene function…….. 83
4.2.8 Expression of TAT-modified Cre………... 88
4.2.9 Summary and outlook……… 90
4.2.10 Experimental methods………... 91
4.3 Photochemical control over FimE-mediated DNA recombination in E. coli………… 99
4.3.1 Introduction to FimE………... 99
4.3.2 FimE expression and in vivo assays……… 104
vii
4.3.4 Experimental methods………. 106
4.4 Photochemical control over Flpe-mediated DNA recombination in E. coli………… 108
4.4.1 Introduction to Flpe recombinase……….... 108
4.4.2 Expression of wild type Flpe………... 110
4.4.3 The Flpe bacterial assay………... 110
4.4.4 Summary and outlook……….. 113
4.4.5 Experimental methods………. 114
CHAPTER 5: LIGHT-REGULATION OF PROTEIN DIMERIZATION……….. 119
5.1 Introduction to natural and synthetic protein dimerizers……… 119
5.2 Expression and purification of DHFR and In Vitro Dimerization Assays………. 128
5.3 Expression and purification of GFP-DHFR and In Vitro Fluorescent Dimerization Assays………. 132
5.4 In Vivo Dimerization Assays……….. 138
5.5 Summary and outlook………. 139
5.6 Experimental methods……….... 140
CHAPTER 6: THE HALO-TAG AS A PROTEIN-BASED CAGING GROUP……… 148
6.1 Introduction to the HaloTag protein………... 148
6.2 Expression and purification of HaloTag………. 150
6.3 Summary and outlook………. 152
6.4 Experimental methods……… 152
APPENDIX 1: RECIPES………. 155
viii
LIST OF TABLES
ix
LIST OF FIGURES
x
Figure 2.1. The polymerase chain reaction enables to rapid amplification of a DNA
template……….. 22
Figure 2.2. Photodeprotection of the NPOM group (red) to yield thymidine…………... 24
Figure 2.3. PCR activation by light………... 27
Figure 2.4. Agarose gel of dsDNA amplified by light-regulated PCR……….. 28
Figure 2.5. Time-course of a PCR, light-activated at cycle 15……….. 29
Figure 2.6. Light-deactivation of PCR……….. 30
Figure 2.7. Time-course of a PCR light-deactivated at cycle 10………... 31
Figure 2.8. Light-switching between two different PCRs through simultaneous activation and deactivation of primers………... 32
Figure 3.1. Schematic of the fluorescence quenching assay used to determine if microwave irradiation (MW) is capable of melting dsDNA………. 38
Figure 3.2. The CEM Discover microwave synthesizer……… 40
Figure 3.3. Fluorescence signals arising from various conditions employed in the DNA melting experiments with D1F and D1R………... 42
Figure 3.4. Representative power, pressure, and temperature profile graphs show typical reaction conditions at various microwave powers………. 43
xi
Figure 4.1. Lysozyme-catalyzed hydrolysis of acetylmuramic acid and
N-acetylglucosamine………. 53
Figure 4.2. Structure and PEGylation of lysozyme………... 54
Figure 4.3. Structure of the Photo-PEG reagent……… 56
Figure 4.4. SDS-PAGE analysis of lysozyme PEGylation……… 57
Figure 4.5. (NHS)-PEGylation of lysozyme results in partial to complete attenuation of enzyme activity…...………... 58
Figure 4.6. Micrococcus lysodeikticus exposed to different lysozymes for 15 min, followed by an optical density (OD450)measurement……….. 59
Figure 4.7. Micrococcus lysodeikticus exposed to Photo-PEGylated lysozyme followed by an optical density (OD450) measurement after 15 min……… 60
Figure 4.8 Lysis assays performed with varied amounts of wild type lysozyme as compared to irradiated PhotoPEGylated enzyme allowed the calculation of Vmax values and subsequent determination of percent activity restoration to the PhotoPEGylated lysozyme……… 61
Figure 4.9. Site-specific recombination occurs through formation and then resolution of the Holliday junction………. 65
Figure 4.10. Cre recombinase catalyzes the inversion or excision/integration of DNA between two loxP sites………... 66
xii
xiii
Figure 4.25. Expression of TATCre from pTriEx-HTNC yields highly pure protein, as determined by SDS-PAGE analysis……….. 89 Figure 4.26. FimE mediated recombination inverts the promoter (Ptrc*) located between the inverted repeat right (IRR) and inverted repeat left (IRL) of the FimS, leading to GFP expression……… 102 Figure 4.27. FimE recombination as measured by GFP expression levels, which differ greatly between induced and uninduced cultures……… 103 Figure 4.28. Flpe recombinase catalyzes the inversion or excision/integration of DNA between two frt sites……… 109 Figure 4.29. Expression of Flpe recombinase from pET-21Flpe yields pure protein, as determined by SDS-PAGE analysis……… 110 Figure 4.30. The Flpe-mediated DNA recombination reporter assay………. 111 Figure 5.1. CID-mediated protein dimerization enables the bridging of two proteins or two split protein domains……… 120 Figure 5.2. The yeast two-hybrid system……… 121 Figure 5.3. Rapamycin-induced dimerization of FRB and FKBP in a yeast three-hybrid system leads to expression of a reporter gene………. 122 Figure 5.4. Use of the yeast three-hybrid system with a novel DEX-MTX CID leads to expression of β-galactosidase and a blue color upon successful dimerization………… 123
xiv
Figure 5.6. Selective chemical labeled of subcellularly targeted E. coli DHFR in CHO cells……….. 125 Figure 5.7. Yeast three-hybrid assay of TMP-SLF activity……… 126 Figure 5.8. Activation of FucT7 as determined by fluorescent anti-sLex……… 127 Figure 5.9. The novel light-switchable Bis-TMP CID, constructed with a photoresponsive DAB core flanked by two TMP molecules………. 128 Figure 5.10. Expression of wild type E. coli DHFR from pET21-DHFR in BL21(DE3) Gold cells yields high purity protein, as determined by 12% SDS-PAGE analysis……… 129 Figure 5.11. SDS-PAGE analysis of the DHFR activity assay using MTX-resin……... 130 Figure 5.12. The in vitro DHFR dimerization assay………... 131 Figure 5.13. SDS-PAGE analysis of resin-immobilized DHFR incubated with Bis-TMP and irradiated 30 min (365 nm, 25 W)……… 132 Figure 5.14. Expression of GFP-DHFR from pBAD+GFP-DHFR in BL21(DE3) Gold cells yields high purity protein, as determined by 12% SDS-PAGE analysis…………. 133 Figure 5.15.Fluorescence levels in the in vitro DHFR assay using both DHFR and GFP-DHFR………... 135 Figure 5.16. Structure of Bis-MTX-C9 and a schematic depiction of the dimerized nanoring formed when two peptide-linked DHFR molecules are incubated with
xv
1
CHAPTER ONE – INTRODUCTION TO PHOTOCHEMICAL BIOLOGY
2
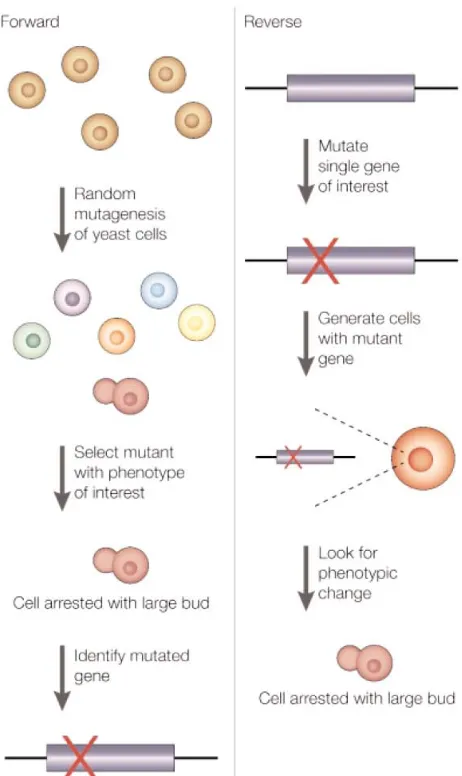
Figure 1.1. Comparison between “forward” and “reverse” genetics approaches, as performed in yeast as a model organism; however, identical approaches can be applied in other organisms as well. A forward genetics approach is a classical genetic screen that seeks to determine the gene(s) responsible for an observed phenotype. In contract, reverse genetics screens study the phenotype effects produced by perturbing a known gene. From Stockwell, B. R. Chem. Rev. Genet. 2000, 1, 116.
3
rapid result in that both means efficiently create random point mutations within the DNA sequence; however, the phenotypic results may be difficult to distinguish from naturally occurring single nucleotide polymorphisms (SNPs),[12] and the mutational process is difficult to control which may thus irreparably damage the organism under study. Method (2) allows easy detection of the inserted sequences and subsequent phenotype identification, but shares the same limitations as Method (1).[13] Method (3) has been particularly useful, specifically in the generation of targeted gene knockouts in model organisms such as the mouse,[14] as a gene may be deleted or inserted through the use of recognition sites located engineered into the genome at specific positions. Of all the previously described methods, (4) is regarded as an especially powerful tool for perturbing gene function,[15] as RNAi can effectively silence a single target RNA transcript that is present in thousands of copies per cell, leading to a discernible phenotype directly correlated to the gene.[15]
4
fashion. Thus, the use of light allows a fine level of control over biological processes to subsequently enable robust studies of gene function and processes in vivo without damage to the system. Additionally, as light irradiation is non-invasive, its utilization does not affect natural interactions within the system. This is in contrast to aforementioned techniques, whose introduction into the cell or organism can perturb multiple biological functions.
5
hydroxyls, and amines.[21] Several small molecules,[27-29] nucleic acids,[30-33] and proteins[34-37]have been photocaged successfully.
A.
B.
Figure 1.2. Light-irradiation of a caged substrate. A. Conceptual scheme for a decaging reaction. B. Generation of an active molecule from an inactive, caged molecule by removal of the o-nitrobenzyl derived caging group with UV light. R = H, CH3 or CO2H; X = O, N, or S.
6
7
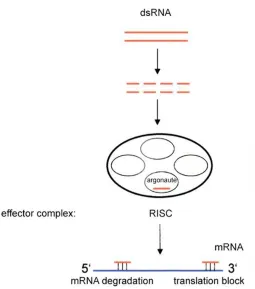
Figure 1.3. The RNAi pathway is initiated by dsRNA to down-regulate gene expression. Formation of the RISC effector complex leads to mRNA degradation or steric blocking of translation. Adapted from Carthew, R. W. Curr. Opin. Genet. Dev., 2006, 16, 203.
8
More recently, the use of photolabile protecting groups installed on siRNAs has enabled the regulation of gene knockdown in a temporal fashion.[63, 64] Caging groups installed on the nucleobases or the phosphodiester backbone of RNA have been used to prevent Dicer activity and the siRNA-RISC interaction, as well as inhibit scission of the RNA target within the RISC. For example, Mikat and Heckel inserted nitrophenylpropyl (NPP) caging groups at the O-4 and O-6 postions of thymidine and guanosine, respectively.[65] The NPP groups inhibit hydrogen bonding and prevent base pairing, forming a bulge between the siRNA and mRNA target within the RISC that attenuates cleavage. Prior to irradiation, the caged siRNA was unable to catalyze RNA scission in the RISC. Upon UV exposure, the caging groups were removed and base pairing restored, leading to RISC-induced cleavage and successful RNAi.
9
strategy resulted in efficient removal of the DMNPE groups from the dsRNA, eliminating any phototoxicity associated with long periods of UV irradiation.[66]
10
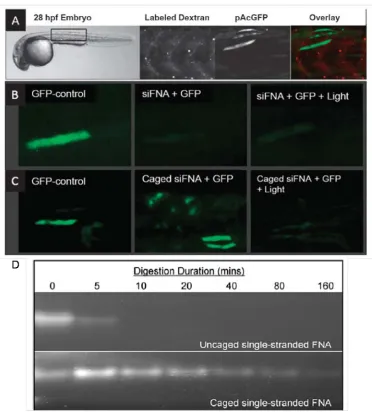
Figure 1.4. Evaluation of the light-activation of RNAi in zebrafish embryos. A. Injection analysis. Dextran tracking dye was observed throughout the injected region, demonstrating a successful injection (left panel), while delivery of a GFP expression plasmid showed mosaic expression, as expected (middle panel). Overlay of the dextran dye and GFP signals (right panel). B. Knock-down activity with no siRNA (left panel), with control siFNA (middle panel) and with irradiated control siFNA (right panel). Irradiated and nonirradiated control siFNA produced identical GFP knock-down and demonstrated that light has no effect on RNAi activity. C.
Caged siFNA (middle panel) produces no GFP knock-down, resembling the GFP control (left panel); however, irradiation (365 nm, 40 J cm-2, 7 hours post-ferzilization) resulted in silencing of gene expression (right panel).
D. While the 2’fluoro-modification protected the nucleic acids from non-specific endonuclease degradation for about 5 min, the DMNPE modification on the FNA provided more than 80 min of protection. Adapted from Blidner, R. A.; Svoboda, K. R.; Hammer, R. P.; and Monroe, W. T. Mol. Biosyst. 2008, 4, 431.
11
Another example of a novel photocaging strategy that could be applied to functional genomics involves the use of caging groups to spatiotemporally regulate antisense techniques. This methodology provides an additional way to perturb gene function followed by phenotypic analysis.[68, 69]. Antisense agents are comprised of DNA or modified DNA, such as phosphorothioate DNA (PS-DNA),[70] morpholinos (MOs),[71] locked nucleic acids (LNAs),[72] and peptide nucleic acids (PNAs).[73] Each agent modulates gene expression at the translational level to prevent protein production by inducing enzymatic degradation or steric blocking of mRNA. In the case of DNA and PS-DNA, the enzyme RNaseH degrades the RNA strand of the (PS-)DNA:RNA duplex, thereby degrading the target mRNA.[74] However, RNaseH does not recognize MOs, LNAs, or PNAs, and these agents prevent translation by blocking access of the mRNA to the ribosome.[75]
12
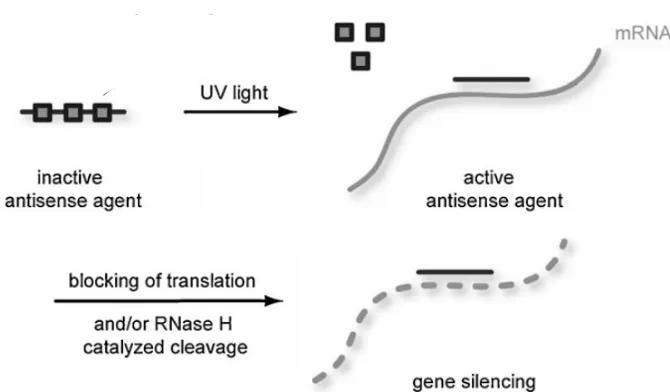
hybridize.[20, 77-80] Subsequent RNaseH degradation or prevention of translation thus occurs (Figure 1.5).
Figure 1.5. Light-regulation of antisense activity through the incorporation of light-removable caging groups (grey squares). Brief UV irradiation at 365 nm removes the caging groups, enables sequence-specific mRNA binding, and blocks translation or activates RNaseH catalyzed cleavage of the transcript. From Young, D. D.; Lusic, H.; Lively, M. O.; Yoder, J. A.; and Deiters, A. ChemBioChem. 2008, 1318, 2937.
.
13
the ntl gene (Figure 1.6). The Chen group thus demonstrated the applicability of photocaged antisense agents to the temporal control of gene expression in a model organism.[78]
A.
B. C.
D. E.
F.
14
15
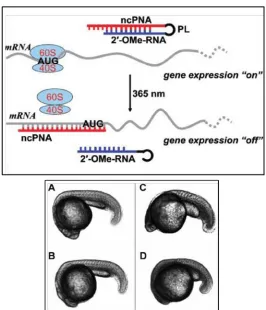
Figure 1.7. Use of a light-activated anti-chordin negatively-charged PNA (ncPNA) to control gene expression in zebrafish embryos. The antisense ncPNA strand is blocked by a 2’-OMe sense strand; the two strands are attached via a 1-(5-(N-maleimidomethyl)-2-nitrophenyl) ethanol N-hydroxysuccinimide ester photocleavable linker. In the absence of irradiation, the antisense strand cannot bind its mRNA target and the chordin gene is expressed. Upon irradiation and photolysis of the linker, the antisense ncPNA hybridizes to its target and inhibits translation. A-D. Transmitted light images of representative zebrafish embryos 24 h post-fertilization.
A. The uninjected embryo exhibits normal development. B. In the absence of irradiation, injection with 0.5 mM ncPNA-2’-OMe-RNA results in a normal embryonic phenotype. C. In the absence of irradiation, injection with 1.0 mM ncPNA-2’-OMe-RNA results in a normal embryonic phenotype. D. An embryo injected with 0.5 mM ncPNA-2’-OMe-RNA and irradiated 8 min, 3 h post-fertilization, displays the mutant chordin phenotype with a small, underdeveloped backbone. Adapted from Tang, X.; Maegawa, S.; Weinberg, E. S.; Dmochowski, I. J. J. Am. Chem. Soc. 2007, 129, 11000.
16
Thus, the complementary strand prevents the morpholino from hybridizing to its target mRNA. Upon light irradiation, the complementary strand is removed, enabling the morpholino to bind to its mRNA target and inhibit translation.
Figure 1.8. Formation and light-activation of the PhotoMorph heteroduplex. The morpholino and caging strand are hybridized to form the PhotoMorph. UV irradiation (365 nm) cleaves the caging strand at the photocleavable linker, causing the strand to dissociate and liberating the morpholino. From Tomasini, A. J.; Schuler, A. D.; Zebala, J. A.; Mayer, A. N. Genesis 2009, 47, 736.
17
irradiated (365 nm) four hours post-fertilization. Zebrafish injected with the MO displayed no GFP fluorescence, while those injected with the GFP PhotoMorph showed fluorescence in the absence of UV irradiation (Figure 1.9, A). However, a 90% knock-down in fluorescence was detected in irradiated embyos compared to the uninjected control, illustrating that the PhotoMorph is an efficient, light-activated antisense technique.
18
Figure 1.9. PhotoMorph efficacy in zebrafish embryos. A. The GFP PhotoMorph displays little activity prior to light-irradiation, as compared to the wild type, uninjected control, while embryos injected with non-caged MO showed no GFP fluorescence. Irradiaton of the PhotoMorph four hours post-fertilization resulted in a 90% decrease in fluorescence compared to the wild type. B. Embryos injected with the ntl PhotoMorph display no mutant phenotype prior to light-irradiation, while injection with non-caged MO results in the no tail phenotype. Embryos injected with the ntl PhotoMorph and irradiated 1.5 hours post-fertilization show a mutant phenotype similar to the non-caged MO control. This phenotype is less severe when irradiation occurs 4 hours post-fertilization. When irradiated 9 hours post-fertilization, the ntl PhotoMorph-injected embryos display a normal phenotype. Adapted from Tomasini, A. J.; Schuler, A. D.; Zebala, J. A.; Mayer, A. N. Genesis 2009, 47, 736.
19
the Renilla luciferase gene.[83] A PS-DNA control with no silencing activity was also transfected. Cells were then briefly irradiated at 365 nm and the luciferase signal quantified (Figure 1.10). The non-caged PS-DNA successfully silenced luciferase expression, while the PS-DNA control showed no silencing, as compared to non-transfected cells. Importantly, 3- and 4-caged PS-DNA showed no activity until irradiation; the luciferase signal was then decreased to that of the non-caged PS-DNA. In this manner, temporal control over gene expression was achieved.
Figure 1.10. Renilla luciferase signal after PS-DNA transfection and ± UV irradiation (365 nnm, 23 W, 5 min), normalized to the transfection of the non-caged PS-DNA antisense agent. The signal for non-irradiated 3- and 4-caged PS-DNA is comparable to that of the control and non-transfected cells. However, upon irradiation and removal of the caging group, the antisense agents successfully knock-down gene expression, as evidenced by a decrease in luciferase signal similar to that of the non-caged control. From Young, D. D.; Lusic, H.; Lively, M. O.; Yoder, J. A.; Deiters, A. ChemBioChem. 2008, 9, 2937.
20
transfected with 3- or 4-caged PS-DNA displayed little to no luciferase activity (Figure 1.11) In contrast, cells containing no caged PS-DNA and expressing luciferase showed no decrease in gene expression as compared to cells harboring the non-irradiated 3- and 4-caged PS-DNA. Thus, it was demonstrated that photocaged PS-DNA could effectively provide spatial and temporal control over gene expression, inhibiting RNaseH activity until UV irradiation removed the caging groups and restored active PS-DNA.
Figure 1.11. Spatial regulation of Renilla luciferase expression in NIH-3T3 cells with caged PS-DNA antisense agents. The cellular monolayer was irradiated only within the white dashed circle. A. Negative control with no luciferase expression. B. Cells expressing luciferase and harboring 3-caged PS-DNA. C. Cells expressing luciferase and harboring 4-caged PS-DNA. D. Positive control without PS-DNA. E. Positive control without PS-DNA and no irradiation. F. Cells expressing luciferase and transfected with inactive control PS-DNA. From Young, D. D.; Lusic, H.; Lively, M. O.; Yoder, J. A.; and Deiters, A. ChemBioChem. 2008, 1318, 2937.
21
the use of techniques from both fields toward the development of methodologies to control biological processes with light. To accomplish this, approaches were developed to photoregulate the activity of proteins and nucleic acids, both in vitro and in vivo. Specifically, this research has the following objectives:
(1) Light-regulation of the polymerase chain reaction (PCR) using photocaged oligonucleotides.
(2) Investigation of the effects of microwave irradiation on nucleic acid hybridization. (3) Light-regulation of enzymatic function by bionconjugating a protein with
photocleavable polyethylene glycol (photo-PEG) groups.
(4) Light-regulation of recombinase enzymes by installing a caging group site-specifically on the protein to enable photochemical control over DNA recombination. (5) Light-regulation of protein-dimerization by using a reversibly photoswitchable small
molecule dimerizer.
22
CHAPTER TWO – PHOTOCHEMICAL REGULATION OF THE POLYMERASE CHAIN REACTION
2.1 Introduction to the Polymerase Chain Reaction
The polymerase chain reaction (PCR), developed by Kary Mullis,[84] is employed in the in vitro isolation and exponential amplification of specific DNA sequences.[85-87] The reaction utilizes a thermophilic DNA polymerase and requires two oligonucleotide primers designed to anneal to the DNA template via Watson-Crick base pairing, and concomitantly flank the region of interest. Repeat cycles of varying temperature allow for denaturation, primer annealing, and polymerase-mediated extension. In a short time, extremely small amounts of DNA can be exponentially enriched to substantial quantities (Figure 2.1).
Figure 2.1. The polymerase chain reaction enables rapid amplification of a DNA template.
23
differing levels of transcriptional fidelity, i.e. error rate. The commonly used Taq DNA polymerase from Thermus aquaticus has a rate of 2.28×10⁻⁵
errors per nucleotide per cycle (e/n/c),[88] while higher fidelity DNA polymerases such as Vent (NEB) from Thermococcus litoralis and Phusion (Finnzymes) from Pyrococcus furiosus possess a rate of 3.32×10⁻⁶
and 4.40×10⁻⁷
e/n/c, respectively.[89, 90] In the years since its inception, PCR has
revolutionalized the field of molecular biology, making possible whole genome sequencing and paving the way for genetic disease diagnosis and genetic fingerprinting.[91, 92] Photochemical regulation over this important reaction could afford several advantages, including time-dependent amplification of different genes and temporal control during real-time quantitative PCR experiments. We have thus utilized photocaged oligonucleotide primers to perform phototriggered DNA amplification through both activated and light-deactivated PCR.
2.2 Hybridization Studies with Photocaged DNA
24
Figure 2.2. Photodeprotection of an NPOM-caged thymidine (the caging group is shown in blue) to yield thymidine.
To implement the caging strategy toward the photoregulation of PCR, we first studied the ability of one or more caging groups to disrupt complementary base pairing. The corresponding caged thymidine phosphoramidite was incorporated into DNA oligomers using standard DNA synthesis equipment and protocols. The DNA oligomers P1-P7,
25
Table 2.1. Melting temperatures of non-caged (P1) and caged (P2-P7) oligonucleotides before and after irradiation. T* denotes caged thymidine; melting temperatures (Mp) determined with the non-caged complement 5’ CGAACCTGGTCGAAATCAG 3’; ND = not detectable.
Melting curves were measured on a BioRad MyiQ RT-PCR thermocycler by conducting a sequence of three heating and cooling cycles (1µM of both primer and complementary DNA with 12.5 µL iQ SYBR Green Supermix to a total volume of 25µL; 40 o
C to 80 oC with a 0.5 oC/min ramp). The melting temperatures were determined to be 65.3 o
C (P1), 62.1 oC (P2), 54.3 oC (P3), 55.5 oC (P4), and 50.0 oC (P6). P5 and P7 did not hybridize and thus, there were no detectable melting temperatures. Our results indicate that both the number of caging groups and the position of the caged thymidine residues affect DNA hybridization. Installation of a single caging group results in a melting temperature depression of 3.2 oC and 11.0 oC as seen in P2 and P3, respectively. This effect is less pronounced in P2, most likely due to the close proximity of the caged T to the 5’ terminus, which leads to a lower level of interference with the hybridization of neighboring nucleotides. Very similar melting point depressions and positional variations have previously
DNA Sequence Mp / oC − UV Mp / oC +UV
P1 5’ CTGATTTCGACCAGGTTCG 3’ 65.3 ± 0.3 65.0 ± 0.8
P2 5’ CT*GATTTCGACCAGGTTCG 3’ 62.1 ± 0.7 64.1 ± 0.2
P3 5’ CTGATTT*CGACCAGGTTCG 3’ 54.3 ± 1.1 64.1 ± 0.8
P4 5’ CT*GATTT*CGACCAGGTTCG 3’ 55.5 ± 0.5 63.8 ± 0.3
P5 5’ CT*GATTT*CGACCAGGTT*CG 3’ NA 64.2 ± 0.2
P6 5’ CTGAT*T*T*CGACCAGGTTCG 3’ 50.0 ± 1.0 64.5 ± 0.5
26
been observed in T-mismatches.[97, 98] With the incorporation of additional caging groups in P4 and P6, melting temperatures generally decrease further. However, addition of a single caged thymidine close to the 5’ terminus of P3 had no effect in P4. A positional effect was observed with three caging groups, as seen in P5 and P6. The primer P6 contains three adjacent caged thymidines near its 5’ end; these caging groups disrupt 5’ hybridization, but do not interfere with the hybridization of nucleotides located at the 3’ end, leaving twelve noncaged nucleotides to effectively prime the template DNA. P5, whose melting temperature could not be detected, contains three caging groups distributed throughout the DNA oligomer, leading to a more effective disruption of hybridization. In order to ensure complete removal of the photolabile group, each primer was irradiated for 8 minutes at 365 nm, then analyzed in the same melting temperature assay. Irradiation fully restored DNA hybridization, as each primer displayed a comparable melting temperature to the non-caged analog P1. In summary, an NPOM caging group positioned every six to nine bases and evenly distributed throughout the oligonucleotide efficiently disrupts DNA:DNA hybridization. Identical observations were made for DNA:RNA hybridization.[77]
2.3 Light-Activation of the Polymerase Chain Reaction
27
with the monomeric caged thymidine and was found to be unaffected by the elevated
temperatures required for PCR, P5 was utilized in a light-activated PCR experiment (Figure 2.3). All reactions described herein employed the same reverse primer (5’ AGAGAGCTCGAGATCGCCATCTTCCAGCAGGCGCACCATTGCCCCTGT 3’).
Figure 2.3. PCR activation by light. Black line: template; single blue line: primer; double blue line: product; red circle: caged thymidine.
A control PCR reaction with non-caged and irradiated P1 produced approximately 140 ng of the expected ~0.6 kb PCR product (Figure 2.4, lane 5); however when caged P5
28
Figure 2.4. Agarose gel of dsDNA amplified by light-regulated PCR. UV+ indicates reactions that were irradiated, while UV- denotes no irradiation; L = DNA ladder; lanes 1-4 show the results for PCRs performed with truncated wild type (P10), wild type (P8) or caged (P9) hairpin primers; lanes 5-7 show the results for PCRs performed with wild type (P1) or caged (P5) linear primers; lanes 8-10 show the simultaneous activation and deactivation of PCR with light using primers P5 and P9.
29
Figure 2.5. Time-course of a PCR, light-activated at cycle 15. Error bars were obtained from three independent experiments.
2.4 Light-Deactivation of the Polymerase Chain Reaction
30
Figure 2.6. Light-deactivation of PCR. Black line: template; single green line: primer; double green line: product red circle: caged thymidine.
31
groups were removed, leading to hairpin formation and suppression of DNA amplification (Figure 2.4, lane 4).
These light-regulatory mechanisms could also be employed in a temporally controlled fashion by irradiating the caged primer after 10 cycles of PCR (Figure 2.7). The non-caged primer P8 was used as a control, as it formed a hairpin immediately and blocked Taq DNA polymerase and any subsequent amplification. Because the caged primer P9 was able to bind to the DNA template, amplification occurred. The reaction containing P9 was irradiated at cycle 10, leading to removal of the caging groups, hairpin formation, and effective inhibition of DNA amplification. At the same point, amplification continued in the non-irradiated reaction with P9.
Figure 2.7. Time-course of a PCR light-deactivated at cycle 10. Error bars were obtained from three independent experiments.
32
2.5 Concurrent Up- and Down-Regulation of PCR
With the two caged primers P5 and P9 possessing opposing effects on the PCR reaction upon light irradiation, it was possible to use both primers simultaneously to stop the production of one PCR product, while also triggering the amplification of a different PCR product via irradiation with UV light (Figure 2.8). Thus, P5, P9,and the reverse primer were included in the PCR reaction mixture. A product band of ~1.0 kb was detected in the non-irradiated reaction after 20 cycles, which is attributed to the active, caged and non-hairpin forming P9, and the inhibited, caged P5 (Figure 2.4, lane 9). Alternatively, a product band of ~0.6 kb was observed in the irradiated reaction, as a result of the decaging of P5, and the decaging and subsequent hairpin formation of P9 (Figure 2.4, lane 10). As expected, both bands were observed in the control reaction using non-caged and non-hairpin primers (Figure 2.4, lane 8).
33
2.6 Summary and Outlook
In summary, a photochemical activation and deactivation of the polymerase chain reaction has been developed. This was accomplished through the incorporation of multiple caged thymidine phosphoramidites into oligonucleotide primers using standard DNA synthesis protocols. By effectively disrupting DNA hybridization with caging groups and then restoring it with light irradiation, it was possible to control activation and deactivation of PCR in a temporal fashion. Moreover, by conducting a simultaneous activation and deactivation, light switching from one DNA amplification product to another was achieved.
34
2.7 Experimental Methods
PCR Conditions. Taq DNA polymerase, Taq reaction buffer and nucleotide triphosphates (dNTPs) were purchased from New England Biolabs (NEB). pET-21Cre (see Chapter 4.2) served as the DNA template in all reactions. 75 ng of templatewas incubated in the presence
of P5 and a reverse primer
(5’AGAGAGCTCGAGATCGCCATCTTCCAGCAGGCGCACCATTGCCCCTGT 3’, 1 μM each; the same reverse primer was used in all PCRs) with dNTPs (0.3 mM each), Taq
Reaction Buffer (10 mM Tris-HCl, 50 mM KCl, 1.5 mM MgCl2, pH 8.3) and water in a total volume of 50 µL. Taq DNA Polymerase (0.3 μL) was then added to initiate the reaction. An initial denaturation at 95 °C was performed, followed by 40 cycles consisting of 95 °C (30 sec), 50 °C (30 sec), and 72 °C (1 min), with a final extension at 72 °C (2 min). The reactions were conducted in triplicate, then run on a 1% agarose gel. The gel was stained with ethidium bromide (10 µL of 1 mg/100 ml ethidium bromide in water), visualized on a transilluminator (254 nm), and quantitated by band integration of the ethidium bromide-stained agarose gels using Image Quant 5.2. Additional experiments conducted with photocaged primers may require optimization of annealing temperature, as demonstrated with the photocaged primers synthesized by TriLink Biotechnologies. With these primers, an increase in annealing temperature from 50 °C to 55 °C was necessary to prevent non-specific amplification.
35
36
CHAPTER THREE – THE EFFECTS OF MICROWAVE IRRADIATION ON DEOXYOLIGONUCLEOTIDE HYBRIDIZATION
3.1 Introduction to DNA Hybridization and Microwave Irradiation
37
3.2 Development of a Fluorescence Hybridization Assay
38
hν
heat or MW
+ + + + cool hν + + + fluorescence
Figure 3.1. Schematic of the fluorescence quenching assay used to determine if microwave irradiation (MW) is capable of melting dsDNA. Open circle = fluorophore (fluorescein); closed circle = fluorescence quencher (dabcyl).
In order to probe the viability of the assay, we designed dsDNA with a calculated Tm >70 °C, and obtained the complementary fluorophore- and quencher-modified (D1F* & D1R*) and unmodified oligomers (D1F & D1R)(Alpha DNA Technologies)(Table 3.1).
Table 3.1. Sequences and melting temperature of DNA oligomers. F* contains a fluorescein label at the 5’ end; R* contains a dabcyl label at the 3’ end.. Calculated Tm values were determined using the Oligo Analyzer 3.1 (IDT DNA). Actual (fluorescein-labeled and dabcyl-labeled DNA) and Non-labeled DNA Tm values were determined in triplicate on a BioRad MyiQ RT-PCR thermocycler.
DNA DNA Sequence Calculated Tm / oC Actual Tm / oC
D1F* D1R*
5’ CGCACCCAGGCTTAGCTACAAACAT 3’
5’ GCGTGGGTCCGAATCGATGTTTGTA 3’ 61.4 81.5 ±0.4
D2F* D2R*
5’ CCCAGGCTTAGCTACA 3’
5’ GGGTCCGAATCGATGT 3’ 50.6 66.2 ±0.3
D3F* D3R*
5’ AGGCTTAGCTACA 3’
5’ TCCGAATCGATGT 3’ 39.9 51.5 ±0.3
Non-labeled Tm / °C
80.9 ± 0.3
66.0 ± 0.4
39
We first verified that the non-labeled and labeled oligo pairs had similar melting points to ensure that there was no measurable effect of the dabcyl and fluorescein dyes on the behavior of the hybridized pairs. The melting temperatures of all oligonucleotide pairs (D1F*:D1R*, D2F*:D2R*, and D3F*:D3R*) were determined on a BioRad MyiQ RT-PCR thermocycler by conducting a sequence of three heating and cooling cycles, while measuring the increase of fluorescence due to the loss of the quencher in the melting process. As expected, melting temperatures for the non-labeled oligos were found to be identical, within the error margin of the experiment, to those obtained using the fluorescently modified oligomers (Table 3.1). It is unclear why there is a large discrepancy between the calculated and actual Tm values.
Initial hybridizations were conducted thermally (Eppendorf Mastercycler, 95 oC (5 min), 37 oC (30 min), 4 oC (30 min)) to generate the two sets of double stranded DNA. A 1:1 ratio of dabcyl-modified oligomer to fluorescein-modified oligomer was employed to sufficiently afford hybridization and effectively suppress the fluorescence signal in
D1F*:D1R* (Figure 3.2, column 1). A positive control experiment was conducted by hybridizing D1F* and D1R to determine the maximum attainable fluorescence signal (Figure 3.2, column 2). Additionally, a thermal comparison control experiment was performed in which we employed a ten-fold excess of the non-labeled dsDNA D1F:D1R
40
(D1F*:D1R), as upon melting and subsequent hybridization, the labeled DNA can reanneal to its labeled complement forming D1F*:D1R* and thus quench fluorescence (Figure 3.1).
3.3 Microwave Irradiation of DNA
To differentiate between microwave effects and thermal effects on the melting of dsDNA, experiments were conducted in a CEM Discover microwave synthesizer (Figure 3.2) equipped with a jacketed reaction vessel enabling temperature control through the continuous flow of coolant while precisely measuring the temperature using a fiber optics probe (CEM Coolmate).
A. B.
Figure 3.2. The CEM Discover microwave synthesizer. A. In the CEM Discover single-mode microwave cavity, the sample is located in the center of the cavity and focused microwaves are generated and used to irradiate the sample. B. The jacketed reaction vessel allows robust cooling of the sample during microwave irradiation through the continuous circulation of cryogenic coolant around the sample compartment. Images obtained from www.cem.com.
41
By attempting to melt DNA at temperatures well below the calculated melting point (e.g. –20 to 20 °C), we could demonstrate that the melting was a direct effect of the microwave irradiation, and not due to a thermal influence that could convolute the results. Thus, the pre-hybridized oligomers were mixed and subjected to various conditions to probe hybridization. The mixture of dsDNAs D1F*:D1R* and D1F:D1R
42 0 200 400 600 800 1000 1200 1400
D1F*:D1R*
A -DNA:
Temp.: MW:
D1F*:D1R*
D1F:D1R
B 300 W
D1F*:D1R*
D1F:D1R
A
-D1F*:D1R*
D1F:D1R
B
-D1F*:D1R
A -rel at iv e f luor es ce nc e uni ts
Figure 3.3. Fluorescence signals arising from various conditions employed in the DNA melting experiments with D1F and D1R. All assays were conducted in triplicate and error bars represent standard deviations. Temperature profiles: A) 95 °C to 4 °C; B) –20 °C to 20 °C to –20 °C. D1F* = 5’ fluorescein-labeled D1F;
D1R* = 3’ dabcyl-labeled D1R. Initially the D1F*/D1R* dsDNA was added, followed by the addition of non-labelled D1F/D1R to monitor the changes in hybridization under the various experimental conditions.
43 -25 -20 -15 -10 -5 0 5 10 15 20 25 30
0 20 40 60 80 100 120 140
A -40 -20 0 20 40 60 80
0 10 20 30 40 50
B -40 -20 0 20 40 60 80 100 120
0 5 10 15 20 25 30
Time/s C
44
In order to ensure that no single-stranded DNA breaks occurred during microwave irradiation, aliquots of the reaction mixture containing D2F*, D2R*, D2F, and D2R were run on a 13% denaturing PAGE gel. As expected, only one band was present for each experiment; no streaking or smears were evident, indicating that the DNA remained intact during irradiation at 5-200 W (Figure 3.5). We were unable to determine, however, whether the DNA sustained damage to individual bases.
M 1 2 3 4 5 6 7
Figure 3.5. Microwaved DNA sustains no damage as detected with denaturing PAGE. Aliquots of
D2F*:D2R*:D2F:D2R hybridizations were subjected to microwave irradiation and analyzed by PAGE through ethidium bromide staining. Only a single band is visible in each lane. M: marker (hybridized D2F*:D2R* with no irradiation); 1: 0 W; 2: 5 W; 3: 75 W; 4: 112 W; 5: 115 W; 6: 175 W: 7: 200 W.
45
irradiation of 300 W (Figure 3.3, column 5) yielded a fluorescence signal identical with the positive control under thermal conditons (95 °C, Figure 3.3, column 3). This indicates that microwave irradiation is capable of inducing complete DNA melting at temperatures well below the 81.5 °C melting pointof the D1F:D1R DNA duplex.
46
0 50 100 150 200
1000 1500 2000 2500 3000 3500 D1 D2 D3 rel at iv e f luor es cenc e uni ts
power / W
Figure 3.6. Microwave melting curves indicate that microwave irradiation induces DNA melting at a specific power regardless of the duplex length. Oligomers were combined and subjected to a variety of microwave powers under similar thermal profiles (–20 °C to 20 °C to –20 °C). All assays were conducted in triplicate and error bars represent standard deviations.
Interestingly, all of the DNA sequences have similar inflection points at 111 W (D1), 117 W (D2), and 100 W (D3), as determined by differentiation of the sigmoidal curves shown in Fig. 3. Although each oligo pair possesses a different thermal melting temperature, they all melt at virtually the same microwave power (109 ± 8 W). This result
47
DNA,[130] while simultaneously interacting with the DNA leading to hydrogen bond disruption and DNA melting. Investigations into the dielectric permittivity of DNA have shown that DNA dispersion and melting can be correlated with counterion fluctuations on short sections of the double helix.[131, 132] The microwave irradiation could disrupt cation binding to the negatively charged DNA, as cations and anions align with the electromagnetic field, thus moving them in opposite directions.[109].
48
3.4 Summary and Outlook
In conclusion, we have demonstrated a new mechanism for disrupting DNA hybridization at temperatures much lower than necessary under purely thermal heating by employing microwave irradiation. Interestingly, the microwave irradiation yields a different hybridization disruption than thermal heating, as complementary DNA oligomers with varying lengths all melted at identical microwave powers. This finding suggests a specific interaction of microwave irradiation with deoxyoligonucleotides. Microwave systems enabling online analyses of DNA melting will be required to elucidate the true mechanism. It is now clear that microwave irradiation contributes to the melting of dsDNA at a specific power (109 ± 8 W), regardless of duplex Tm. As dsDNA
49
microwave-assisted DNA technologies, particularly in the area of high-throughput screening and genome analysis.
3.5 Experimental Methods
General. All hybridization experiments were perfomed in a CEM Discover microwave reactor equipped with a Coolmate system, which circulated chilled (–60 oC), microwave transparent fluid through a jacket reaction vessel to allow the maintenance of low temperatures during microwave irradiaton. The CEM Discover system is a single-mode cavity allowing for focused delivery of microwave irradiation (Figure 4.4). All reactions were conducted at a constant microwave frequency of 2450 MHz.[137]
50
Microwave Hybridizations. Non-labeled complementary DNA oligomers were purchased from IDT DNA and suspended in distilled water to a stock concentration of 200 μM. 40 μL of the initial hybridization reactions were mixed with 7 μM of each complement oligomer in 50 μL of 10X hybridization buffer and distilled water to a final volume of 500 μL. Each reaction was transferred to a microwave reaction vial containing a stir bar. Samples were cooled to –20 °C, irradiated at the appropriate power until the temperature of the reaction reached 20 °C, then cooled to 0 °C, with typical reaction times from 30 sec to 5 min.
Thermal Hybridizations. Following initial hybridizations, thermal hybridization reactions were set up with non-labeled DNA complements as described for microwave hybridizations, then returned to the Eppendorf Mastercycler and heated to 95 °C for 5 minutes, 37 °C for 30 minutes, and then cooled to 4 °C to ensure complete hybridization.
51
52
CHAPTER FOUR – LIGHT-REGULATION OF PROTEIN FUNCTION THROUGH PHOTOCAGING
4.1 PhotoPEG, a New Reagent for the Photochemical Control of Protein Function
4.1.1 Lysozyme as a Model Protein
53
Figure 4.1. Lysozyme-catalyzed hydrolysis of N-acetylmuramic acid (NAM) and N-acetylglucosamine (NAG) the components of gram-positive bacterial cell walls. Adapted from Kuroki, R.; Weaver, L. H.; and Matthews, B. W. Proc. Natl. Acad. Sci. 1999, 96, 8949.
54
365 nm
A. B.
Figure 4.2. Structure and photochemical dePEGylation of lysozyme. A) Lysozyme contains six solvent-accessible lysine residues (yellow) and an N-terminus that are readily PEGylated. B) PEGylation completely inhibits enzymatic activity until the PEG units are removed with light irradiation.
4.1.2 PhotoPEGylation of Lysozyme
PEG groups have been used extensively in biological and pharmaceutical applications to improve the pharmacokinetic properties of biomolecules.[145, 147-149] PEG-bioconjugates provide enhanced in vivo stability and are nontoxic and non-immunogenic.[150-152] They are typically generated from proteins through a process termed “PEGylation”, which involves the surface installation of PEG groups through a covalent reaction with amino functionalities, e.g. the ε-NH2 of lysine. PEGylation greatly enhances the
solubility, half-life, cellular uptake, and bioavailability of proteins in cells and organisms.[147, 153, 154] A number of PEGylated therapeutics have been approved by the FDA and are currently on the market,[155-157] demonstrating the growing interest in PEGylation chemistry toward drug delivery and protein stabilization.
55
site of an enzyme.[158] The bulk of the PEG polymer wraps around the protein, thus providing the desired protective effects by sterically blocking it without perturbing the conformation and dynamics of the protein native fold.[159, 160] For this reason, PEGs containing an ester linkage for tethering to the biomolecule have been developed that are susceptible to spontaneous hydrolysis and provide a slow release pathway for protein delivery.[158, 161] While hydrolyzable linkers facilitate general release of the active therapeutic over time, a means to obtain precise spatial and temporal control over bioavailability without compromising stability would be advantageous.
We reasoned that the installation of a photolabile PEG directly onto a protein would provide a “PEG photocage” that can inhibit protein activity (Figure 4.2, B). Upon irradiation with non-phototoxic UV light, the PEG photocage will be removed from the protein, thus restoring its native activity. Since UV irradiation can be precisely controlled with high spatial and temporal resolution, this methodology provides a fundamentally new approach to achieve spatio-temporal control over protein activity. We thus utilized the first photocleavable PEG reagent (PEG) in the photochemical control of a Photo-PEGylated lysozyme.
56
ortho-nitrobenzyl core that confers light sensitivity (see Chapter 1, Figure 1.2). The Photo-PEG reagent also bears a terminal N-hydroxysuccinimide (NHS) ester that makes the Photo- PEG-linker moiety susceptible to nucleophilic attack by a primary amine. Lysozyme was thus reacted with the novel Photo-PEG that was synthesized by Dr. Harry Lusic (Deiters Lab).
Figure 4.3.A. The PhotoPEG reagent; B. Structure of the lysine-Photo-PEG conjugate on lysozyme. Only one PEGylated site is shown.
57 175
80 58 46
30 25
17
M 1 2 3 4 5 6 7 8
Figure 4.4. SDS-PAGE analysis of lysozyme PEGylation. M: protein maker (in kDa); lane 1: wild-type lysozyme; lanes 2-6: PEGylation with 1, 5, 10, 25, and 50 equiv. of NHS-PEG, respectively; lane 7: PEGylation with 50 equiv. Photo-PEG; lane 8: Photo-PEG modified lysozyme from lane 7 after UV exposure (365 nm, 25 W, 30 min).
58
0 0.1 0.2 0.3 0.4 0.5 0.6 0.7
0:00 4:48 9:36 14:24 19:12
O
D
450
Time
no lysozyme 5eq NHS-PEG 10eq NHS-PEG 25eq NHS-PEG 50eq NHS-PEG
Figure 4.5. (NHS)-PEGylation of lysozyme results in partial (5 to 25 eqiv) to complete (50 equiv) attenuation of enzyme activity, as measured by a decrease in optical density at 450 nm.
4.1.3 In Vitro Activity Assays of Lysozyme Function
59
were completely inactive, since the same OD450 was observed as in the absence of any lysozyme (Figure 4.6).
Photo-PEG lysozyme NHS-PEG lysozyme wt lysozyme no lysozyme
0.0 0.2 0.4 0.6 0.8 1.0 1.2
OD450
Figure 4.6. Micrococcus lysodeikticus exposed to different lysozymes for 20 min, followed by an optical density (OD450) measurement. Wild-type lysozyme leads to complete cell lysis. In contrast, lysozymes PEGylated with the NHS-PEG or Photo-PEG are completely inactive, thus inducing no cell lysis. Error bars represent standard deviations from three independent experiments.
60
0 5 10 15 20 25 30 wt
0.0 0.2 0.4 0.6 0.8 1.0
OD
450
light irradiation / min
Figure 4.7. Micrococcus lysodeikticus exposed to Photo-PEGylated lysozyme followed by an optical density (OD450) measurement after 15 min. The Photo-PEGylated lysozyme is completely inactive before irradiation (0 min); however, complete activity could be restored through UV irradiation (365 nm; 25 W; 5-30 min).
Lastly, the percent activity restoration of irradiated PhotoPEGylated lysozyme was investigated. Lysis assays were performed with decreasing percentages of wild type lysozyme and the Vmax values were compared to the Vmax value of irradiated Photo-PEGylated lysozyme. A450 values were measured every 12 seconds for 20 minutes (Figure 4.8), and the Vmax values calculated from the initial slope of each reaction (first 72 sec; linear regression resulted in R > 0.998) for wild-type lysozyme and PhotoPEGylated lysozyme activated by the optimal UV irradiation (365 nm, 25 W, 30 min). The obtained velocities
61
light-activation of biological processes,[19] and can be easily augmented by increasing the amount of the caged biological molecule and/or extending the time of the process under study. Importantly, the Photo-PEG reagent fulfills the specific criterion of complete inactivity prior to irradiation. Thus, we successfully demonstrated the application of light-removable PEG groups in the photochemical regulation of enzyme activity.
00:00 04:00 08:00 12:00 16:00 20:00
0.0 0.2 0.4 0.6 0.8
1.0 −UV
+UV (5 min) +UV (10 min) +UV (15 min) +UV (20 min) +UV (25 min) +UV (30 min) wild-type
O
D450
time / minutes
Figure 4.8. Lysis assays performed wild-type lysozyme and irradiated Photo-PEGylated enzyme allowed the calculation of Vmax values and subsequent determination of percent activity restoration to the Photo-PEGylated lysozyme. Error bars represent standard deviations from three independent experiments.
4.1.4 Summary and Outlook
62
with UV light of 365 nm removes the otherwise completely stable PEG groups and restores enzymatic activity. Lysine PEGylation with the developed reagent is rapid and facile, and the installation of Photo-PEG groups on the protein can be easily assessed by standard gel electrophoresis, which, if necessary, facilitates purification of the caged protein. This methodology combines the advantages of protein PEGylation (increased protein solubility, intracellular stability, and circulation time) with the advantages of light-activation of protein function (spatial and temporal activity control with high precision). Due to the simplicity of the necessary manipulations, the developed methodology has a wide range of potential applications in the study of protein function in cell culture and whole organisms, as well as activation of protein therapeutics, with the only requirement being the presence of a suitable number of reactive amino groups.
4.1.5 Experimental Methods
63
Lysozyme Assays. The lyophilized lysozyme substrate Micrococcus lysodeikticus (Sigma) was suspended in 66 mM sodium phosphate, pH 6.24, to an optical density at 450 nm of approximately 2.0, providing a 2X cell suspension stock. Wild-type or PEGylated lysozyme (100 µL of 6 µM enzyme solution in PBS) was added to the cell suspension (100 µL) for a final enzyme concentration of 3 µM. Prior to the assay, the Photo-PEG lysozyme was kept in the dark or was selectively irradiated in one well of a 96-well plate on a transilluminator (365 nm, 25 W, 5-30 min) pre-chilled to 0 °C with an ice pack. Wild type lysozyme was also irradiated in the same manner and showed no decrease in activity, indicating that irradiation causes no discernible photodamage to the enzyme. A450 values were measured every 12 seconds for 20 minutes (SpectraMax Plus384 UV plate reader, Molecular Devices), and all assays were performed in triplicate.
64
4.2 Photochemical Control over Cre-mediated DNA Recombination
4.2.1 Introduction to DNA Recombination and Cre Recombinase
65
strands. Resolution of the final nucleoprotein intermediate completes the recombination event and results in two DNA duplexes with exchanged DNA sequences.
Figure 4.9. Site-specific recombination occurs through formation and then resolution of the Holliday junction. In the case of a tyrosine recombinase, four monomers adhere to each strand of DNA at the recognition sites of two DNA duplexes. The catalytic tyrosines of two monomers then cleave the DNA, forming the Holliday junction and two phosphotyrosine intermediates. The two free hydroxyl residues attack the nucleoprotein complex and catalyze strand exchange. The Holliday junction migrates to allow isomerization of the DNA and the process is repeated to create two new DNA duplexes. From Gopaul, D. N.; Guo, F.; and Van Dyne, G. D. EMBO J. 1998, 17, 4175.
66
crossing over for P1) sites, each consisting of two 13 base pair repeats flanking an eight base pair asymmetric core, thus forming the recombinase binding element (RBE). Orientation of the core determines deletion, insertion, or inversion of the intervening DNA (Figure 4.10).[174] To facilitate recombination, a single Cre monomer binds to each RBE, thereby forming a tetramer that joins the loxP sites so that cleavage and strand exchange may occur (Figures 4.9 and 4.10).[175] The catalytic domain of Cre is comprised of Arg173, His289, Arg292, and Tyr324, which form the essential “R-H-R-Y” motif conserved among members of the integrase family.[176]
Figure 4.10. Cre recombinase catalyzes the inversion or excision/integration of DNA between two loxP sites. Orientation of the 34bp loxP sites determines whether the intervening DNA will be inverted or removed/integrated. The loxP site is composed of two 13 bp inverted repeat elements to which the Cre protein binds and a spacer region (green) separating them, where the DNA breakage and reunion occurs.
67
• Efficacy of the Cre/loxP system in creating gene knockouts and transgenes has
been demonstrated in a variety of organisms, from E. coli and yeast,[181] to mouse,{{86 Brault,V. 2007}} zebrafish,[182] and drosophila,[183] as well as tobacco,[184] wheat,[185] and maize.[186]
• Unlike other members of the integrase family that require a non-linear substrate
for catalysis, Cre-mediated recombination occurs regardless of DNA substrate conformation (linear, supercoiled, or circular).
• Cre needs no external energy source and uses only Mg2+ as cofactor.
• Successful recombination using the Cre/loxP system has been shown both in vitro
and in vivo.
While wide-spread use of the Cre/loxP system is due to its simplicity and effectiveness, there are some limitations, particularly in more complex organisms such as the mouse, that remain to be addressed:
• Temporal control over recombination events is difficult to achieve; organisms
harboring a Cre-encoding plasmid or transgenic gene express the enzyme constitutively and thus attempts to modulate activity rely on regulation of the promoter, e.g., through an engineered small molecule or a tissue-specific promoter.
• Spatial control is difficult to obtain; to circumvent this limitation, Cre must be
68
In an effort to address these limitations, Feil et al. fused Cre to a mutated ligand-binding domain of the human estrogen receptor (ER) that binds the small molecule tamoxifen [187]; recombination between two loxP sites occurred only with the addition of tamoxifen.[188] Furthermore, Cre activity was regulated through a split Cre construct,[189] in which the Cre gene was divided between amino acids 59 and 60, and each fragment was fused to the mutated ligand-binding domain of the ER. These two constructs were expressed on separate plasmids and neither individual Cre fragment was able to catalyze recombination. Upon tamoxifen induction, the entire active Cre protein was reconstituted to enable DNA recombination. A similar, rapamycin inducible split-Cre system was generated as well.[190] However, both systems again required small molecule induction.
69
recombination was achieved without the use of tissue-specific promoters and recombination ocurred within four hours of induction (Figure 4.11, B), Cre activity was noted in the absence of heat shock (Figure 4.11, B and C), which the authors attributed to leaky expression of the hsp70 promoter.
A
C B
Figure 4.11. Heat shock induced Cre recombination in Zebrafish affords control over DNA recombination and expression of the kRASG12D oncogene. A. The Cre reporter construct contains a β-actin promoter for expression in muscle cells and a floxed EGFP gene with stop codon upstream of the kRASG12D gene. B.
Within four hours of heat shock, recombination is apparent; however, recombination is also present after 12 hours withour heat shock. C. Over 100 cells/embryo express kRASG12D 12 hours after heat shock; additionally, nearly 20 cells/embryo show kRASG12D expression at 16 hours in the absence of heat shock. Adapted from Le, X., et al. Proc. Natl. Acad. Sci. 2007, 104, 9410.
70
Additionally, recombination activity was low; only 26% of the activity of a β-galactosidase reporter system was reached.
Figure 4.12. Cre activity has been modulated by a mutated estrogen receptor ligand-binding domain fusion (Cre-ERT that binds tamoxifen (ER ligand). Addition of tamoxifen activates Cre, which excises neomycin (Neo) and its stop codon from between two loxP sites. Subsequent expression of the LacZ reporter gene produces β-galactosidase, which cleaves the substrate X-gal and results in blue colored cells. Wild type HEK-293T cells do not exhibit any endogenous β-galactosidase activity in the absence (A) or the presence (B) of tamoxifen. In the presence of photocaged tamoxifen, HEK-293T cells do not express β-galactosidase (C). However, upon irradiation, the cells express β-galactosidase as evidenced by their blue color (D). Adapted from Link, K. H., Shi, Y., and Koh, J. T. J. Am. Chem. Soc. 2005, 127, 13088.
71
As mentioned in Chapter 1, photocaging affords a high level of spatial and temporal control over biological molecules. We therefore utilized a light-responsive caging group through two approaches to: 1) non-specifically cage the lysine residues in Cre in vitro, and 2) directly cage the essential tyrosine in vivo within the catalytic site of the enzyme itself.
4.2.2 Expression and Purification of Wild Type Cre Recombinase
The Cre gene was PCR amplified from P1 Phage genomic DNA.The Cre gene was then inserted into 21a (Novagen) under control of the T7 promoter, generating pET-21Cre, and yielding hexahistidine-tagged wild type Cre recombinase upon expression in E. coli. The hexahistidine tag provides not only an affinity handle for easy purification, but it has also been shown to further enhance the cellular uptake of Cre.[193] The expected vector sequence was confirmed by DNA sequencing. BL21(DE3) E. coli cells were transformed with pET21-Cre; cultures were induced with 1 mM IPTG when an OD600 of 0.6 was reached, then expressed for four hours at 37 °C. The resulting 6xHis-tagged protein was purified by
72
Figure 4.13. Expression of Cre recombinase from pET-21Cre yields pure protein, as determined by SDS-PAGE analysis.
73
Figure 4.14. In vitro assay of Cre recombinase activity. A. Active Cre excises an AmpR plasmid from the substrate; transformation gives rise to many colonies on selective media. B. Caged Cre is inactive and few colonies arise from transformation of the linear substrate until light-irradiation; Cre can then recombine the substrate, as visualized by the resulting number of colonies.
74
because the linear substrate is generated by restriction digest, a small percentage of the substrate remains uncut; therefore, control transformations with pure substrate must be performed to determine background colony numbers. The activity of our expressed Cre was compared to that of commercially available Cre recombinase (Novagen); following the assays described above, and both enzymes produced over 1000 transformants.
4.2.3 In Vitro Non-Specific Caging of Lysine Residues
75
Figure 4.15. The NPOC photocage may attenuate Cre activity until it is removed with 365 nm UV light to yield active enzyme.
Purified Cre was dialyzed into a suitable buffer (25 mM, pH 8.0) to perform the caging reaction, e.g. a buffer lacking primary amino groups that would subsequently cage in lieu of the protein. Several buffers were first tested to ensure solubility and enzymatic activity, including sodium phosphate, borate, carbonate, and PBS. Once wild type Cre activity was verified in each buffer, the caging reaction was performed with the addition of 1000 equivalents of caging group. All caging reactions were performed at 4 °C for 24-48 hours. Dialysis of the caging reaction was performed to remove excess caging groups, but repeated attempts of dialysis on the small scale required for protein caging failed to yield more than trace amounts of protein, as determined by SDS-polyacrylamide gel electrophoresis (PAGE). We then employed buffer exchange via microconcentration, but failed to elute active protein; a native Cre control reaction generated no colonies above background following recombination and NovaBlue transformation.