Extreme Programming Evaluation Framework for Object-Oriented
Languages -- Version 1.1
Laurie Williams
1,
William Krebs
2, Lucas Layman
11
North Carolina State University, Department of Computer Science
{lawilli3, lmlayma2}@ncsu.edu
2
IBM Corporation
[email protected]
Abstract
The Extreme Programming development Methodology (XP) seems appropriate for some teams or projects. Anecdotal stories from developers who have tried XP are often favorable. However, there is little empirical evidence to support or refute claims regarding XP. The Extreme Programming Evaluation Framework (XP-EF) provides a benchmark measurement framework for researchers and practitioners to assess concretely the extent to which an organization has adopted XP practices and the result of this adoption. Through replication of case studies which utilize the structure of the XP-EF, the community can build an experience factory of empirical findings on XP; the results of these case studies can be integrated and combined.
1. Introduction
As a relatively young methodology in the software engineering community, Extreme Programming (XP) [3] and its development practices are becoming increasingly popular, but its value is still confounded by hype and implicit, yet-to-be validated knowledge. Anecdotes of industrial teams experiencing success with partial or full implementations of XP are abundant [12, 13, 17]. However, organizations need a framework that empirically assesses XP’s efficacy.
Much fine work has been done on metrics for software development. The amount of literature on the subject can be overwhelming to a small, informal team. This is a problem because small informal teams are often the target audience for XP practices. Their informal culture makes them a good match for XP, but may mean their team members are less likely to be enthusiastic about formal metrics. Additionally, XP teams are often less likely to have a metrics specialists on their staff.
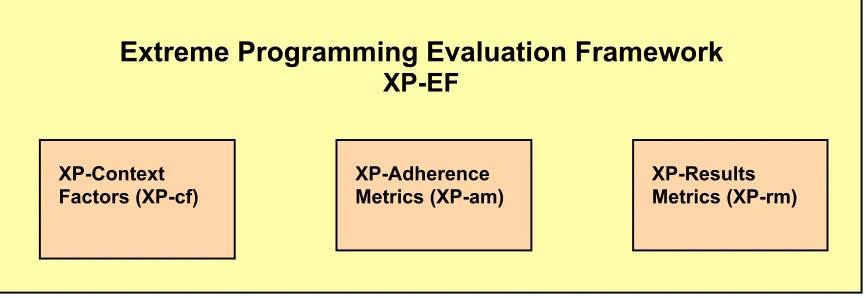
Sims et al. challenged the software engineering community to create benchmarks, or a set of tests used to compare the performance of alternative techniques [15]. In this paper, we provide the details of a benchmark for assessing the extent to which an organization has adopted XP practices and the result of this adoption. The benchmark, called the XP Evaluation Framework (XP-EF), has three parts: XP Context Factors (XP-cf), XP Adherence Metrics (XP-am) and XP Result Metrics (XP-rm), as shown in Figure 1. The framework was designed for use throughout development by agile teams. The metrics are focused, concise and can be collected by a small team without a dedicated metrics specialist. A case study of an IBM XP team that used Java was completed using the XP-EF at the version defined in this paper (Version 1.1 for object-oriented languages) [19]. However, as additional case studies are completed, it is expected that the specific set of metrics which comprise the XP-EF for OO will evolve over time. Through replication of case studies which utilize the structure of the XP-EF, the community can build an experience factory of empirical findings on XP; the results of these case studies can be integrated and combined.
The metric suite was developed using the Goal-Question-Metrics (GQM) technique [1], as will be discussed as the metrics are presented. Additionally, we had some overriding goals for the metrics suite: We desired for the metrics to be:
• Parsimonious and simple enough for a small team to measure without a metrics specialist and with minimal burden
• Concrete and unambiguous
• Comprehensive and complete enough to cover vital factors
Figure 1: Extreme Programming Evaluation Framework
XP-EF is a compilation of validated and proposed metrics. The validation of metric relevance requires convincing demonstration that (1) the metric measures what it purports to measure and (2) the metric is associated with an important external metric, such as field reliability, maintainability, or fault-proneness [9]. The XP-rm utilizes the CK suite of object-oriented metrics as defined by Chidamber and Kemerer [7]. These metrics have been repeatedly correlated with fault proneness in industrial projects. The consistency of these findings varies depending on the programming language under study [16] and is still open to criticism [8]. Several of the XP-am metrics require validation via repeated use of the XP-EF. In empirical studies, comparisons are informative. For example, a new project’s measures can be compared against a prior project’s measures within the same organization. Alternatively, comparisons can be made to industry standards and/or benchmarks. Jones has compiled data from many software organizations and provides benchmarks, best practices, and statistics for a range of software development topics [10].
Section 2 of this report explains the motivation and details behind the XP-Context Factors (XP-cf). Section 3 and 4 do the same for the XP-Adherence Metrics (XP-am) and XP-Results Metrics (XP-rm), respectively. A subject XP-Adherence survey is found in the appendix. Those who desire to see a completed XP-EF for OO are directed to the IBM case study [19].
2. The XP-Context Factors
Drawing general conclusions from empirical studies in software engineering is difficult because the results of any process largely depends upon the specifics of the study or relevant context factors. We cannot assume a priori that a study’s results generalize beyond the specific environment in which it was conducted [2]. Therefore, recording an experiment’s context factors is essential for comparison purposes and for fully understanding the similarities and differences between the case study and one’s own environment.
Under the guidelines of the GQM, we consider our goal for the defining the context factors:
GOAL: To be able to understand in what ways a particular case study is similar or different from another case study or to understand in what ways a particular case study is similar or different from a new project that is considering a transition to XP.
QUESTION: In what ways can software projects differ?
Jones [10] states that software projects can be influenced by as many as 250 different factors, but that most projects are affected by 10-20 major issues. He organizes key factors to be accounted for in every assessment into six categories: software classification, sociological, project-specific, ergonomic, technological, and international. The XP-EF framework templates are correspondingly organized into these five categories, though we modify the last factor (international) to geographical. We also include
Extreme Programming Evaluation Framework
XP-EF
XP-Context
developmental factors that use a risk-driven approach for determining whether a project would be most successful using an agile or plan-driven approach.
2.1 Software classification
Purpose: Different types of software are often associated with different risk factors as well as differing characteristics. For instance, military systems, in general, may be developed in a more formally controlled manner with strong requirements for reliability and security. On the other hand, developing MIS software may be subject to a less formal process with focus on usability and understandability, but not necessarily meet such high reliability and security standards. Consequently, it is important to record the type of software under development in order to provide general context for the project under study. We provide six classifications to choose from, as described in Table 1.
Table 1: Software classification
Systems software Software that is used to control physical devices, such as a computer or telephone switch. Embedded systems fall into this category.
Commercial
software Software that is leased or marketed to external clients. These software applications areproduced for large-scale marketing to hundreds or possibly millions of clients. This includes software such as word processors, spreadsheets, and project management systems.
Information
systems MIS systems are produced in-house to support a company’s business andadministrative functions, such as payroll and e-business. Outsourced
software Outsourced software is software built under contract to a client organization. Themajority of software projects may be classified as outsourced. The customer may be external or internal to the company.
Military software Software produced for a military organization, or that adheres to Department of Defense standards.
End user
software End user software refers to small applications that are written for personal use bypeople who are computer literate.
2.2 Sociological factors
Purpose: Sociological factors are designed to record personnel characteristics the project. Personnel is the single greatest risk factor in software development. Consequently, factors such as team size, experience, and turnover can substantially affect the outcome of a project. The instructions for recording these sociological factors can be found in Table 2.
Table 2: Sociological Factors Context Factor Explanation on how to measure
Team Size
(Develop) The complexity of team management grows as team size increases. It has beensuggested that XP is not appropriate for large teams [14]. Communication between team members and the integration of concurrently developed software becomes more difficult for large teams [6].
Count Do count full time developers and full time testers dedicated to the XP project under study.
Exclude Do not count specialists who aid the team part time (such as performance, user interface design, management, project management, or localization specialists, technical writers).
Example 7 team members Team Education
Level Education level may be considered another measure of experience or domainexpertise.
Context Factor Explanation on how to measure
Bachelors, Masters, Ph.D.)
Exclude Do not count degrees which have been partially completed. Example All: Bachelors
Two: Masters (of 7) Experience Level
of Team Developer experience is a critical factor influence code development. The moreexperienced the programmer, the more likely he or she is to be able to identify recurring problems during development and draw upon their personal knowledge base to resolve the issue in an expedient manner. The presence of experienced programmers on a development team can also help less experienced developers gain practical knowledge about the problem domain or the software process in general.
Count The number of years spent developing software.
Exclude Do not count years spent developing software for personal use or in an academic setting.
Example 20+ years: 1; 10 years: 3; less than 5 years: 1; Interns: 1
Domain Expertise A team familiar with the domain of their project may not be subject to the learning curve associated with development that must address an unfamiliar problem. For instance, a team developing web applications may have difficulty adjusting to developing embedded systems, but can produce software efficiently in their own domain.
Record Estimate or ask about the team’s experience with technical factors of the project other than the programming language and including the industry. Examples would be familiarity with database systems, communications, web programming, banking, retail system, agents.
Use a scale of Low, Moderate, High to denote the average of the team. Exclude Programming Language expertise (covered below)
Example High Language
Expertise Similar to domain expertise, using an unfamiliar programming language may incursignificant learning costs. While it may be possible to switch between languages of a similar type, such as object-oriented languages, with a relatively small learning curve, adjusting from the object-oriented paradigm to functional languages may prove more difficult and thus slow development.
Record Estimate or ask about the team’s proficiency with the programming languages used on the project.
The scale is Low, Moderate, High to denote the average of the team. Example High
Experience Proj
Mgr The familiarity of the project manager with the managerial role can influence theproductivity of a team by drawing upon scheduling and cost estimation experience. Also, a project manager familiar with the development team may be able to draw upon personal knowledge of the individuals on the team to optimize development by assigning tasks to team members appropriate to their strengths and weaknesses.
Record Estimate the level of experience of the project manager in that role. Do not consider years of experience in general development unless he/she also served as project manager during that time.
The scale is Low, Moderate, High. Example High
Specialist Available Specialists can help speed up the development process by focusing on specific tasks that may be unfamiliar to other developers, such as GUI design. Other specialists, such as Code or Design Reviewers, can help catch flaws during development and improve deliverable quality.
Count Include any person not on the core team that helps with the project. Examples would include performance, localization, install, build, team Exclude Do not count anyone who has already been counted as a full time
Context Factor Explanation on how to measure
Exclude Do not count anyone who has already been counted as a full time developer or tester on the team.
Example GUI Designer Personnel
Turnover The objective of listing this metric is to see how XP handles people joining or leavingthe team because most of the project knowledge remains tacit rather than documented (externalized). A common informal metric (invented by Jim Coplien of AT&T Bell Labs) is referred to as the truck number. ["How many or few people would have to be hit by a truck (or quit) before the project is incapacitated?" The worst answer is one.] Having knowledge dispersed across the team increases the truck number and project safety.
XP may make it harder for people come and go because there is less formal documentation. However, difficulties in transition may be lessened because knowledge is transferred through the team via pair programming. Turnover for a given period of time is measured by counting how many people joined or left the team compared with the team size. This assumes an interval of time under study, such as one release. Interns and part time personnel are counted because they may have specific knowledge that is missed when they leave. Also, they may require training when joining the team, even though they may only be part time personnel.
Count When counting the number of people on the team, consider only those individuals considered full time members of the team.
Ending_Total: Count the number of people on the team at the end of the release.
Added: Count the number of people added at the beginning or during the release.
Left: Count the number of people who left at the beginning or during the release.
Turnover = (Added + Left) / Ending Total
Example At the end of the release under study, the team has 11 people. At the beginning of the release, two people move to another project. In the middle of the release, one more person leaves and one other joins the team. At the end of the measurement interval, the team has nine people. Turnover is measured as (1+3) / 11 = 36
Morale Factors The success or failure of a project is dependent largely on the performance of the development team. When a team suffers from low morale, a productivity slip may results. Similarly, a morale boost may result in a more productive team.
Record Record any factors “outside” of software development that may have affected the team’s performance during development, such as abnormal stress levels, cutbacks, holidays, or personnel transfers.
Example Manager change
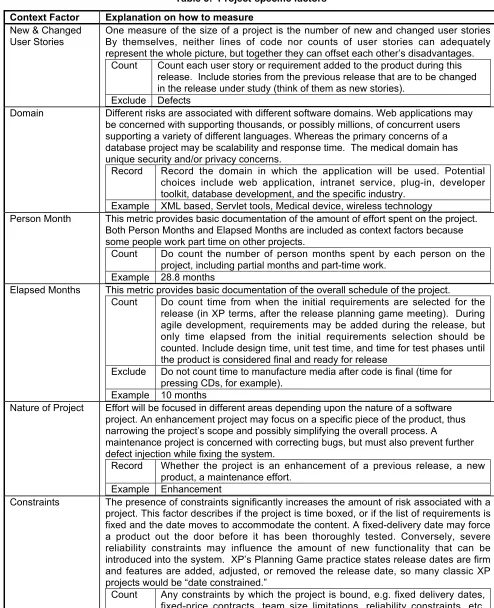
2.3 Project-specific factors
Table 3: Project-specific factors Context Factor Explanation on how to measure
New & Changed
User Stories One measure of the size of a project is the number of new and changed user storiesBy themselves, neither lines of code nor counts of user stories can adequately represent the whole picture, but together they can offset each other’s disadvantages.
Count Count each user story or requirement added to the product during this release. Include stories from the previous release that are to be changed in the release under study (think of them as new stories).
Exclude Defects
Domain Different risks are associated with different software domains. Web applications may be concerned with supporting thousands, or possibly millions, of concurrent users supporting a variety of different languages. Whereas the primary concerns of a database project may be scalability and response time. The medical domain has unique security and/or privacy concerns.
Record Record the domain in which the application will be used. Potential choices include web application, intranet service, plug-in, developer toolkit, database development, and the specific industry.
Example XML based, Servlet tools, Medical device, wireless technology
Person Month Thismetric provides basic documentation of the amount of effort spent on the project. Both Person Months and Elapsed Months are included as context factors because some people work part time on other projects.
Count Do count the number of person months spent by each person on the project, including partial months and part-time work.
Example 28.8 months
Elapsed Months This metric provides basic documentation of the overall schedule of the project.
Count Do count time from when the initial requirements are selected for the release (in XP terms, after the release planning game meeting). During agile development, requirements may be added during the release, but only time elapsed from the initial requirements selection should be counted. Include design time, unit test time, and time for test phases until the product is considered final and ready for release
Exclude Do not count time to manufacture media after code is final (time for pressing CDs, for example).
Example 10 months
Nature of Project Effort will be focused in different areas depending upon the nature of a software project. An enhancement project may focus on a specific piece of the product, thus narrowing the project’s scope and possibly simplifying the overall process. A
maintenance project is concerned with correcting bugs, but must also prevent further defect injection while fixing the system.
Record Whether the project is an enhancement of a previous release, a new product, a maintenance effort.
Example Enhancement
Constraints The presence of constraints significantly increases the amount of risk associated with a project. This factor describes if the project is time boxed, or if the list of requirements is fixed and the date moves to accommodate the content. A fixed-delivery date may force a product out the door before it has been thoroughly tested. Conversely, severe reliability constraints may influence the amount of new functionality that can be introduced into the system. XP’s Planning Game practice states release dates are firm and features are added, adjusted, or removed the release date, so many classic XP projects would be “date constrained.”
Examples would be Date Constrained, Scope Constrained, Resource Constrained and any combinations and degrees of these.
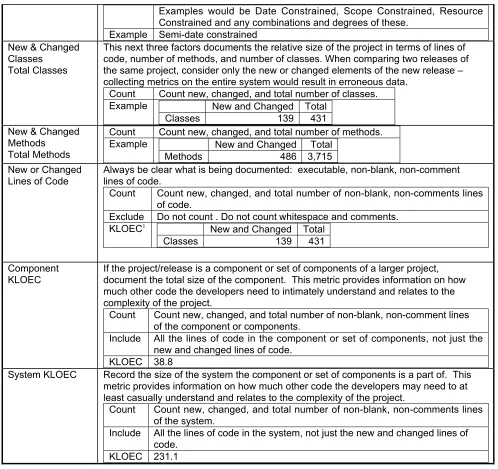
Example Semi-date constrained New & Changed
Classes Total Classes
This next three factors documents the relative size of the project in terms of lines of code, number of methods, and number of classes. When comparing two releases of the same project, consider only the new or changed elements of the new release – collecting metrics on the entire system would result in erroneous data.
Count Count new, changed, and total number of classes.
Example New and Changed Total
Classes 139 431
New & Changed Methods
Total Methods
Count Count new, changed, and total number of methods.
Example New and Changed Total
Methods 486 3,715
New or Changed
Lines of Code Always be clear what is being documented: executable, non-blank, non-commentlines of code. Count Count new, changed, and total number of non-blank, non-comments lines
of code.
Exclude Do not count . Do not count whitespace and comments.
KLOEC1 New and Changed Total
Classes 139 431
Component
KLOEC If the project/release is a component or set of components of a larger project,document the total size of the component. This metric provides information on how much other code the developers need to intimately understand and relates to the complexity of the project.
Count Count new, changed, and total number of non-blank, non-comment lines of the component or components.
Include All the lines of code in the component or set of components, not just the new and changed lines of code.
KLOEC 38.8
System KLOEC Record the size of the system the component or set of components is a part of. This metric provides information on how much other code the developers may need to at least casually understand and relates to the complexity of the project.
Count Count new, changed, and total number of non-blank, non-comments lines of the system.
Include All the lines of code in the system, not just the new and changed lines of code.
KLOEC 231.1
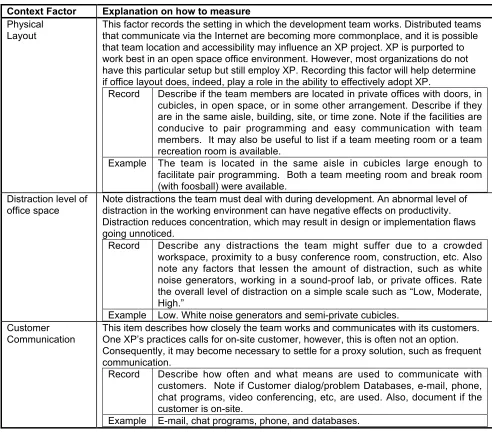
2.4 Ergonomic factors
Purpose: Office environment plays an important role in communication among developers and customers and may affect collaborative such as pair programming. Customer availability is also an important part of XP that must be recorded. The instructions for recording these ergonomic factors can be found in Table 4.
Table 4: Ergonomic Factors
Context Factor Explanation on how to measure Physical
Layout This factor records the setting in which the development team works. Distributed teamsthat communicate via the Internet are becoming more commonplace, and it is possible that team location and accessibility may influence an XP project. XP is purported to work best in an open space office environment. However, most organizations do not have this particular setup but still employ XP. Recording this factor will help determine if office layout does, indeed, play a role in the ability to effectively adopt XP.
Record Describe if the team members are located in private offices with doors, in cubicles, in open space, or in some other arrangement. Describe if they are in the same aisle, building, site, or time zone. Note if the facilities are conducive to pair programming and easy communication with team members. It may also be useful to list if a team meeting room or a team recreation room is available.
Example The team is located in the same aisle in cubicles large enough to facilitate pair programming. Both a team meeting room and break room (with foosball) were available.
Distraction level of
office space Note distractions the team must deal with during development. An abnormal level ofdistraction in the working environment can have negative effects on productivity. Distraction reduces concentration, which may result in design or implementation flaws going unnoticed.
Record Describe any distractions the team might suffer due to a crowded workspace, proximity to a busy conference room, construction, etc. Also note any factors that lessen the amount of distraction, such as white noise generators, working in a sound-proof lab, or private offices. Rate the overall level of distraction on a simple scale such as “Low, Moderate, High.”
Example Low. White noise generators and semi-private cubicles. Customer
Communication This item describes how closely the team works and communicates with its customers.One XP’s practices calls for on-site customer, however, this is often not an option. Consequently, it may become necessary to settle for a proxy solution, such as frequent communication.
Record Describe how often and what means are used to communicate with customers. Note if Customer dialog/problem Databases, e-mail, phone, chat programs, video conferencing, etc, are used. Also, document if the customer is on-site.
Example E-mail, chat programs, phone, and databases.
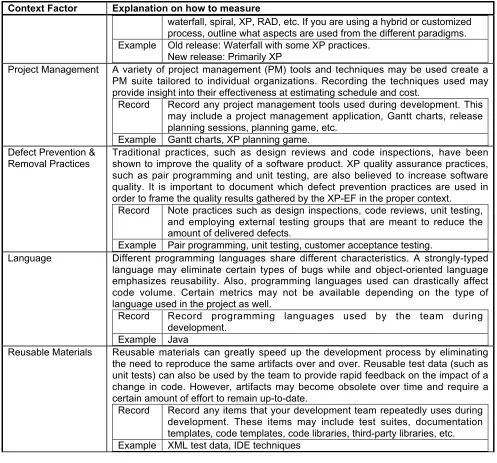
2.5 Technological factors
Purpose: Different teams use different methodologies and tools when working on their software project. Factors such as rigorous project management and a large repository of reusable materials may have significant influence on a project that is not present on a project with little formal project management where code is built from scratch. The instructions for recording these technological factors can be found in Table 5.
Table 5: Technological factors Context Factor Explanation on how to measure
Software Development Methodology
While this is an XP framework, case studies can compare with pre-XP project and/or release. As a result, it is important to record the development methodology of the baseline project. Also, recording this factor may provide insight as to whether hybrid methodologies (using both plan-driven and agile practices) are viable options in software development.
Context Factor Explanation on how to measure
waterfall, spiral, XP, RAD, etc. If you are using a hybrid or customized process, outline what aspects are used from the different paradigms. Example Old release: Waterfall with some XP practices.
New release: Primarily XP
Project Management A variety of project management (PM) tools and techniques may be used create a PM suite tailored to individual organizations. Recording the techniques used may provide insight into their effectiveness at estimating schedule and cost.
Record Record any project management tools used during development. This
may include a project management application, Gantt charts, release planning sessions, planning game, etc.
Example Gantt charts, XP planning game. Defect Prevention &
Removal Practices Traditional practices, such as design reviews and code inspections, have beenshown to improve the quality of a software product. XP quality assurance practices, such as pair programming and unit testing, are also believed to increase software quality. It is important to document which defect prevention practices are used in order to frame the quality results gathered by the XP-EF in the proper context.
Record Note practices such as design inspections, code reviews, unit testing,
and employing external testing groups that are meant to reduce the amount of delivered defects.
Example Pair programming, unit testing, customer acceptance testing.
Language Different programming languages share different characteristics. A strongly-typed
language may eliminate certain types of bugs while and object-oriented language emphasizes reusability. Also, programming languages used can drastically affect code volume. Certain metrics may not be available depending on the type of language used in the project as well.
Record Record programming languages used by the team during
development. Example Java
Reusable Materials Reusable materials can greatly speed up the development process by eliminating
the need to reproduce the same artifacts over and over. Reusable test data (such as unit tests) can also be used by the team to provide rapid feedback on the impact of a change in code. However, artifacts may become obsolete over time and require a certain amount of effort to remain up-to-date.
Record Record any items that your development team repeatedly uses during
development. These items may include test suites, documentation templates, code templates, code libraries, third-party libraries, etc. Example XML test data, IDE techniques
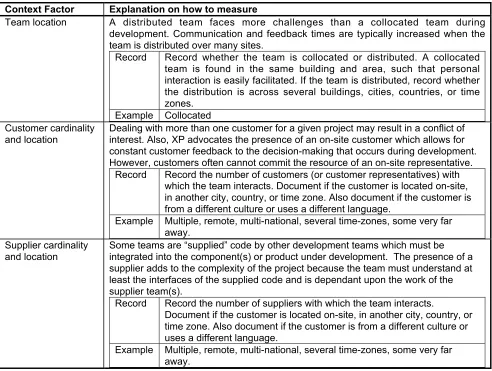
2.6 Geographic factors
Purpose: To record the location of the development team, the customer, and the supplier. Distributed development has become more commonplace in industry and may influence practices such as pair programming, continuous integration, and collective ownership. Also, the presence of an on-site customer can drastically reduce feedback time, and may improve schedule adherence, velocity, and customer satisfaction in the final product. The instructions for recording these geographic factors can be found in Table 6.
Context Factor Explanation on how to measure
Team location A distributed team faces more challenges than a collocated team during development. Communication and feedback times are typically increased when the team is distributed over many sites.
Record Record whether the team is collocated or distributed. A collocated team is found in the same building and area, such that personal interaction is easily facilitated. If the team is distributed, record whether the distribution is across several buildings, cities, countries, or time zones.
Example Collocated Customer cardinality
and location Dealing with more than one customer for a given project may result in a conflict ofinterest. Also, XP advocates the presence of an on-site customer which allows for constant customer feedback to the decision-making that occurs during development. However, customers often cannot commit the resource of an on-site representative.
Record Record the number of customers (or customer representatives) with which the team interacts. Document if the customer is located on-site, in another city, country, or time zone. Also document if the customer is from a different culture or uses a different language.
Example Multiple, remote, multi-national, several time-zones, some very far away.
Supplier cardinality
and location Some teams are “supplied” code by other development teams which must beintegrated into the component(s) or product under development. The presence of a supplier adds to the complexity of the project because the team must understand at least the interfaces of the supplied code and is dependant upon the work of the supplier team(s).
Record Record the number of suppliers with which the team interacts.
Document if the customer is located on-site, in another city, country, or time zone. Also document if the customer is from a different culture or uses a different language.
Example Multiple, remote, multi-national, several time-zones, some very far away.
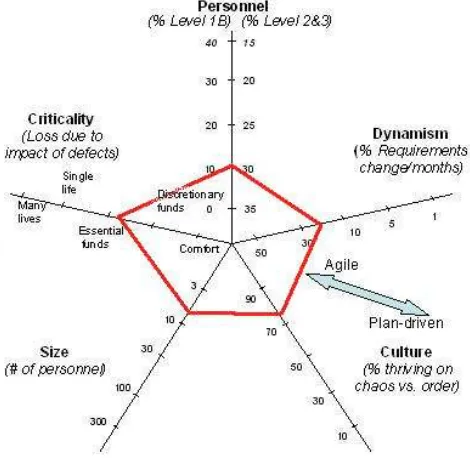
2.7 Developmental factors
Purpose: Boehm and Turner acknowledge that agile and plan-driven methodologies each have a role in software development and suggest a risk-based method for selecting an appropriate methodology [4, 5]. Their five project factors (team size, criticality, personnel understanding, dynamism, and culture) aid in selecting an agile, plan-driven, or hybrid process, as explained in Table 7. These factors are graphed on a polar chart’s five axes as shown in Figure 2. The agile risk factors appear toward the graph’s center and the plan-driven risk factors appear toward the periphery. When a project’s data points for each factor are joined, shapes distinctly toward the graph’s center suggest using an agile method. Shapes distinctly toward the periphery suggest using a plan-driven methodology. More varied shapes suggest a hybrid method of both agile and plan-driven practices. As an industry, it would be beneficial to run as many case studies with varying polar chart shapes to validate the risk-based approach of Boehm and Turner [4, 5].
Table 7: Developmental factors Context Factor Explanation on how to measure
Context Factor Explanation on how to measure
subjective measure will be required.
Criticality Criticality is the impact due to software failure. What is the worst thing that can happen if the software fails? Is it possible that many people will lose their lives, that the company will lose critical funds, or that it will simply be a loss of comfort? A failure in an air traffic control system could be catastrophic, whereas a failure occurring in an information kiosk may simply be an inconvenience. The company may also lose very important monies, or a small amount.
Personnel Record the percentage of people at these various levels
Level Characteristics
3 Able to revise a method, breaking its rules to fit an unprecedented new situation.
2 Able to tailor a method to fit a precedented new situation.
1A With training able to perform discretionary method steps such as sizing stories to fit increments, composing patterns, compound refactoring, or complex COTS integration. With experience, can become Level 2. 1B With training, able to perform procedural method steps such as coding a
simple method, simple refactoring, following coding standards and CM procedures, or running tests. With experience, can master some Level 1A skills.
-1 May have technical skills but unable or unwilling to collaborate or follow shared methods.
Size The number of full-time people on the team, as recorded in the sociological factors (Table 2).
Culture Culture measures the percentage of the team that prefers chaos versus the
percentage that prefers order. Does most of the team thrive in a culture where people feel comfortable and empowered by having their roles defined by clear policies and procedures? If so, they tend toward order. If your team is more comfortable by having many degrees of freedom, then they tend toward chaos.
3. The XP-Adherence Metrics
The second part of the XP-EF is the XP Adherence Metrics (XP-am). Many software development teams do not exercise all the XP practices to their full extent; some employ only a few practices. Moreover, those that do adopt all 12 practices may not strictly apply the practices at all times for a variety of reasons. For example, some team members may be resistant to a particular practice. Yet, XP originator Kent Beck purports that the set of 12 practices support each other, suggesting that all 12 must be applied [3]. The XP-am enables one to express concretely and comparatively the extent to which a teXP-am follows XP. XP-XP-am also allows researchers to investigate the interactions and dependencies between the XP practices and the extent to which the practices can be separated or eliminated. Because many of the XP-am metrics have not been previously established, they must be validated via case studies.
Teams often do not uniformly adopt all XP practices for various reasons. Determining and recording the subset of practices employed by a team is essential for several reasons. First, organizations may be interested the adherence of certain practices. For example some practices, such as pair programming and test-driven development, have been shown to improve quality [18, 20] and may be deemed high-priority practices. Adherence metrics also enable case study comparison, the study of XP practice interaction, and the determination of contextually-based, safe XP practice subsets. The XP-am does not advocate high adherence as a universal benefit for all projects.
Under the guidelines of the GQM, we consider our goal for the defining the adherence metrics:
GOAL: To be able to understand how closely a team actually used the XP practices QUESTIONS: How much do the team members follow each of the XP practices?
The XP-am contains subjective and objective measures as well as qualitative analysis about the team’s use of XP practices to triangulate the extent to which a team uses each of the XP practices.
3.1 Subjective Measures
The Shodan Adherence Survey, shown in detail in the Appendix, is an in-process, subjective means of gathering XP adherence information from team members. The survey, answered anonymously via a web-based application, contains 15 questions gauging the extent to which each individual uses XP practices. A survey respondent reports the extent to which he/she uses each practice on a scale from 0% (never) to 100% (always). The results of the survey can be used by team leaders to see how much a practice is used, the variation of use between team members and trends of use over time. In the IBM case study, the survey was administered to the team every two months. Tracking Shodan survey results for a team is useful. However, since the Shodan survey is subjective, it is not advisable to compare survey results across teams.
In addition to the benefit of serving as a cross check to precise but possibly inaccurate numbers, the survey has these benefits.
1. Early indication of failing to follow a critical XP practice allows course correction before the release is over
2. It reminds people on the team of each practice
3. It is easier to ask people if they think they have “coding standards” than to compute an objective score for this. Another example is “sustainable pace.” Some people like to work 50 hours per week all the time. Simply measuring hours per week would not account for their preference to work longer hours. To them, 50 hours is sustainable.
4. Seeing the variability and range of responses between team members provides valuable information on the range of acceptance and utilization of the practices.
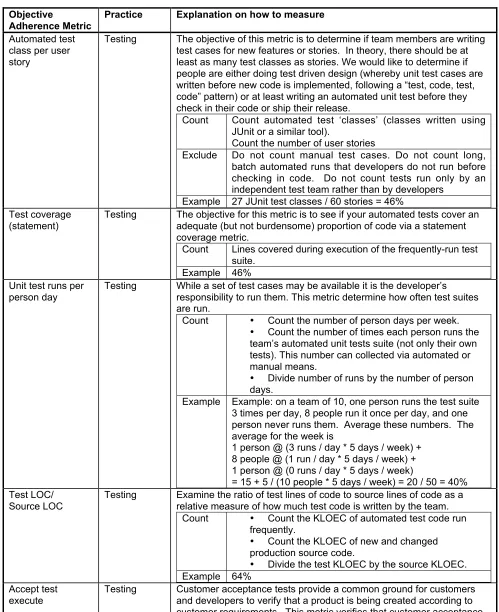
3.2 Objective Measures
Table 8: Objective adherence metrics
Objective
Adherence Metric Practice Explanation on how to measure Automated test
class per user story
Testing The objective of this metric is to determine if team members are writing test cases for new features or stories. In theory, there should be at least as many test classes as stories. We would like to determine if people are either doing test driven design (whereby unit test cases are written before new code is implemented, following a “test, code, test, code” pattern) or at least writing an automated unit test before they check in their code or ship their release.
Count Count automated test ‘classes’ (classes written using JUnit or a similar tool).
Count the number of user stories
Exclude Do not count manual test cases. Do not count long, batch automated runs that developers do not run before checking in code. Do not count tests run only by an independent test team rather than by developers
Example 27 JUnit test classes / 60 stories = 46% Test coverage
(statement) Testing The objective for this metric is to see if your automated tests cover anadequate (but not burdensome) proportion of code via a statement coverage metric.
Count Lines covered during execution of the frequently-run test suite.
Example 46% Unit test runs per
person day Testing While a set of test cases may be available it is the developer’sresponsibility to run them. This metric determine how often test suites are run.
Count • Count the number of person days per week. • Count the number of times each person runs the team’s automated unit tests suite (not only their own tests). This number can collected via automated or manual means.
• Divide number of runs by the number of person days.
Example Example: on a team of 10, one person runs the test suite 3 times per day, 8 people run it once per day, and one person never runs them. Average these numbers. The average for the week is
1 person @ (3 runs / day * 5 days / week) + 8 people @ (1 run / day * 5 days / week) + 1 person @ (0 runs / day * 5 days / week)
= 15 + 5 / (10 people * 5 days / week) = 20 / 50 = 40% Test LOC/
Source LOC Testing Examine the ratio of test lines of code to source lines of code as arelative measure of how much test code is written by the team. Count • Count the KLOEC of automated test code run
frequently.
• Count the KLOEC of new and changed production source code.
• Divide the test KLOEC by the source KLOEC. Example 64%
Accept test
Objective
Adherence Metric Practice Explanation on how to measure
tests exist and that they are an important part of the development process.
Record • Do you have customer acceptance tests written by or writing in conjunction with your customer?
• Are the customer acceptance tests automated? • How often are the tests run?
Exclude Any tests written by the developer without customer input.
Example Customer Acceptance Tests exist for 66% of our customers, are not automated, and are run twice per week.
Customers-run
acceptance tests? Testing It is best when a customer(s) partake in writing and executingacceptance test cases. This measure is a binary indication (Yes/No) of whether or not the customer(s) run the automated acceptance tests. Pairing Frequency Pair Prog Use your own method to detect how often code or changes were done
with pair programming instead of solo. In the IBM case study, a character was added to the change comment in the header of each changed file. This allowed us to search for the character in all files and compare the number of changes done using pair programming to the total number of changes. We used a '+' character between the author's names to denote pairing on an item. This technique gives greater weight to changes that affect many files, but this seems appropriate.
Count Count the proportion of changes made by pair programmers. One way to do this is: Mark each change with a one line comment in each file touched. Use a special character to represent if the change was made while pair programming, e.g. a ‘+’ between the author’s initials. Search for the number of change comments in the comment banner. Search for the number of lines with special comments denoting pair programming in the comment banner. Divide the number of pair programming changed by the total number of changes.
Example File 1 header
// Date Authors Description
// 9/15/2003 Bill Fix null pointer exception // 10/11/2003 Bill+Lucas Add support for new widgets
File 2 header
// 10/11/2003 Bill+Lucas Add support for new widgets
Pairing frequency = 2 paired of 3 total changes = 66% We use //.*03.*\+ as a regular expression to find pairings, and //.*03 to find total changes.
Release Length Measure the release length in order to gauge the extent to which the project adheres to the ‘short release’ XP practice. While there is no defined length for what qualifies a short release, XP advocates a maximum of 3 month release period.
Objective
Adherence Metric Practice Explanation on how to measure
of planning game to the release point. Count Design, Test, and Code phases. Count time for Release planning.
Exclude Do not count business and staffing process time before the requirements are chosen.
Do not count maintenance time after the release is shipped
Example 10 months Iteration Length Short
Release Assess if the team is using short iterations. XP employs short iterationsto receive continuous feedback on product development from all stakeholders. XP advocates an iteration length of at most three weeks.
Count Count the number of weeks between iterations where code is made available to customers.
Exclude Nightly builds that customers may be able to get but are not advertised as being tested.
Example One week per iteration
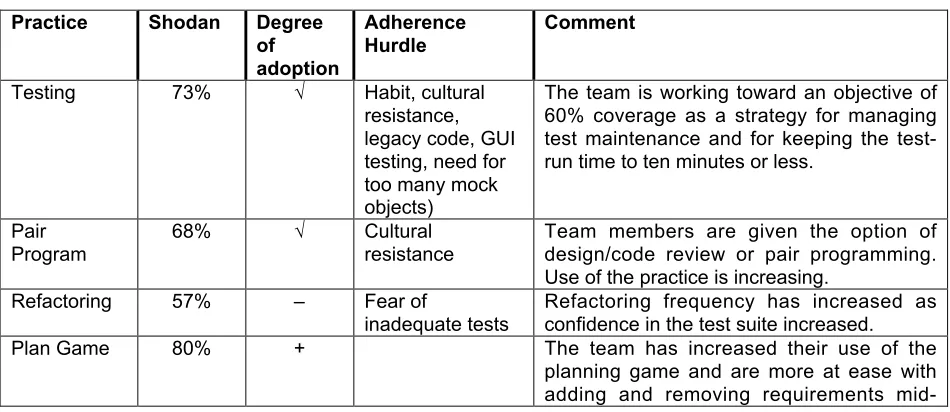
3.3 Triangulated XP Adherence Analysis
The XP-am objective and subjective metrics and qualitative knowledge can be used to triangulate the actual usage of the XP practices. Table 9 provides an example template for summarizing the Shodan survey results. The columns of the table correspond to:
1. The XP practice in question.
2. The team’s Shodan survey result. See Appendix A.
3. The degree of adoption of each practice. We evaluate the team on a scale of √ (full adoption), + (partial adoption), and – (not adopted or slightly adopted).
4. Adherence hurdles – reasons the team did not fully adopt a particular practice.
5. Comment – Record factors that may have influenced or may explain the Shodan result for that practice.
Table 9: Triangulated adherence analysis
(degree of adoption of + indicates full adoption, √ indicates partial adoption, - indicates little or no adoption) Practice Shodan Degree
of adoption
Adherence
Hurdle Comment
Testing 73% √ Habit, cultural
resistance, legacy code, GUI testing, need for too many mock objects)
The team is working toward an objective of 60% coverage as a strategy for managing test maintenance and for keeping the test-run time to ten minutes or less.
Pair
Program 68%
√ Cultural
resistance Team members are given the option ofdesign/code review or pair programming. Use of the practice is increasing.
Refactoring 57% – Fear of
mid-Practice Shodan Degree of adoption
Adherence
Hurdle Comment
release.
On-Site Cust 87% + Though the customer is remote, the team is comfortable with their remote communication, feedback, and responsiveness via e-mail, chat programs, phone, and databases.
Short
Release 77% + Weekly iterations sent to customer,shortened release time. Stand Up
Meeting 90% √ Cultural/corporate resistance, meeting culture
Longer than most stand-up meetings (30 minutes), hold three times per week with longer formal weekly meeting. Held after lunch to accommodate flex-time.
Contin Integr 78% √ Technical, cultural
Coding Std 82% √ Habit, poor
enforcement Compliance not universal.
Collect Own 83% + The team feels they more easily handles team members leaving because of collective code ownership and pair programming
Sustain
Pace 77% +
Simp Design 78% √ Corporate
resistance, Criticality of project
Customer would still like a design. The team has evolved to a timeboxed (20 percent of time) “slim design up front” (SDUF) consisting of user story, optional UML, a test case, and a standards checklist for localization, performance, logging, etc. Customer indicating confidence in SDUF. The team is looking toward even more slim design templates.
Metaphor 23% – Lack of
understanding Difficulty in understanding metaphor
4. The XP-Results Metrics
Part three of the XP-EF is the XP Result Metrics (XP-rm), which enables one to assess and report how successful or unsuccessful a team is when using a full or partial set of XP practices. XP-rm consists of traditional external software development metrics, such as productivity and quality. Ideally, a team performing a case study will have a baseline product to be used for comparison.
Under the guidelines of the GQM, we consider our goal for the defining the results metrics:
GOAL: To be able to determine if a team was successful with the use of a subset or all of the XP practices. QUESTIONS: How productive was the team? Did the team produce a high quality product? How was the team’s morale? Was the customer happy with the product?
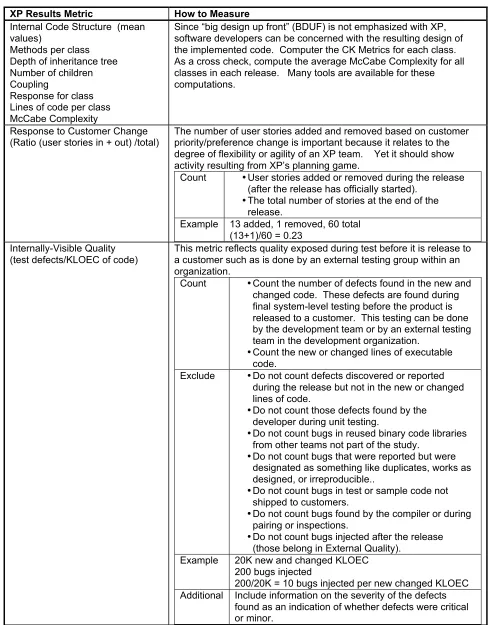
Table 10: Results Metrics
XP Results Metric How to Measure Internal Code Structure (mean
values)
Methods per class Depth of inheritance tree Number of children Coupling
Response for class Lines of code per class McCabe Complexity
Since “big design up front” (BDUF) is not emphasized with XP, software developers can be concerned with the resulting design of the implemented code. Computer the CK Metrics for each class. As a cross check, compute the average McCabe Complexity for all classes in each release. Many tools are available for these computations.
Response to Customer Change
(Ratio (user stories in + out) /total) The number of user stories added and removed based on customerpriority/preference change is important because it relates to the degree of flexibility or agility of an XP team. Yet it should show activity resulting from XP’s planning game.
Count • User stories added or removed during the release (after the release has officially started).
• The total number of stories at the end of the release.
Example 13 added, 1 removed, 60 total (13+1)/60 = 0.23
Internally-Visible Quality
(test defects/KLOEC of code) This metric reflects quality exposed during test before it is release toa customer such as is done by an external testing group within an organization.
Count • Count the number of defects found in the new and changed code. These defects are found during final system-level testing before the product is released to a customer. This testing can be done by the development team or by an external testing team in the development organization.
• Count the new or changed lines of executable code.
Exclude • Do not count defects discovered or reported during the release but not in the new or changed lines of code.
• Do not count those defects found by the developer during unit testing.
• Do not count bugs in reused binary code libraries from other teams not part of the study.
• Do not count bugs that were reported but were designated as something like duplicates, works as designed, or irreproducible..
• Do not count bugs in test or sample code not shipped to customers.
• Do not count bugs found by the compiler or during pairing or inspections.
• Do not count bugs injected after the release (those belong in External Quality).
Example 20K new and changed KLOEC 200 bugs injected
200/20K = 10 bugs injected per new changed KLOEC Additional Include information on the severity of the defects
XP Results Metric How to Measure Externally-Visible Quality
(released defects/KLOEC of code) This metric reflects quality exposed as seen by the customer.Count • Count the number of defects found in the new and changed code. These defects are found by a customer.
• Count the new or changed lines of executable code.
Exclude • Do not count defects discovered or reported during the release but not in the new or changed lines of code.
• Do not count bugs that were reported but were designated as something like duplicates, works as designed, or irreproducible.
Example 20K new and changed KLOEC 100 bugs injected
100/20K = 5 bugs injected per new changed KLOEC Additional Include information on the severity of the defects
found as an indication of whether defects were critical or minor.
Productivity (stories / PM)
Relative KLOEC / PM The objective of this metric is to measure the team’s volume of usefuloutput. We measure both user stories per person month and lines of code per person month. Both metrics are flawed, so using both complements their weaknesses. Stories per person month can vary depending on how broad or subdivided the stories are. Lines of code is precise but not an accurate representative of productivity because the customers do not pay for lines of code – they pay for function or requirements (or ‘Billable Output’ as Frank Maurer put it at XP Universe 2002). However, for comparison to traditional data, it is still useful to gather lines of code/person-month as a cross check to the uncalibrated user stories/PM metric. A benefit of the user stories/PM metric is it creates no extra work for the team.
Count Number of User Stories implemented during the release
and
-New and Changed lines of code in the release Example a) 58 stories / (5.75 people * 5 months) =
28.75 stories / PM and
-b) 9.8 new changed KLOEC / 29 PM = 0.33 new+delta KLOEC / PM
Customer Satisfaction Proponents of XP profess that customers are more satisfied with the resulting project because the team produced what they actually
wanted, rather than what they had originally expressed they wanted. In the future, we plan to author and validate a customer satisfaction survey. The first XP-EF case study used qualitative customer feedback only.
References
[1] V. Basili, G. Caldiera, and D. H. Rombach, "The Goal Question Metric Paradigm," in Encyclopedia of Software Engineering, vol. 2: John Wiley and Sons, Inc., 1994, pp. 528-532.
[2] V. Basili, Shull, F.,Lanubile, F., "Building Knowledge through Families of Experiments," IEEE Transactions on Software Engineering, vol. Vol. 25, No.4, 1999.
[3] K. Beck, Extreme Programming Explained: Embrace Change. Reading, Massachusetts: Addison-Wesley, 2000.
[4] B. Boehm and R. Turner, Balancing Agility and Discipline: A Guide for the Perplexed: Addison Wesley, 2003. [5] B. Boehm and R. Turner, "Using Risk to Balance Agile and Plan-Driven Methods," IEEE Computer, vol. 36, pp.
57-66, June 2003.
[6] F. P. Brooks, The Mythical Man-Month: Addison-Wesley Publishing Company, 1995.
[7] S. R. Chidamber and C. F. Kemerer, "A Metrics Suite for Object Oriented Design," IEEE Transactions on Software Engineering, vol. 20, 1994.
[8] N. I. Churcher and M. J. Shepperd, "Comments on 'A Metrics Suite for Object-Oriented Design'," IEEE Transactions on Software Engineering, vol. 21, pp. 263-5, 1995.
[9] K. El Emam, "A Methodology for Validating Software Product Metrics," National Research Council of Canada, Ottawa, Ontario, Canada NCR/ERC-1076, June 2000 June 2000.
[10] C. Jones, Software Assessments, Benchmarks, and Best Practices. Boston, MA: Addison Wesley, 2000. [11] W. Krebs, "Turning the Knobs: A Coaching Pattern for XP Through Agile Metrics," Extreme Programming/Agile
Universe, Chicago, IL, 2002.
[12] M. Marchesi and G. Succi, "Extreme Programming Examined," in XP Series, K. Beck, Ed. Boston: Addison Wesley, 2001.
[13] M. Marchesi, G. Succi, D. Wells, and L. Williams, "Extreme Programming Perspectives," in XP Series, K. Beck, Ed. Boston: Addison Wesley, 2002.
[14] M. M. Müller and W. F. Tichy, "Case Study: Extreme Programming in a University Environment," 23rd International Conference on Software Engineering (ICSE2001), May 2001.
[15] S. E. Sim, S. Easterbrook, and R. C. Holt, "Using Benchmarking to Advance Research: A Challenge to Software Engineering," International Conference on Software Engineering, Portland, 2003.
[16] R. Subramanyam and M. S. Krishnan, "Empirical Analysis of CK Metrics for Object-Oriented Design Complexity: Implications for Software Defects," IEEE Transactions on Software Engineering, vol. 29, pp. 297-310, April 2003.
[17] D. Wells and L. Williams, "Extreme Programming and Agile Methods -- XP/Agile Universe 2002," in Lecture Notes in Computer Science. Berlin: Springer-Verlag, 2002.
[18] L. Williams, R. Kessler, W. Cunningham, and R. Jeffries, "Strengthening the Case for Pair-Programming," in
IEEE Software, vol. 17, 2000, pp. 19-25.
[19] L. Williams, W. Krebs, L. Layman, and A. Anton, "Toward an XP Evaluation Framework," North Carolina State University Department of Computer Science TR-2003-18, 2003.
Appendix
Shodan 1.3 Input Metric Survey
The Shodan Adherence Survey (adapted from [11]) is a subjective means of gathering adherence information from team members. The survey, answered anonymously via a web-based survey, is composed of 15 questions on the extent to which each individual on a team uses XP practices (testing has been split to three categories and stand up meetings were added to the practices). A survey respondent self-reports the extent to which he or she used the practice, on a scale from 0% (never) to 100% (always). An overall score for the survey is computed via a weighted average of each response. A dependency graph documented by XP author Kent Beck [3] formed the basis of the weightings. In the graph, each practice was a node. An arc was drawn between two practices if at least one of the practices depended upon another the other. For example, the collective code ownership practice depended upon refactoring, pair programming, testing, coding standards, and continuous integration practices. The weighting, created by counting the arcs to each practice node, are shown below when each question is listed.
The survey can be anonymous, but since the team may be small it is good to record an anonymous identifier for each person so, if the results change, you can see if this was due to people joining or leaving the team. After administering the survey, review the weighted results and averages with the team.
A version reformatted for text documents of the survey follows. The weightings of practices are listed in parentheses next to the practice name and are followed by the accompanying question. The web-application for this survey can be found at [http://xxx]. Contact the authors if you would like to use this application for your team. For each question, the respondents were asked to use the following scale:
10 Fanatic (100%)
9 Always (90%)
8 Regular (80%)
7 Often (70%)
6 Usually (60%)
5 Half ‘n Half (50%)
4 Common (40%)
3 Sometimes (30%)
2 Rarely (20%)
1 Hardly ever (10%)
0 Disagree with using this practice
Table 11: Shodan survey questions Practice (Weight) Description
Automated Unit Tests (6%) You run automated unit test (such as JUnit) each time you make a change. What % of your changes are tested with automated unit tests before they are checked in?
Customer Acceptance Tests
(3%) Make sure both the developers and the customer know what they wantWhat % of your requirements have corresponding tests specified by the customer?
Test First Design (3%) Write test cases, then the code. The testcase is the spec. What % of your code line items were written AFTER an automated test was developed for the corresponding scenario?
Pair Programming (12%) Two people, one computer. One thinks strategy, the other tactics. What percentage of your work (design, analysis, coding) was done in pairs?
Refactoring (10%) Rewrite code that 'smells bad' to improve future maintenance and
flexibility without changing its behavior. What % of the time do you stop to cleanup code that has already been implemented without changing functionality?
Release Planning (6%) Customer and developers trade items in and out of the plan based on
Practice (Weight) Description
iteration based on customer feedback and current implementation?
Customer Access (6%) On Site Customer is best, you can use chat, etc. to quickly verify requirements and get feedback. What % of the time do you get quick interaction with your customers when needed?
Short Releases (6%) You have frequent smaller releases instead of larger, less frequent ones. This lets the customer see how it’s going and lets you get feedback. How close are you to having releases that are about 3 months with interim iterations of a couple weeks?
Stand Up Meeting (6%) The team takes 10 minutes each day to review what needs to be done each day and assigns user tasks to team members.
Continuous Integration (10%) Code is checked in quickly to avoid code syncup / integration hassles.
How often do you syncup and check in your code on average? (10 = 3
times a day, 8 = once a day)
Coding Standards (5%) Do you have and adhere to team coding standards? Besides brace placement, this may include things like logging and performance idioms. How often do you follow your team standards?
Collective Ownership (8%) You can change anyone’s code and they can change yours. You don’t get stuck when the expert is busy on vacation. People know many parts of the system. How often do people change code they did not originally write?
Sustainable Pace (5%) People need to be effective over the long haul. How well do you pace yourself?
Example Scores:
10 - I maintain a sustainable pace and the same high rate of output. 5 – I work longer than what I consider a sustainable pace, but still produce at a high rate and feel only a little burnt out.
2 – I work beyond a sustainable pace and feel burnt out. My code isn’t at its usual high quality.
Simple Design (8%) Keep it simple at first; do the simplest thing that could possibly work. You don’t follow the philosophy of “I’ll include this because the customer might possible need it later” even though the feature isn’t in the
requirements. Also, you do not spend a lot of time on design documents. How often do you succeed in ‘Keeping it Simple’?
Metaphor (6%) A single, overarching metaphor is used to describe the system. It is used by developers to help communicate ideas and to explain concepts to customers. How often do you feel this is true of the systems you develop?
Lessons Learned The team reviews how to get better after every release.
Growth Consider the latest tools and practices in addition to skills. If you’re not learning, you’re falling behind!
Morale How often can you say you’re enjoying your work? Ok
Artifact Reduction With agile methods you have fewer/thinner versions of artifacts from classic techniques. This saves time, which can be invested in better tests, new code, refactoring, etc.
To what extent have you been able to:
Have fewer code reviews (Pairing instead), Thinner design specs (Test First Design), and Lighter comments/internal docs (Simple Design, Refactoring)