Prediction of Dropout Students from
Engineering Education using Educational
Data Mining (EDM)
Shreya Gole1, Dr. Preeti Bajaj2, Prof. A. Thomas3
PG scholar, Department of Electronics and Telecommunication, G.H. Raisoni College of Engineering,
Nagpur, India1
Professor, Department of Electronics Engineering, G.H. Raisoni College of Engineering, Nagpur, India 2
Assistant Professor, Department of Computer Science and Engineering, G.H. Raisoni College of
Engineering, Nagpur, India #3
ABSTRACT: In recent years, Engineering Institutes and Universities are increasing in number. This has lead to increase in students opting for Engineering Education however there has also been increase in dropout rate. In worldwide scenario this has increased the need to study the characteristics of students who are being admitted and students who are pursuing education so that the increasing dropout rate can be brought under control. Such scenario can be due to various factors such as unsatisfactory level of learning amongst students, poor academic achievement of student, lack of parent engagement, economic needs of parents, low grasping power and many more. Hence, measures to overcome these factors must be identified, studied and implemented to control the rate of dropouts.“Educational Data Mining” describes research discipline that uses data from educational settings such as universities and colleges and develops methods to gain information and knowledge from the data. A model is proposed using Educational Data Mining that would predict students who are likely to dropout from engineering education. Students’ records such as SSC and HSSC percentages, board of education in SSC and HSSC, Working Status of parents, internal and end semester marks, attendance, performance in remedial classes and many such parameters are taken into account to develop the model to predict whether the student is likely to dropout or fail in Engineering Education. Also parameters such as father’s income, student’s gender, category, and his residing place throughout the education are also considered. The predictions can aid teachers to adopt various proactive measures to deal with such students. They can plan the teaching style or methods for such students and thus control the drop-out rates in the institution.
KEYWORDS: Engineering Education, unsatisfactory level, Educational data mining, Working Status, predictions, proactivemeasures
I. INTRODUCTION
Discovery in Databases (KDD), is the field of discovering novel and potentially useful information from large amounts of data. Data mining has been used in a various fields, including retail sales, bioinformatics, and counter-terrorism. EDM is the domain of scientific search for knowledge which is focused on the creation and improvement of processes and protocols for making discoveries from the unique kinds of data arising from settings in education, and implementing those methods to understand students to be tested and the processes which they learn in [3]. EDM has the potential to expand a wider tool set to the analysis of crucial questions in individual differences. Prediction became a well established research area in the field of EDM due to such requirements. Prediction is a technique which predicts future state rather than a current state [4].Educational Data Mining can be used in wide range of applications and depending upon its use the method of implementing varies. Another technique used in EDM is classification. It’s a two way technique (Training and Testing) which projects the data in predefined class. Classification is a process of supervised learning to allocate data into various classes. [5]
We propose to implement Educational Data Mining to predict dropout students or cancellation of admissions in the course of Engineering. Hence, comparative study of techniques and their results are studied to analyze the graph of such students and find out model characteristics for further use. Also, it would be studied that whether these admissions can be predicted and identified at the time of admitting or after one year or two.Here, in this paper we are trying to form a model wherein its characteristics would tell about students who are likely to dropout from engineering education. This model would be formulated using Educational Data Mining and the corresponding tools and techniques associated with it.
II. RELATED WORK
Research in Educational Data Mining has gained momentum over the past few years. Various aspects of learners and learning styles have been studied. Classification, Clustering, Association rules have been used widely. Students learning situations, attitudes, tendencies, and behaviours have also been studied.It has been observed that different parameters are studied and number of predictions have been obtained by implementing techniques on them. Some of them include final score of each semester, their scores in individual subjects, CGPA[6], in the form of comments[8], educational [12], cultural [12], social, background[10], economic status, academic progress [11,12] and psychological profile [12], background and demographic data, their past scores in junior high school, their GPA of primary class, school ranking, scores for every course (middle term, final term) ,and other psychology related data, personal and family information[9], their previous records such as date of birth, SSC marks[13], mothers’ and fathers’ occupations, scores in languages in specific exam conducted by them as entrance to their school [7,9] and score of subjects in the exam conducted by Department of School Services.[9] It has been observed that authors have only considered the primary education information. Considering the tendency of effect of environment on psychology of student, the family details such as family income, working status of parents and the residing place of student throughout his education can also be considered.
III.DATA MINING PROCESS
A. Data Preparation
The data set used in this study is obtained from G.H. Raisoni College of Engineering, Nagpur, Maharashtra, India for the students of year 2012-13 (admitted) and who will be completing their graduation by the year 2015-16. The internal marks of students are taken as TAE (Teacher Assessment Exam) and CAE (Class Assessment Exam) for five subjects of first year of engineering education. The Semester Grade Point Average (SGPA) is the grade point of student for particular semester. Along with academic marks of students other attributes such as gender, category, marital status, HSSC_PCM marks as total SSC marks, HSSC marks, board of SSC and HSSC, Working Status of Parents, Father’s income (considering as a major contributing share to family’s income) and the student’s residing place throughout his engineering education considered.
B. Data Transformation
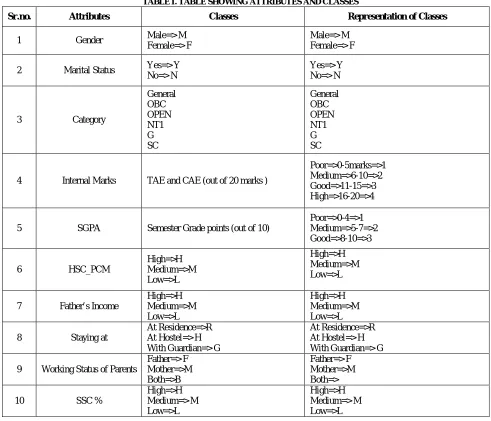
For the prediction of dropouts in engineering education, various attributes are selected.
TABLE I. TABLE SHOWING ATTRIBUTES AND CLASSES
Sr.no. Attributes Classes Representation of Classes
1 Gender Male=> M
Female=> F
Male=> M Female=> F
2 Marital Status Yes=> Y No=> N
Yes=> Y No=> N
3 Category
General OBC OPEN NT1 G SC
General OBC OPEN NT1 G SC
4 Internal Marks TAE and CAE (out of 20 marks )
Poor=>0-5marks=>1 Medium=>6-10=>2 Good=>11-15=>3 High=>16-20=>4
5 SGPA Semester Grade points (out of 10)
Poor=>0-4=>1 Medium=>5-7=>2 Good=>8-10=>3
6 HSC_PCM
High=>H Medium=>M Low=>L
High=>H Medium=>M Low=>L
7 Father’s Income
High=>H Medium=>M Low=>L
High=>H Medium=>M Low=>L
8 Staying at
At Residence=>R At Hostel=> H With Guardian=> G
At Residence=>R At Hostel=> H With Guardian=> G
9 Working Status of Parents
Father=> F Mother=>M Both=>B
Father=> F Mother=>M Both=>
Classification
Techniques
J48
Naive Bayes
Decision
Stump
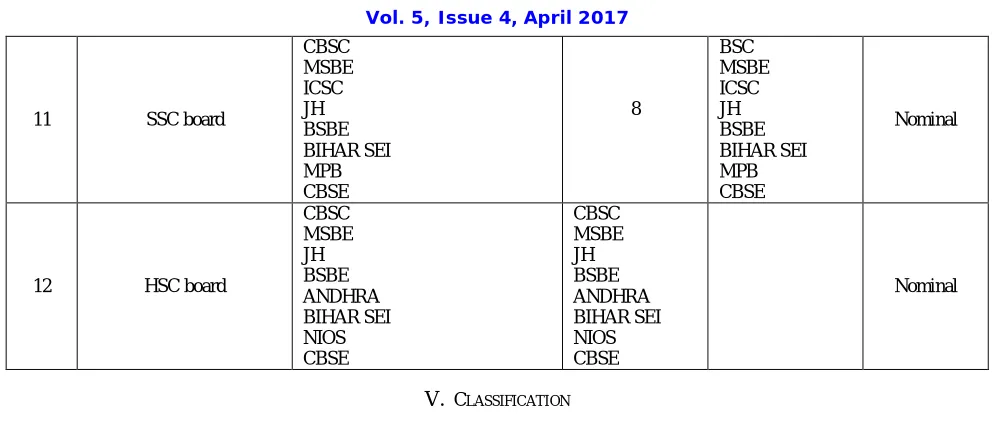
11 SSC board
CBSC MSBE ICSC JH BSBE BIHAR SEI MPB CBSE
CBSC MSBE ICSC JH BSBE BIHAR SEI MPB CBSE
12 HSC board
CBSC MSBE JH BSBE ANDHRA BIHAR SEI NIOS CBSE
CBSC MSBE JH BSBE ANDHRA BIHAR SEI NIOS CBSE
13 Likely to dropout Yes=> Fail No=>Pass
Yes=> Fail (indicated with red colour in graphs)
No=>Pass (indicated with blue colour in graphs)
IV.IMPLEMENTATION
A. Classifiers used
Fig.1 Classification Techniques implemented
In this study, three classifiers namely J48, Decision Stump and Naive Bayes have been used. WEKA 3.7.4 is the data mining tool used for classification and prediction of likely to dropout students from the dataset and for interpreting the relation between likely to dropout, failure students and actual dropouts.
1. J48 classifier
2. Decision stump classifier
Depending on the type of the input feature, several variations are possible. For nominal features, a stump is built which contains a one leaf for each possible feature value or one which corresponds to some chosen category, and the other leaf to all the other categories. Decision stumps are often used with ensemble techniques such as bagging and boosting.
3. Naive Bayes classifier
It is a classification method created from Bayes' Theorem assuming independent predictors. The classifier assumes that if a particular feature is present in a class then it is not related to any other feature’s presence. The Naïve Bayes classifier works on an easy concept. It uses the variables independently which are included in the data sample, by observing each of them. The Naïve Bayes classifier is dependent on the conditional probability derived from Bayes rule. It uses all the parameters included in the data, and then makes an individual analysis as they are important and independent of each other equally. In Naive Bayes classifier, no two attributes are evaluated in connection to each other. Each attribute is examined individually each time of test instance without carrying any prior allied result.
B. Pre-processing of data
Here, total number of instances 96 and attributes 29 are analyzed.
Table II Pre-processing of attributes
Sr.no. Attributes Classes Attribute Status
Distinct Entries Label and Count Type of Data
1 Gender Male=> M
Female=> F 2
M=>52
F=>44 Nominal
2 Marital Status Yes=> Y
No=> N 2
Y=>1
N=>95 Nominal
3 Category
General OBC OPEN NT1 G SC
6
General=>37 OBC=>31 OPEN=>24 NT1=>1 G=>1 SC=>2
Nominal
4 Internal Marks TAE and CAE (out of 20 marks ) 4
1=>23 2=>28 3=>28 4=>17
Numeric
5 SGPA Semester Grade points (out of 10) 3
1=>0 2=>9 3=>87
Numeric
6 HSC_PCM
High=>H Medium=>M Low=>L
3 M=>7
H=>89 Nominal
7 Father’s Income
High=>H Medium=>M Low=>L
3
H=>26 M=>44 L=>26
Nominal
8 Staying at
At Residence=>R At Hostel=> H With Guardian=> G
3
R=>29 H=>44 G=>23
Nominal
9 Working Status of Parents
Father=> F Mother=>M Both=>
3
Father=> F Mother=>M Both=>
Nominal
10 SSC %
High=>H
Medium=> M 3
High=>H
V. CLASSIFICATION
TABLE II CLASSIFICATION ACCURACY WITH TIME
Classifier/parameter
Correctly classified Instances
Incorrectly classified Instances
Percent Accuracy of classification
Time taken for execution (seconds)
J48 87 9 90.62% 0.03
Decision Stump 94 2 97.91% 0.00
Naive Bayes 83 13 86.45% 0.02
Fig. 2 Graphical Representation of Accuracy in classification
Table 2 show that out of the total three classifiers used decision stump classifier is correctly classifying 94 instances out of 96 which gives 97.91% accuracy of classification whereas J48 and Naive Bayes are bit less. Figure 2 show the graphical representation of accuracy in classification. Hence, for this data set we can say that Decision Stump has outperformed the other two classifiers.
VI.OBSERVATION AND CALCULATION OF DROPOUT CAUSES
In this study, the major contributors in the rate of likely to dropout students are analyzed with the data available. Here, WEKA is used to classify and predict the possible dropouts in the dataset. So, by providing WEKA with the ideal (actual) dataset with results as test data, the predicted dataset is obtained.
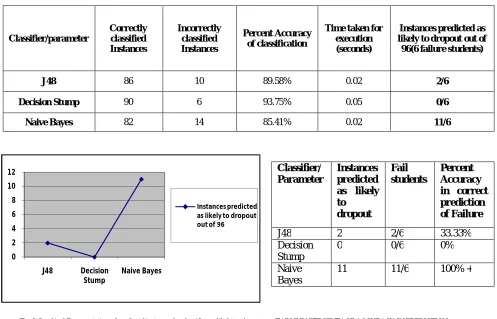
In Table III correctly and incorrectly classified instances, percent accuracy in classification, time taken for classification are mentioned. We have 6 students failing in the dataset. So here we calculated whether these 6 students are predicted by the classifiers as likely to dropout. Hence, in column 6 of table III we find that 2 students are predicted out of the 6 failing by J48, no students are predicted by decision stump and 11 students predicted by naive bayes which are inclusive of the 6 failing students. Figure 3 shows the graphical representation of predicted instances by classifier as likely to dropout. Table IV shows the percentage of predicted dropout students by classifiers to actual failure students in the dataset.
11 SSC board
CBSC MSBE ICSC JH BSBE BIHAR SEI MPB CBSE
8
BSC MSBE ICSC JH BSBE BIHAR SEI MPB CBSE
Nominal
12 HSC board
CBSC MSBE JH BSBE ANDHRA BIHAR SEI NIOS CBSE
CBSC MSBE JH BSBE ANDHRA BIHAR SEI NIOS CBSE
Nominal
5 20 35 50 65 80 95
J48 Naive Bayes
Correctly classified Instances
TABLE III PREDICTED INSTANCES USING WEKA
Classifier/parameter
Correctly classified Instances
Incorrectly classified Instances
Percent Accuracy of classification
Time taken for execution (seconds)
Instances predicted as likely to dropout out of
96(6 failure students)
J48 86 10 89.58% 0.02 2/6
Decision Stump 90 6 93.75% 0.05 0/6
Naive Bayes 82 14 85.41% 0.02 11/6
Fig. 3 Graphical Representation of predicted instances by classifier as likely to dropout TABLE IV PERCENTAGE ACCURACY IN PREDICTION
It is observed that out of total instances considered 6 students are failing according to actual result. Now, these students are analyzed from which factors affecting point of view. Table V shows the description of failing students’ attributes who are failing in the dataset considered.
TABLE V DESCRIPTION OF FAILING STUDENTS’ ATTRIBUTES
Sr.no. Attributes Number Observation (Attribute of failing students)
1 Gender M=>6/6
F=>0/6 Male
2 Marital Status
Y=>0/6
N=>6/6 Unmarried
3 Category
General=>4/6 OBC=>2/6 OPEN=>0/6 NT1=>0/6 G=>0/6 SC=>0/6
4 from general and 2 from OBC category
4 Internal Marks
1=>2/6 2=>2/6 3=>1/6 4=>1/6
Students scoring in range 0-10 are 2-2 and in the range 11-20 are 1-1
2=>4/6
Classifier/ Parameter
Instances predicted as likely to dropout
Fail students
Percent Accuracy in correct prediction of Failure
J48 2 2/6 33.33%
Decision Stump
0 0/6 0%
Naive Bayes
11 11/6 100% +
0 2 4 6 8 10 12
J48 Decision
Stump
Naive Bayes
6 HSC_PCM M=>1/6
H=>5/6 Students with medium range PCM marks is 1 and high range PCM are 5
7
Father’s Income
H=>3/6 M=>0/6 L=>3/6
Students whose parents have high and low income are 3
8 Staying at
R=>1/6 H=>3/6 G=>2/6
Students living at hostel are 3, with guardian are 2 and with their parents at residence 2
VII. CONCLUSIONS
As seen in Table V all the dropouts are male which can be implied as females have more sincere approach towards maintaining good academic as well as other activities’ record. As observed here we obtained more likely to dropout students in general and OBC category. This alone doesn’t satisfy their share in dropout but states a pattern of possible dropout. Students scoring internal marks in the range as 0-10 out 20 are more likely to dropout. Hence, their internal assessment must be more meticulously done for improvement. This implies that parameters such as attendance, timely submission of assignments, presentation skills etc. must be more keenly assessed for reduction in dropout of failure of students. Students with SGPA in range 5-7 out of 10 are more likely to dropout. This suggests that if a student is failing or is likely to perform poor in one semester, he/she tends to carry this attitude and approach for further semesters also. Hence, this can help in auditing the poor performers. It is not necessary that students with high PCM marks in HSSC exam are fewer dropouts because this study surprisingly showed that students with higher PCM are failing in their engineering education. Student’s whose fathers’ incomes are in low or high ranges are more susceptible to dropping education. Father’s income directly affects the environment at the student’s place. Low income may keep him deprived of required facilities otherwise it may lead to lack of interest in attaining education. High income may lead to over provision of freedom and allied facilities and again otherwise lead to lack of interest in gaining knowledge. Students staying at hostel are more likely to dropout. This observation has many connotations as in host élites have higher freedom and more pressure of peers than students living at their residences. Students whose fathers are working are found to be failed in this dataset. Student’s with higher SSC marks are failing in engineering is again a surprising revelation. Students in SSC and HSSC both from Maharashtra State Board are found to fail in maximum number. It can be observed that a number of factors are responsible for poor performance of students. Such student if identified at an early stage can be closely monitored to improve their performance.
REFERENCES
[1] http://timesofindia.indiatimes.com/city/hyderabad/Engineering-college-dropout-rate-registers-a-rise/articleshow/12904590.cms [2] http://www.engineering.careers360.com/articles/dropout-rate-shrinks-40-cent-at-iits-in-2015-16-says-mhrd
[3] Baker. "Data Mining", International Encyclopedia of Education, 2010
[4] Jindal, R., Malaya Dutta Borah, "A Survey on Educational Data Mining And Research Trends." 2013 International Journal of Database Management Systems ( IJDMS ) Vol.5(3).
[5] Taylan, O., Karagözoğlu, Bahattin , "An adaptive neuro -fuzzy model for prediction of student’s academic performance." 2009 Computers & Industrial Engineering 57(3): 732-741.
[6] Norlida Buniyamin, Usamah bin Mat, Pauziah Mohd Arshad, “Educational Data Mining for Prediction and Classification of Engineering Students Achievement” 2015 IEEE International Conference on Engineering Education (ICEED)
[7] Bo Guo, Rui Zhang, Guang Xu, Chuangming Shi, Li Yang , “Predicting Students Performance in Educational Data Mining”, 2015 International Symposium on Educational Technology
[8] Shaymaa E. Sorour, Kazumasa Goda, Tsunenori Mine, “Estimation of Student Performance by Considering Consecutive Lessons”, 2015 IIAI 4th International Congress on Advanced Applied Informatics
[9] Anjana Pradeep, Smija Das, Jubilant J Kizhekkethottam, “Students Dropout Factor Prediction Using EDM Techniques”, 2015 International Conference on Soft-Computing and Network Security Coimbatore, INDIA
[10] Ajay Kumar Pal , Saurabh Pal, “Classification Model of Prediction for Placement of Students” , I.J. Modern Education and Computer Science, 2013
[11] Jai Ruby, Dr. K. David, “Predicting the Performance of Students in Higher Education Using Data Mining Classification Algorithms - A Case Study”, International Journal for Research in Applied Science & Engineering Technology (IJRASET), Volume 2 Issue XI, November 2014 [12] V. Vivekanandan, A. Devipriya, “Prediction of student failure and dropout Using decision support system”, Karpagam Journal of Engineering
[13] Saurabh Pal, “Mining Educational Data to Reduce Dropout Rates of Engineering Students”, I.J. Information Engineering and Electronic Business, 2012
[14] Sweta Rai, Priyanka Saini, Ajit Kumar Jain, “Model for Prediction of Dropout Student Using ID3 Decision Tree Algorithm”, International Journal of Advanced Research in Computer Science & Technology (IJARCST 2014)
[15] Carlos Márquez-Vera, Alberto Cano, Cristobal Romero, Amin Yousef Mohammad Noaman, Habib Mousa Fardoun, and Sebastian Ventura, “Early dropout prediction using data mining: a case study with high school students”, 2015 Wiley Publishing Ltd Expert Systems, February 2016, Vol. 33, No. 1
BIOGRAPHY
Shreya Gole is a PG scholar pursuing MTECH in Communication Engineering from Electronics and Telecommunication Department, G.H. Raisoni College of Engineering, Nagpur. She received Bachelor of Engineering degree in 2015 from GHRCE, NAGPUR, MS, India.
Dr. Preeti Bajaj is Professor in the Department of Electronics and Telecommunication, G.H. Raisoni College of Engineering, Nagpur, MS, India.