University of Windsor University of Windsor
Scholarship at UWindsor
Scholarship at UWindsor
Electronic Theses and Dissertations Theses, Dissertations, and Major Papers
11-7-2015
Bioenergetics modeling to assess aquatic invasive species
Bioenergetics modeling to assess aquatic invasive species
trophic impact
trophic impact
Nickolas John Kosmenko
University of Windsor
Follow this and additional works at: https://scholar.uwindsor.ca/etd
Recommended Citation Recommended Citation
Kosmenko, Nickolas John, "Bioenergetics modeling to assess aquatic invasive species trophic impact" (2015). Electronic Theses and Dissertations. 5511.
https://scholar.uwindsor.ca/etd/5511
This online database contains the full-text of PhD dissertations and Masters’ theses of University of Windsor students from 1954 forward. These documents are made available for personal study and research purposes only, in accordance with the Canadian Copyright Act and the Creative Commons license—CC BY-NC-ND (Attribution, Non-Commercial, No Derivative Works). Under this license, works must always be attributed to the copyright holder (original author), cannot be used for any commercial purposes, and may not be altered. Any other use would require the permission of the copyright holder. Students may inquire about withdrawing their dissertation and/or thesis from this database. For additional inquiries, please contact the repository administrator via email
BIOENERGETICS MODELING TO ASSESS AQUATIC INVASIVE SPECIES
TROPHIC IMPACT
by
Nickolas Kosmenko
A Thesis
Submitted to the Faculty of Graduate Studies
through the Great Lakes Institute for Environmental Research in Partial Fulfillment of the Requirements for
the Degree of Master of Science at the University of Windsor
Windsor, Ontario, Canada
2015
BIOENERGETICS MODELING TO ASSESS AQUATIC INVASIVE SPECIES
TROPHIC IMPACT
Nickolas Kosmenko
APPROVED BY:
Dr. D. Higgs
University of Windsor, Biological Sciences
Dr. C. Semeniuk
University of Windsor, Great Lakes Insitute for Environmental Research
Dr. Timothy B. Johnson, Co-advisor
Ontario Ministry of Natural Resources and Forestry
Dr. Ken G. Drouillard, Co-advisor
University of Windsor, Great Lakes Institute for Environmental Research
iii
Declaration of Co-Authorship / Previous Publication
I. Co-Authorship Declaration
I hereby declare this thesis incorporates material thatis a result of joint research, as follows:
This thesis includes research that was conducted under the supervision of Dr. Timothy Johnson and Dr. Ken Drouillard, and with assistance from Dr. Christina Semeniuk. The first author was responsible for completing all analyses and interpretations, and deciding on final experimental designs. Co-authors provided guidance regarding methods, helped in the understanding of concepts, theories, and statistical procedures, and proof-read chapter drafts.
I am aware of the University of Windsor Senate Policy on Authorship and I certify that I have properly acknowledged the contribution of other researchers to my thesis, and have obtained written permission from each of the co-author(s) to include the above material(s) in my thesis.
I certify that, with the above qualification, this thesis, and the research to which it refers, is the product of my own work.
II. Declaration of Previous Publication
This thesis includes one original paper that have been previously published/submitted for publication in a peer reviewed journal, as follows:
Thesis Chapter Publication title/full citation Publication status*
Chapter 2 Kosmenko, N., T. B. Johnson, K. G.
Drouillard, and C. Semeniuk. In Preparation. Trophic impact comparisons between co-existing invasive and native fish species.
In Preparation
I certify I have obtained written permission from the copyright owner(s) to include the above published material(s) in my thesis. I certify the above material describes work completed during my registration as a graduate student at the University of Windsor.
iv
Copyright Act, I certify that I have obtained written permission from the copyright owner(s) to include such material(s) in my thesis.
I declare this is a true copy of my thesis, including any final revisions, as
v ABSTRACT
Energy requirements of aquatic invasive species (AIS) relative to native species
may help explain differences in trophic impact, as species requiring more energy must
consume more food, depleting resources more quickly. Variables relating to energy use
were compared between co-existing invasive and native fish species in invaded habitats.
Most comparisons (8/12) demonstrated higher rates in invasive species (1-46% greater),
suggesting high trophic impact is a characteristic of AIS and should be of consideration
in management. Bioenergetic mass-balance principles indicate energy consumed by a
fish is offset by metabolic (~40%), waste (~30%), and growth (~30%) demands. Since
routine metabolic rate data are copious, this rate was used as a surrogate for trophic
impact. Non-parametric analyses were used to find relationships between RMR and
traits, creating models to predict trophic impact. The models performed poorly, yet
age-at-maturity, maximum total length, and eye diameter-to-head length ratio were
vi
ACKNOWLEDGEMENTS
Gratitude is expressed to committee members, Dr. Tim Johnson, Dr. Ken
Drouillard, Dr. Christina Semeniuk, and Dr. Dennis Higgs as well as to Dr. Dave
Beauchamp, Dr. Jamal Moss, Rachel Hovel, and Dr. Kyle Hartman for contributing
bioenergetics data. This study was supported by the NSERC Canadian Aquatic Invasive
Species Network II to TBJ and KGD, the Ontario Ministry of Natural Resources and
vii
TABLE OF CONTENTS
DECLARATION OF CO-AUTHORSHIP / PREVIOUS PUBLICATION ... iii
ABSTRACT ...v
ACKNOWLEDGEMENTS ... vi
LIST OF TABLES ... ix
LIST OF FIGURES ...x
LIST OF APPENDICES ... xiv
CHAPTER 1: GENERAL INTRODUCTION ...1
AQUATIC INVASIVE SPECIES ...1
RESEARCH PURPOSE AND OBJECTIVES ...6
METHODS TO ESTIMATE CONSUMPTION AND METABOLISM ...6
BIOENERGETIC MODEL ...8
REFERENCES ...15
CHAPTER 2: TROPHIC IMPACT COMPARISONS BETWEEN CO-EXISTING INVASIVE AND NATIVE FISH SPECIES ...21
INTRODUCTION ...21
METHODS ...25
RESULTS ...30
Case-histories of Invasive Fishes ...30
Bighead and Silver Carp in La Grange Reach, Illinois River ...30
Lake Trout in Hector Lake, Alberta ...32
Alewife in Southeastern Lake Michigan ...34
Case-studies of Invasive Fishes ...38
Rainbow Smelt in Crystal Lake, Wisconsin ...38
Chinook Salmon in Lake Michigan ...39
White Perch in Lake Erie ...40
Follow-up Literature Search ...41
DISCUSSION ...43
REFERENCES ...50
viii
INTRODUCTION ...57
METHODS ...62
Metabolic Rate Analysis...62
Trait Analysis ...63
Fish Datasets ...70
Statistics ...71
RESULTS ...73
Metabolic Rate Data ...73
Fish Traits used to Predict RMR ...74
Prediction of RMR from Fish Traits ...80
DISCUSSION ...90
Fish Traits ...90
Scrutinizing RMR Measures ...92
Effects of Taxonomy ...93
Activity Multipliers ...94
Place of Food Consumption Analyses in AIS Management ...95
Future Work...97
REFERENCES ...99
CHAPTER 4: GENERAL DISCUSSION ...105
REFERENCES ...112
APPENDICES ...114
ix
LIST OF TABLES
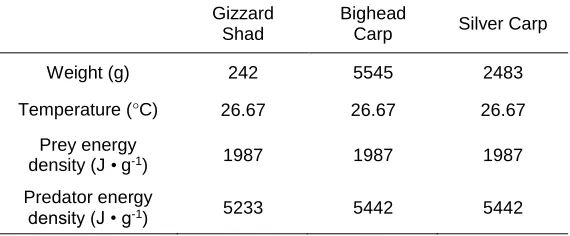
2.1. Inputs used in bioenergetic calculations comparing food consumption rates, routine
metabolic rates, and growth rates of Gizzard Shad Dorosoma cepedianum, Bighead Carp
Hypophthalmichthys nobilis, and Silver Carp Hypophthalmichthys molitrix ...32
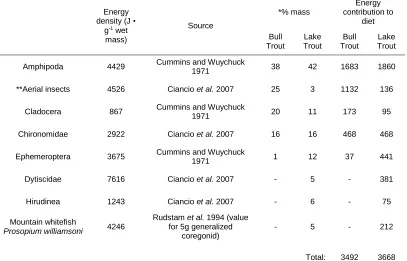
2.2. Diet information for Bull Trout Salvelinus confluentus and Lake Trout Salvelinus
namaycush in Hector Lake, Alberta, provided by Donald and Alger (1993). Energy
densities were retrieved from literature ...33
2.3. Inputs used in bioenergetic calculations comparing food consumption rates, routine metabolic rates, and growth rates of Bull Trout Salvelinus confluentus and Lake Trout
Salvelinus namaycush ...33
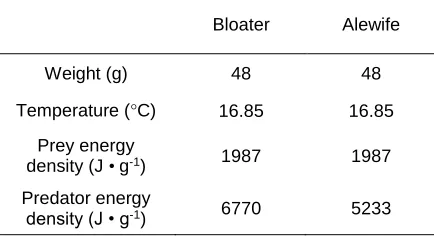
2.4. Inputs used in bioenergetic calculations comparing food consumption rates, routine metabolic rates, and growth rates of Bloater Coregonus hoyi and Alewife Alosa
pseudoharengus ...35
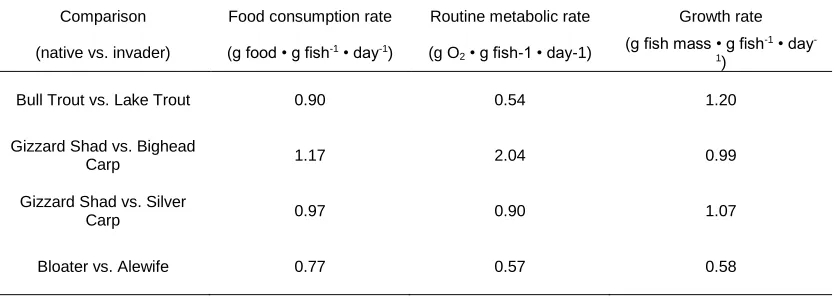
2.5. Ratios of food consumption, routine metabolic, and growth rates for co-existing native and invasive species. Species compared are native Bull Trout Salvelinus
confluentus and invasive Lake Trout Salvelinus namaycush in Hector Lake, Alberta;
native Gizzard Shad Dorosoma cepedianum and invasive Bighead Carp
Hypophthalmichthys nobilis and Silver Carp Hypophthalmichthys molitrix in La Grange
Reach, Illinois River; and native Bloater Coregonus hoyi and invasive Alewife Alosa
pseudoharengus in Lake Michigan ...38
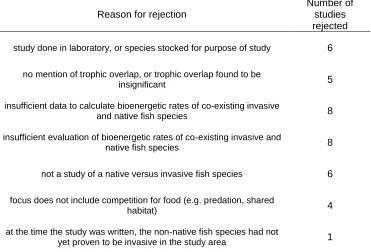
Table 2.6. Number of, and reasons for, rejections of studies obtained through a literature search using Web of Science with the purpose of quantifying effort required to find studies adequately allowing assessment of trophic impact of invasive relative to co-existing native fish species through two objectives: 1) provide and compare measures of FCR, RMR, and GR of invasive and co-existing native fish species based on actual scenarios, and 2) summarize actual scenarios that evaluated one or more of FCR, RMR, and/or GR in invasive compared to co-existing native fish species. Note: some studies were rejected for multiple reasons ...43
x
LIST OF FIGURES
1.1. Maximum food consumption rate of a Yellow Perch Perca flavescens at 23°C
(Kitchell et al. 1977) ...10
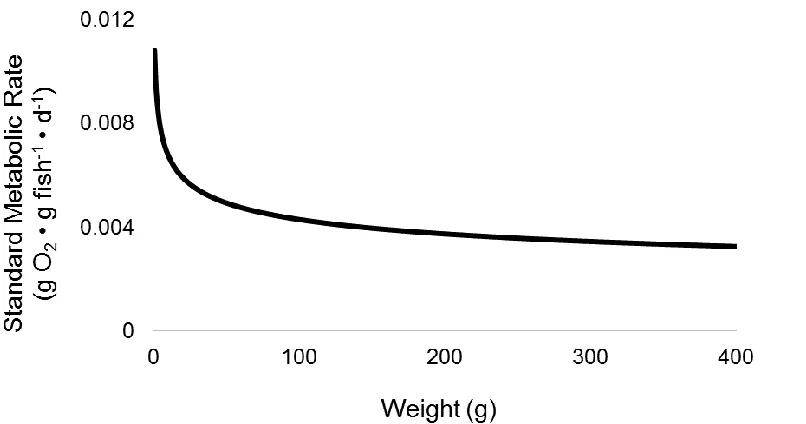
1.2. Standard metabolic rate of a Yellow Perch Perca flavescens at 23°C (Kitchell et al.
1977) ...10
1.3. Maximum food consumption rates of a 50g Lake Trout Salvelinus namaycush
(Stewart et al. 1983), a 50g Yellow Perch Perca flavescens (Kitchell et al. 1977), and a 50g Alewife Alosa pseudoharengus (Stewart and Binkowski 1986) ...11
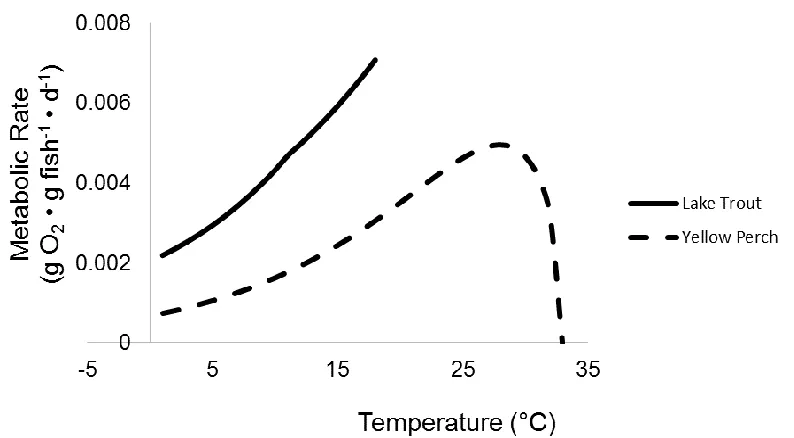
1.4. Routine metabolic rates of a 50g Lake Trout Salvelinus namaycush (Stewart et al.
1983), a 50g Yellow Perch Perca flavescens (Kitchell et al. 1977), and a 50g Alewife
Alosa pseudoharengus (Stewart and Binkowski 1986) ...11
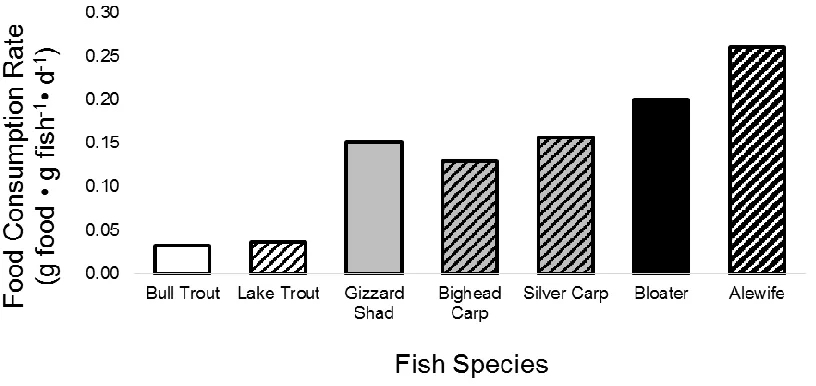
2.1. Food consumption rates of native Bull Trout Salvelinus confluentus and invasive Lake Trout Salvelinus namaycush in Hector Lake, Alberta (white bars); native Gizzard
Shad Dorosoma cepedianum and invasive Bighead Carp Hypophthalmichthys nobilis and
Silver Carp Hypophthalmichthys molitrix in La Grange Reach, Illinois River (gray bars); and native Bloater Coregonus hoyi and invasive Alewife Alosa pseudoharengus in Lake Michigan (black bars). Solid bars indicate native species and striped bars indicate
invasive species ...36
2.2. Routine metabolic rates of native Bull Trout Salvelinus confluentus and invasive Lake Trout Salvelinus namaycush in Hector Lake, Alberta (white bars); native Gizzard
Shad Dorosoma cepedianum and invasive Bighead Carp Hypophthalmichthys nobilis and
Silver Carp Hypophthalmichthys molitrix in La Grange Reach, Illinois River (gray bars); and native Bloater Coregonus hoyi and invasive Alewife Alosa pseudoharengus in Lake Michigan (black bars). Solid bars indicate native species and striped bars indicate
invasive species ...37
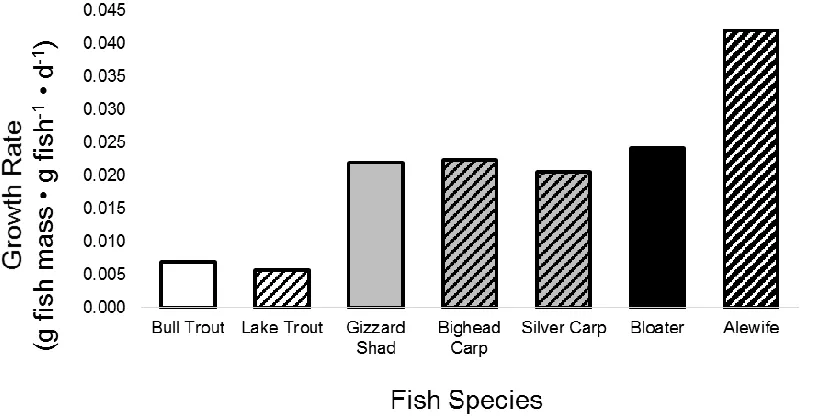
2.3. Growth rates of native Bull Trout Salvelinus confluentus and invasive Lake Trout
Salvelinus namaycush in Hector Lake, Alberta (white bars); native Gizzard Shad
Dorosoma cepedianum and invasive Bighead Carp Hypophthalmichthys nobilis and
Silver Carp Hypophthalmichthys molitrix in La Grange Reach, Illinois River (gray bars); and native Bloater Coregonus hoyi and invasive Alewife Alosa pseudoharengus in Lake Michigan (black bars). Solid bars indicate native species and striped bars indicate
invasive species ...37
3.1. Relationships between routine metabolic rate (RMR; g O2 • g fish-1 • d-1) and a
xi
total length ratio (%), FL=fork length to total length ratio (%), PD=pre-dorsal length to total length ratio (%), BD=body depth to total length ratio (%), HL=head length to total length ratio (%), ED=eye diameter to head length ratio (%), PO=pre-orbital length to head length ratio (%), ML=maximum lifespan (years), and MF=maximum fecundity (number) ...76
3.2. Relationships between routine metabolic rate (RMR; g O2 • g fish-1 • d-1) and a
number of traits from 49 species of freshwater (and highly anadromous), north-temperate (≥ 40°N latitude) fish species analyzed for relationships with RMR. X-axes of plots correspond with the trait occurring in the same column. Y-axes of plots correspond with the trait occurring in the same row. K=von Bertalanffy growth coefficient (cm • year-1), PA=pre-anal length to total length ratio (%), PPEL=pre-pelvic length to total length ratio (%), PPEC=pre-pectoral length to total length ratio (%), and CA=caudal aspect ratio ....77
3.3. Distributions of routine metabolic rate (RMR; g O2 • g fish-1 • d-1) and a number of
traits from 66 species of freshwater (and highly anadromous), north-temperate (≥ 40°N latitude) fish species analyzed for relationships with RMR. TRL=trophic level, AM=age at maturity (years), MW=maximum weight (g), MTL=maximum total length (mm), SL=standard length to total length ratio (%), FL=fork length to total length ratio (%), PD=pre-dorsal length to total length ratio (%), BD=body depth to total length ratio (%), HL=head length to total length ratio (%), ED=eye diameter to head length ratio (%), PO=pre-orbital length to head length ratio (%), ML=maximum lifespan (years), and MF=maximum fecundity (number) ...78
3.4. Distributions of a number of traits from 49 species of freshwater (and highly anadromous), north-temperate (≥ 40°N latitude) fish species analyzed for relationships with routine metabolic rate. K=von Bertalanffy growth coefficient (cm • year-1),
PA=pre-anal length to total length ratio (%), PPEL=pre-pelvic length to total length ratio (%), PPEC=pre-pectoral length to total length ratio (%), and CA=caudal aspect ratio ...79
3.5. Classification tree (rpart (Therneau et al. 2015) package in R, plotted with partykit (Hothorn and Zeileis 2015) package in R, set.seed(1)) to predict routine metabolic rate (RMR) from 60 freshwater (and highly anadromous), north-temperate (≥ 40°N latitude) fish using six independent variables (determined important in describing RMR by random forest procedures) related to morphology, physiology, and ecology. Results of validation using six fish withheld from the dataset used to train the model are shown. Validation species are placed below RMR boxes into which they were classified when run through the CT. Letters beside species’ names represent actual RMR categories based on listing all 66 species in asceding order of RMR and dividing into four groups based on quartiles (A, B, C, and D). A failed classification is one in which actual species category does not match the category with the tallest bar in the box in which the species was classified, as bars represent frequency of species from the training data belonging to each category. Passing criteria was four successful classifications out of six ...81
3.6. Classification tree (rpart (Therneau et al. 2015) package in R, plotted with partykit
xii
freshwater (and highly anadromous), north-temperate (≥ 40°N latitude) fish using four independent variables (determined important in describing RMR by random forest procedures) related to morphology and physiology. Results of validation using six fish withheld from the dataset used to train the model are shown. Validation species are placed below RMR boxes into which they were classified when run through the CT. Letters beside species’ names represent actual RMR categories based on listing all 66 species in asceding order of RMR and dividing into four groups based on quartiles (A, B, C, and D). A failed classification is one in which actual species category does not match the category with the tallest bar in the box in which the species was classified, as bars represent frequency of species from the training data belonging to each category. Passing criteria was four successful classifications out of six ...82
3.7. Predicted versus observed routine metabolic rates of six species of freshwater, north-temperate (≥ 40°N latitude) fish used to validate a random forest created to predict rates of freshwater (and highly anadromous), north-temperate fish from analysis of 60 species and five traits (prey type, age at maturity, maximum total length, eye diameter to head length ratio, and maximum lifespan). The line indicates the 1:1 (predicted:observed) relationship, which the points would have followed had the random forest made
successful predictions ...84
3.8. Predicted versus observed routine metabolic rates of six species of freshwater, north-temperate (≥ 40°N latitude) fish used to validate a random forest created to predict rates of freshwater (and highly anadromous), north-temperate fish from analysis of 60 species and three traits (age at maturity, maximum total length, and eye diameter to head length ratio). The line indicates the 1:1 (predicted:observed) relationship, which the points would have followed had the random forest made successful predictions ...85
3.9. Out-of-bag (Breiman, L. 2001. Random forests. Machine Learning 45:5-32) predicted versus observed routine metabolic rates of 60 species of freshwater, north-temperate (≥ 40°N latitude) fish from a random forest created to predict rates of
freshwater (and highly anadromous), north-temperate fish from analysis of the same 60 species as well as five traits (prey type, age at maturity, maximum total length, eye diameter to head length ratio, and maximum lifespan). The line indicates the 1:1
(predicted:observed) relationship ...86
3.10. Out-of-bag (Breiman, L. 2001. Random forests. Machine Learning 45:5-32) predicted versus observed routine metabolic rates of 60 species of freshwater, north-temperate (≥ 40°N latitude) fish from a random forest created to predict rates of
freshwater (and highly anadromous), north-temperate fish from analysis of the same 60 species as well as three traits (age at maturity, maximum total length, and eye diameter to head length ratio). The line indicates the 1:1 (predicted:observed) relationship ...87
xiii
well as five traits (prey type, age at maturity, maximum total length, eye diameter to head length ratio, and maximum lifespan). The line indicates the 1:1 (predicted:observed) relationship ...88
xiv
LIST OF APPENDICES
A1. Fish physiological parameter values for use in the Wisconsin Bioenergetics Model (Hanson et al. 1997), used in Chapter 2 ...115
A2. Fish routine metabolic rate physiological parameter values for use in the Wisconsin Bioenergetics Model (Hanson et al. 1997), used in Chapter 3. Values based on fits of data points are approximations. Also shown are data used to generate fits, including temperature and weight bounds used in source studies ...118
A3. Species included in Chapter 3, including indication of use (x) in each dataset (mt = main training set, v = validation set, s = subset, r1-10 = reduced sets) ...144
A4. Representation of North American, north-temperate (≥ 40°N latitude) fish families in Chapter 3 ...149
A5. Routine metabolic rate of each species included in Chapter 3. Rates were calculated using the approximate weight at maturity and final temperature preferendum of each species ...150
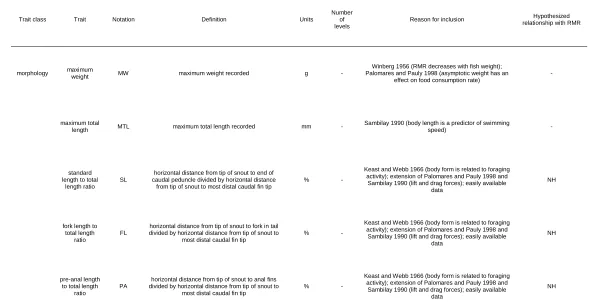
A6. Trait data for each species examined in Chapter 3. K = von Bertalanffy growth coefficient, TRL = trophic level, TG = trophic guild, AM = age at maturity, ST = swim type, MW = maximum weight, MTL = maximum total length, SL = standard length to total length ratio, FL = fork length to total length ratio, PA = pre-anal length to total length ratio, PD = pre-dorsal length to total length ratio, PPEL = pre-pelvic length to total length ratio, BD = body depth to total length ratio, HL = head length to total length ratio, ED = eye diameter to head length ratio, PO = pre-orbital length to head length ratio, CA = caudal fin aspect ratio, BS = body shape, MP = mouth position, HP = habitat
preference, ML = maximum lifespan, MF = maximum fecundity ...159
A7. Variable importance scores determined by classification random forests in Chapter 3. Underlined values were considered important. K = von Bertalanffy growth coefficient, TRL = trophic level, TG = trophic guild, AM = age at maturity, ST = swim type, MW = maximum weight, MTL = maximum total length, SL = standard length to total length ratio, FL = fork length to total length ratio, PA = pre-anal length to total length ratio, PD = pre-dorsal length to total length ratio, PPEL = pre-pelvic length to total length ratio, BD = body depth to total length ratio, HL = head length to total length ratio, ED = eye
diameter to head length ratio, PO = pre-orbital length to head length ratio, CA = caudal fin aspect ratio, BS = body shape, MP = mouth position, HP = habitat preference, ML = maximum lifespan, MF = maximum fecundity ...209
xv
= pre-dorsal length to total length ratio, PPEL = pre-pelvic length to total length ratio, BD = body depth to total length ratio, HL = head length to total length ratio, ED = eye
diameter to head length ratio, PO = pre-orbital length to head length ratio, CA = caudal fin aspect ratio, BS = body shape, MP = mouth position, HP = habitat preference, ML = maximum lifespan, MF = maximum fecundity ...211
A9. R scripts used in this research ...213
1 CHAPTER 1
GENERAL INTRODUCTION
AQUATIC INVASIVE SPECIES
The term “invasive” is used when a non-native species creates negative impacts
on an invaded ecosystem. Ricciardi and Cohen (2007) linked “high impact” to species
“that have caused (either solely or in concert with other stressors) near total extirpations
of multiple native species in multiple regions”. In cases where evidence was lacking,
impact was related to native species’ declines post-introduction, and whether declines
were linked to an increase in the invader’s population. Similarly, Ruiz et al. (1999)
defined ecological impact as “significant and measurable changes in the abundance or
distribution of resident species or habitats”. Although the definitions vary, “impact” is
typically associated with some sort of harm and, therefore, “invasive” species are species
that cause harm.
The harm invasive species may cause includes competition, predation, parasitism,
hybridization, niche displacement and behavioural changes in native species, herbivory,
habitat change, bioturbation, toxicity, and/or the introduction of new diseases relative to
native communities (Wilson 1992; Wilcove et al. 1998; Ruiz et al. 1999). Invasive
species are considered the second-greatest cause of native species’ extinctions in the
United States (Wilcove et al. 1998; Clavero and Garcia-Berthou 2005), having been
estimated to cost the United States $137 billion annually (Primentel et al. 2000; Colautti
et al. 2006). In Canada, invasive species are the sixth-leading threat to endangered
2
interactions, natural causes, and pollution have each been shown to affect larger
quantities of endangered species in Canada, invasive species still threaten a significant
percentage (22%; Venter et al. 2006). Altogether, invasive species cost Canada between
$7.5 and $35 billion per year in management expenditures and economic losses from
resource declines (Dawson 2002; Colautti et al. 2006).
Developed countries are most active when it comes to importing invasive species,
with Canada ranked ninth and the United States first (Lenzen et al. 2012). Leprieur et al.
(2008) found a variety of human factors (gross domestic product, population density,
percentage of urban area) may be related to non-native species richness in river basins in
the Northern Hemisphere. Similarly, Marchetti et al. (2004) found disturbances caused
by humans (mainly urbanization and water development) are common across invaded
areas in California. These findings support the human activity hypothesis, which
suggests habitat disruption and increased propagule pressure of non-native species, both
resulting from human activities, facilitate establishment of non-native organisms
(Leprieur et al. 2008). However, Ricciardi and Cohen (2007) report an organism’s
establishment and rate of spread determine only its “invasiveness”, and neither
component is related to the magnitude of impact. As such, the current research focuses
on the impact stage only, with emphasis on Canada.
Due to the large amount of water within Canada as well as its significant coastal
area, this country is considered particularly vulnerable to invasion by aquatic invasive
species (AIS; CCFAM Aquatic Invasive Species Task Group 2004). Approximately
three AIS become established in Canada’s coastal or inland waters every two years
3
marinus have established large populations in all the Laurentian Great Lakes (hereafter
referred to as the Great Lakes) and have caused declines in important commercial and
sport fish. The decline in top predators helped facilitate population increases in invasive
Alewife Alosa pseudoharengus (Smith and Tibbles 1980), which preyed on young of
important species such as Lake Trout Salvelinus namaycush (Krueger et al. 1995;
Madenjian et al. 2008) and Yellow Perch Perca flavescens (Brandt et al. 1987). Further,
early mortality syndrome (EMS) has resulted from thiamine deficiency in eggs of some
species that consumed Alewives (Ketola et al. 2000; Honeyfield et al. 2005). Yet along
with the negative impacts associated with AIS, there have also been positive impacts.
Invasive Alewife and Rainbow Smelt Osmerus mordax have become important forage for
predatory fish in the Great Lakes. Many of these predators are introduced salmonids,
which are a key component of the $7 billion recreational fishery in the Great Lakes. The
recently verified high incidence of naturally reproducing salmonids provides a new
challenge for managers trying to balance predator demand with prey supply (Murry et al.
2010; Marklevitz et al. 2011). Collectively, billions of dollars have been spent by
governments surrounding the Great Lakes on direct management (i.e. Sea Lamprey
control) and stocking programs to rehabilitate and/or enhance the fisheries and ecological
health of the lakes. Methods of predicting magnitude of AIS impact would be
informative in management decisions, as managers would know which fish species
contribute most to resource declines, and which simply coexist (or don’t establish
populations) in recipient environments with native species. Enhanced ability to anticipate
high impact species would alleviate some of the financial- and time-related burdens of
4
Essington et al. (2001) emphasized the need for methods of predicting impact that
are inexpensive and efficient, and that such methods should make use of the large variety
of life-history information that has been collected for various fish species. Simon and
Townsend (2003) further recommended generalizations pertaining to impacts be made
across large, similar groups, as this would allow for earlier mitigation than would
scrutinizing individual species. However, it is evident impact can be comprised of an
array of negative effects (competition, predation, hybridization, niche displacement,
changes in native species’ behaviour, etc.), and although it would be helpful to have a
single tool that successfully predicts overall impact of AIS relative to each other, the
individual components of impact should first be better understood. An obvious starting
point is trophic impact. In this research, “trophic impact” is related to food consumption
and energy use only, and does not include other aspects contributing to overall impact.
Bioenergetic rates of food consumption (FCR), metabolism (MR), and growth
(GR) can provide insight into magnitude of trophic impacts of AIS (Liao et al. 2005;
Dick et al. 2012). Trophic impact occurs through consumption of food when an invasive
species shares food resources with a native species. The greater the demand for food, the
more likely competition is to occur, as it can only occur when resources are limited.
Greater energy expenditure in a species through higher MR and GR increases FCR and,
thus, trophic impact. As such, analyses of bioenergetic rates can help managers identify
which AIS pose the greatest threat of trophic impact.
History has shown that, in many instances, fish species may be invasive in one
location, but not cause harm in a different location. For example, Yellow Perch have
5
considered a nuisance in that area of the province, yet in other areas across Canada,
Yellow perch are of no concern. Similarly, smallmouth Bass Micropterus dolomieu are
commonly introduced to North American inland waters as a sport fish, but depending on
the recipient ecosystem, effects of introductions can vary. For instance, Smallmouth
Bass and Walleye Sander vitreus may occupy similar habitats and compete for the same
food resources in many lakes (Stewart and Watkinson 2004), but due to a less
discriminant feeding style and higher tolerance for warm water, Smallmouth Bass may
thrive over Walleye in habitats with these features, yet may not do as well in cooler water
(Stewart and Watkinson 2004). Specific case-studies allow for comparison of
bioenergetic rates between invasive and native fish species and can provide insight into
why a species may be considered invasive in one area but not in another. It is expected
invasive fish species characteristically display higher FCR in order to meet higher
energetic demands of MR and GR. Information on FCR, MR, and GR may not exist for
all AIS of concern, but research has indicated these rates can be estimated by analysis of
fish traits.
Using numerous traits and food consumption data of 65 species of fish, Palomares
and Pauly (1998) generated a predictive model to estimate food consumption per unit
biomass (Q/B). One of the traits expected to correlate with Q/B was caudal fin aspect
ratio, which is defined by the formula:
A = h2/s
where A is the aspect ratio, h is the height of the caudal fin, and s is the surface area of
the caudal fin. Work similar to that of Palomares and Pauly may help managers
6
relationships between fish traits and FCR, MR, and GR, predictive models of trophic
impact could be created that meet the criteria of Essington et al. (2001) and Simon and
Townsend (2003): they are inexpensive, efficient, make use of available trait data, and
use generalizations made across large, similar groups. The species analyzed by
Palomares and Pauly (1998) included both marine and freshwater fish species from a
variety of locations. To make predictive models specific to freshwater fish in Canada,
there is a need to compile data for an adequate number of freshwater (or marine and
highly anadromous), north-temperate fish.
RESEARCH PURPOSE AND OBJECTIVES
This research has two main objectives: 1) analyze instances of fish species
invasions, examining the link between high bioenergetic rates (i.e. high trophic impact)
and invasive fish species as a means to demonstrate evidence of importance of trophic
impact assessment to AIS management; and 2) use the findings of the first objective
combined with data on morphometric, physiologic, and ecologic traits to develop risk
assessment tools to predict trophic impact of AIS relative to native species under similar
environmental conditions in Canada.
METHODS TO ESTIMATE CONSUMPTION AND METABOLISM
There are different ways in which FCR and MR in fish can be estimated. Tyler
(1970) found a relationship between gastric evaluation rate and amount of food in
stomachs of young Cod Gadus morhua and suggested evacuation rate may provide
7
food in the stomach as well as rate of gastric evacuation, and similarly, Persson (1982)
calculated evacuation rate in Roach Rutilus rutilus and then used this information in a
model to predict FCR (Elliott and Persson 1978). Storebakken et al. (1999) estimated
evacuation rates of Atlantic Salmon Salmo salar using oxide markers and sieving of fecal
matter, and mass-balance contaminant models (Trudel et al. 2000; Trudel et al. 2001)
have also been used to estimate food intake. Forseth et al. (1992) used a radioisotope
method for estimating FCR in Brown Trout Salmo trutta and found results agreed with
those found using the method of Eggers (1977), although Forseth et al. (1992) stated an
advantage of the radioisotope method over the methods of Eggers (1977) and Elliott and
Persson (1978) was the ability to make estimations for a wider variety of fish species (i.e.
those that consume larger prey).
Similar to FCR, methods of estimating MR are also varied. In addition to
laboratory respirometry measurements, MR can be estimated in situ. In situ
measurements have been performed on fish 3000m below surface levels (Smith 1978),
and Bailey et al. (2002) examined an autonomous fish respirometer claimed capable of
performance at depths to 6000m. Armstrong (1986) provided an equation relating heart
rate to MR of Northern Pike Esox lucius under laboratory conditions and found changes
in heart rates of Northern Pike corresponded well with changes in MRs initiated by
feeding. From this finding, Armstrong (1986) suggested heart rate could also be used to
estimate meal size. Lucas et al. (1991) used heart rate telemetry to measure MRs of
Northern Pike in lochs in Scotland, and they used heart rate measurements obatined to
estimate FCR. Finally, similar to using contaminant analyses to estimate FCR, MR can
8
A drawback of the methods mentioned here to estimate FCR and RMR is the
amount of time needed to conduct each type of study. However, bioenergetic models can
provide estimates of FCR and RMR from physiologic data that has already been
compiled for numerous fish species, allowing researchers to make estimates without
having to conduct new lab or field studies.
BIOENERGETIC MODEL
Bioenergetic models are commonly used in research (Hanson et al. 1997; Liao et
al. 2005) to estimate FCR based on observed growth, or predict potential growth based
on observed FCR. Hanson et al. (1997) provided a review of the Wisconsin Bioenergetic
Model, originally developed by Kitchell et al. (1977) and based on mass-balance
principles, where energy consumed equals energy used.
Consumption = Respiration + Wastes + Growth
The above equation can be further broken down:
FCR = (SMR + A + SDA) + (F + U) + (ΔB+G)
where SMR is standard metabolic rate (often estimated by resting respiratory rate), A is
an activity multiplier to elevate SMR to routine or active levels, SDA is specific dynamic
action (the energy required to absorb and assimilate nutrients from food), F is energy
used in egestion, U is energy used in excretion, ΔB is somatic growth, and G is gonad
production. Mathematical equations exist to estimate FCR, respiration, and wastes based
on relationships between these components and fish weight, diet, and water temperature.
Once these rates have been estimated, growth can be calculated by subtracting energy
9
In general, specific rates of FCR and respiration decrease with fish weight when
temperature is held constant (Figures 1.1 and 1.2). When weight is constant and
temperature varies, FCR and respiration increase to maximum values, then decline
thereafter, with an exception being the exponential form of the temperature-dependent
function for both FCR and respiration (Stewart et al. 1983; Figures 1.3 and 1.4).
Although these general patterns are consistent for all fish, the rates of increase and
decrease, as well as the maximum values and intercepts vary between fish species as well
as between life stages within species. As such, researchers have developed unique
parameter values allowing differentiation of bioenergetic rates between species and life
stages within species. Use of these parameter values has been widespread, facilitated
through the popular Fish Bioenergetics software (Hanson et al. 1997), and evaluation of
parameter values is on-going. For instance, Rice and Cochran(1984) evaluated a
bioenergetics model for Largemouth Bass Micropterus salmoides published a year earlier
(Rice et al. 1983) and found it performed well. Bajer et al. (2003) evaluated performance
of two bioenergetics models (Karas and Thoresson 1992; Hanson et al. 1997) applied to
Yellow Perch and found neither model predicted SMR or growth well. Madenjian et al.
(2006) evaluated performance of a general coregonid bioenergetics model developed by
Rudstam et al. (1994), applying it to Lake Whitefish Coregonus clupeaformis.
Madenjian et al. (2006) found the model overestimated FCR and underestimated growth.
The continued evaluation of bioenergetics models through studies such as those
mentioned here facilitates increased confidence when models are applied to fisheries
management. By comparing estimates of bioenergetic rates between species, researchers
10
the most food. In this way, rates of resource depletion, or trophic impact, can be
predicted for species of concern.
Figure 1.1. Maximum food consumption rate of a Yellow Perch Perca flavescens at 23°C
(Kitchell et al. 1977).
Figure 1.2. Standard metabolic rate of a Yellow Perch Perca flavescens at 23°C (Kitchell
11
Figure 1.3 Maximum food consumption rates of a 50g Lake Trout Salvelinus namaycush
(Stewart et al. 1983), a 50g Yellow Perch Perca flavescens (Kitchell et al. 1977), and a
50g Alewife Alosa pseudoharengus (Stewart and Binkowski 1986).
Figure 1.4. Routine metabolic rates of a 50g Lake Trout Salvelinus namaycush (Stewart
et al. 1983), a 50g Yellow Perch Perca flavescens (Kitchell et al. 1977), and a 50g
Alewife Alosa pseudoharengus (Stewart and Binkowski 1986).
The current research relies most heavily on the respiration component of the
12
fish consumes at various weights and temperatures and at various levels of activity.
Activity of fish may vary from completely resting, to spontaneous bursts, to sustained
swimming, to active. Correspondingly, oxygen consumption rates, or MRs of fish are
classified as either standard (sometimes called resting, SMR), routine (RMR), which can
be used to predict MR of fish in field situations, as it adds spontaneous activity to SMR
(Beamish and Mookherjii 1964), or active, which occurs when fish are exercised
(spawning migrations, pursuit of prey, escape from predators, etc.). Fish are fasted prior
to typical respirometry experiments to limit effects of SDA on MR, so although the
respirometry component of the mass-balance equation includes SDA, Chapter 3 of the
current research does not include effects of this component. However, parameter values
for SDA are very similar among fish species (~15-18% of total metabolic costs) and,
therefore, would not provide much help in differentiating between RMRs.
A drawback of using bioenergetic parameter values to estimate field MR is the
differing conditions between lab and field settings. RMRs also vary from one field
setting to another, as fish in one location may be exposed to different levels of certain
stimuli than the same species of fish in another location. The variety of conditions across
a species’ range would necessitate the need for large amounts of in-situ study to quantify
RMR under various scenarios. Lab settings provide environments where external stimuli
can be controlled, allowing for consistency between studies. However, researchers must
be cognizant of the various factors that may confound MR measures (Brett 1962). The
ability to compare measures from different studies or trials within studies will be
negatively affected if such factors as temperature, salinity, and oxygen content vary, or if
13
instead of determining whole new parameter sets for fish species, researchers borrow
values from similar species, which reduces the opportunity for parameter sets to
adequately demonstrate how species differ in terms of bioenergetic rates. However,
despite these shortcomings, bioenergetic analyses have been important in many fisheries
applications (Hansen et al. 1993; Ney 1993; Ney 1995; Kitchell et al. 2005; Chipps and
Wahl 2008; Hartman and Kitchell 2008).
Using bioenergetic analyses to develop decision support tools is not a new idea.
As previously mentioned, Palomares and Pauly (1998) used multiple regression analyses
to find relationships between fish traits and Q/B to help improve estimates used in trophic
ecosystem modelling. Kolar and Lodge (2002) also developed decision support tools, but
specifically targeted at AIS management. Their work involved using discriminant
analysis and classification tree (CT) analysis to develop tools to predict success at various
stages of invasion for potential invasive fish in the Great Lakes. Similarly,
Mercado-Silva et al. (2006) used CT analysis to predict the spread of Rainbow Smelt Osmerus
mordax in Ontario, Wisconsin, and northern Maine. To develop their tools, Kolar and
Lodge (2002) and Mercado-Silva et al. (2006) relied on case-specific study. Kolar and
Lodge (2002) looked at species already present in the Great Lakes for insight into which
traits may discriminate between success and failure at the establishment and spread stages
of invasion in the area. Mercado-Silver et al. (2006) used data from lakes in southern
Maine containing native populations of Rainbow Smelt to get an idea of habitat
preference. The strength of the research conducted by Kolar and Lodge (2002) was that
it made use of data collected specifically from the area to which the decision support
14
specificity in that locations from which data had been collected were geographically in
close proximity to locations to which the decision-support tool was to be applied. By
using already existing data, both research teams did not have to perform their own
experiments to determine relationships to inform their tools. In ecology, using
case-studies to inform decision-support tools is not only more efficient than conducting new
experiments, but is also necessary in many cases. It simply does not make sense to
purposefully introduce new species to novel ecosystems to help develop decision-support
tools to combat AIS invasion. As well, lab studies lack the complex interactions of
natural systems and, therefore, may not provide accurate estimates of what may take
place in field scenarios. For these reasons, the current research relies on case-specific
studies to meet its first objective (Chapter 2) prior to proceeding to the second objective
15 REFERENCES
Armstrong, J. D. 1986. Heart rate as an indicator of activity, metabolic rate, food intake and digestion in pike, Esox lucius. Journal of Fish Biology 29:207-221.
Bailey, D. M., A. J. Jamieson, P. M. Bagley, M. A. Collins, and I. G. Priede. 2002. Measurement of in situ oxygen consumption of deep-sea fish using an autonomous lander vehicle. Deep Sea Research 1 49(8):1519-1529.
Bajer, P. G., G. W. Whitledge, R. S. Hayward, and R. D. Zweifel. 2003. Laboratory evaluation of two bioenergetics models applied to Yellow Perch: identification of a major source of systematic error. Journal of Fish Biology 62:436-454.
Beamish, F. W. H., and P. S. Mookherjii. 1964. Respiration of fishes with special emphasis on standard oxygen consumption: I. influence of weight and
temperature on respiration of Goldfish, Carassius auratus L. Canadian Journal of Zoology 42:161-175.
Brandt, S. B., D. M. Mason, D. B. Macneill, T. Coates, and J. E. Gannon. 1987. Predation by Alewives on larvae of Yellow Perch in Lake Ontario. Transactions of the American Fisheries Society 116:641-645.
Brett, J. R. 1962. Some considerations in the study of respiratory metabolism in fish, particularly Salmon. Journal of the Fisheries Research Board of Canada 19:1025-1038.
Brown, T. G., B. Runciman, M. J. Bradford, and S. Pollard. 2009. A biological synopsis of Yellow Perch (Perca flavescens). Canadian Manuscript Report of Fisheries and Aquatic Sciences 2883.
Canadian Council of Fisheries and Aquaculture Ministers (CCFAM) Aquatic Invasive Species Task Group. 2004. A Canadian action plan to address the threat of aquatic invasive species. Available: http://www.dfo-mpo.gc.ca/science/environmental-environnement/ais-eae/plan/plan-eng.htm. (May 2015).
Chipps, S. R., and D. H. Wahl. Bioenergetics modeling in the 21st century: reviewing new insights and revisiting old constraints. Transactions of the American Fisheries Society 137:298-313.
Clavero, M., and E. Garcia-Berthou. 2005. Invasive species are a leading cause of animal extinctions. Trends in Ecology and Evolution 20:110.
16
Dawson, M. 2002. Plant quarantine: a tool for preventing the introduction and spread of alien species harmful to plants. Alien invaders in Canada’s waters, wetlands and forests. Canadian Forest Service, Ottawa, ON.
Dick, J. T. A., K. Gallagher, S. Avlijas, H. C. Clarke, S. E. Lewis, S. Leung, D. Minchin, J. Caffrey, M. E. Alexander, C. Maguire, C. Harrod, N. Reid, N. R. Haddaway, K. D. Farnsworth, M. Penk, and A. Ricciardi. 2012. Ecological impacts of an
invasive predator explained and predicted by comparative functional responses. Biological Invasions 15:837-846.
Eggers, D. M. 1977. Factors in interpreting data obtained by diel sampling of fish stomachs. Journal of the Fisheries Board of Canada 34:290-294.
Elliott, J. M., and L. Persson. 1978. The estimation of daily rates of food consumption for fish. The Journal of Animal Ecology 47:977-991.
Essington, T. E., J. F. Kitchell, and C. J. Walters. 2001. The von Bertalanffy growth function, bioenergetic, and the consumption rates of fish. Canadian Journal of Fisheries and Aquatic Sciences 58:2129-2138.
Forseth, T., B. Jonsson, R. Næumann, and O. Ugedal. 1992. Radioisotope method for estimating food consumption by Brown Trout (Salmo trutta). Canadian Journal of Fisheries and Aquatic Sciences 49:1328-1335.
Hansen, M. J., D. Boisclair, S. B. Brandt, S. W. Hewett, J. F. Kitchell, M. C. Lucas, and J. J. Ney. 1993. Applications of bioenergetic models to fish ecology and
management: where do we go from here? Transactions of the American Fisheries Society 122:1019-1030.
Hanson, P. C., T. B. Johnson, D. E. Schindler, and J. F. Kitchell. 1997. Fish bioenergetic 3.0. University of Wisconsin, Center for Limnology, WISCU-T-97–001,
Madison.
Hartman, K. J., and J. F. Kitchell. Bioenergetics modeling: progress since the 1992 symposium. Transactions of the American Fisheries Society 137:216-223.
Honeyfield D. C., J. P. Hinterkopf, J. D. Fitzsimons, D. E. Tillitt, J. L. Zajicek, and S. B. Brown. 2005. Development of thiamine deficiencies and early mortality
syndrome in Lake Trout by feeding experimental and feral fish diets containing thiaminase. Journal of Aquatic Animal Health 17:4-12.
17
Ketola, H. G., P. R. Bowser, G. A. Wooster, L. R. Wedge, and S. S. Hurst. 2000. Effects of thiamine on reproduction of Atlantic Salmon and a new hypothesis for their extirpation in Lake Ontario. Transactions of the American Fisheries Society 129:607-612.
Kitchell, J. F., D. J. Stewart, and D. Weininger. 1977. Application of a bioenergetic model to Yellow Perch (Perca flavescens) and Walleye (Stizostedion vitreum vitreum). Journal of the Fisheries Research Board of Canada 34:1922-1935.
Kolar, C. S., and D. M. Lodge. 2002. Ecological predictions and risk assessment for alien fishes in North America. Science 5596:1233-1235.
Krueger, C. C., D. L. Perkins, E. L. Mills, and J. E. Marsden. 1995. Predation by Alewives on Lake Trout fry in Lake Ontario: role of an exotic species in preventing restoration of a native species. Journal of Great Lakes Research 21:458-469.
Lenzen, M., D. Moran, K. Kanemoto, B. Foran, L. Lobefaro, and A. Geschke. 2012. International trade drives biodiversity threats in developing nations. Nature 486:109-112.
Leprieur, F., O. Beauchard, S. Blanchet, T. Oberdorff, and S. Brosse. 2008. Fish invasions in the world’s river systems: when natural processes are blurred by human activities. PLoS Biology 6:404-410.
Liao, H., C. L. Pierce, and J. G. Larscheid. 2005. An empirical model for estimating annual consumption by freshwater fish populations. North American Journal of Fisheries Management 25:525-532.
Lucas, M. C., I. G. Priede, J. D. Armstrong, A. N. Z. Gindy, and L. Vera. 1991. Direct measurements of metabolism, activity and feeding behaviour of pike, Esox lucius
L., in the wild, by the use of heart rate telemetry. Journal of Fish Biology 39:325-345.
Madenjian, C. P., D. V. O'Connor, S. A. Pothoven, P. J. Schneeberger, R. R. Rediske, J. P. O'Keefe, R. A. Bergstedt, R. L. Argyle, and S. B. Brandt. 2006. Evaluation of a Lake Whitefish bioenergetics model. Transactions of the American Fisheries Society 135:61-75.
Madenjian, C. P., R. O’Gorman, D. B. Bunnell, R. L. Argyle, E. F. Roseman, and D. M. Warner. 2008. Adverse effects of Alewives on Laurentian Great Lakes fish communities. North American Journal of Fisheries Management 28:263-282.
18
Marklevitz, S. A. C., B. J. Fryer, D. Gonder, Z. P. Yang, J. Johnson, A. Moerke, and Y. E. Morbey. 2011. Use of otolith chemistry to discriminate juvenile Chinook Salmon (Oncorhynchus tshawytscha) from different wild populations and hatcheries in Lake Huron. Journal of Great Lakes Research 37:698-706.
Mercado-Silva, N., J. D. Olden, J. T. Maxted, T. R. Hrabik, and M. J. V. Zanden. Forecasting the spread of invasive Rainbow Smelt in the Laurentian Great Lakes region of North America. Conservation Biology 20:1740-1749.
Murry, B. A., M. J. Connerton, R. O’Gorman, D. J. Stewart, and N. H. Ringler. 2010. Lakewide estimates of Alewife biomass and Chinook Salmon abundance and consumption in Lake Ontario, 1989-2005: implications for prey fish
sustainability. Transactions of the American Fisheries Society 139:223-240.
Ney, J. J. Bioenergetics modeling today: growing pains on the cutting edge. Transactions of the American Fisheries Society 122:736-748.
Palomares, M. L. D., and D. Pauly. 1998. Predicting food consumption of fish
populations as functions of mortality, food type, morphometrics, temperature and salinity. Marine and Freshwater Research 49:447-453.
Persson, L. 1982. Rate of food evacuation in Roach (Rutilus rutilus) in relation to temperature, and the application of evacuation rate estimates for studies on the rate of food consumption. Freshwater Biology 12:203-210.
Primentel, D., L. Lach, R. Zuniga, and D. Morrison. 2000. Environmental and economic costs of non-native species in the United States. Bioscience 50:53-65.
Ricciardi, A. 2006. Patterns of invasion in the Laurentian Great Lakes in relation to changes in vector activity. Diversity and distributions 12:425-433.
Ricciardi, A., and J. Cohen. 2007. The invasiveness of an introduced species does not predict its impact. Biological Invasions 9:309-315.
Rice, J. A., J. E. Breck, S. M. Bartell, and J. F. Kitchell. 1983. Evaluating the constraints of temperature, activity and consumption on growth of Largemouth Bass.
Environmental Biology of Fishes 9:263-275.
Rice, J. A., and P. A. Cochran. 1984. Independent evaluation of a bioenergetics model for Largemouth Bass. Ecology 65:732-739.
19
Ruiz, G. M., P. Fofonoff , A. H. Hines, and E. D. Grosholz. 1999. Non-native species as stressors in estuarine and marine communities: assessing invasion impacts and interactions. Limnology and Oceanography 44:950-972.
Simon, K. S., and C. R. Townsend. 2003. Impacts of freshwater invaders at different levels of ecological organisation, with emphasis on Salmonids and ecosystem consequences. Freshwater Biology 48:982-994.
Smith, K. L. 1978. Metabolism of the abyssopelagic Rattail Coryphaenoides armatus
measured in situ. Nature 274:362-364.
Smith B. R., and J. J. Tibbles. 1980. Sea Lamprey (Petromyzon marinus) in Lakes Huron, Michigan, and Superior: history of invasion and control, 1936-78. Canadian Journal of Fisheries and Aquatic Sciences 37:1780-1801.
Stewart, D. J., and F. P. Binkowski. 1986. Dynamics of food conversion by Lake Michigan Alewives: an energetics-modeling synthesis. Transactions of the American Fisheries Society 115:643-661.
Stewart, K. W., and D. A. Watkinson. 2004. The freshwater fishes of Manitoba. University of Manitoba Press, Winnipeg, Manitoba.
Stewart, D. J., D. Weininger, D. V. Rottiers, and T. A. Edsall. 1983. An energetics model for Lake Trout, Salvelinus namaycush: application to the Lake Michigan
population. Canadian Journal of Fisheries and Aquatic Sciences 40:681-698.
Storebakken, T., I. S. Kvien, K. D. Shearer, B. Grisdale-Helland, and S. J. Helland. 1999. Estimation of gastrointestinal evacuation rate in Atlantic Salmon (Salmo salar) using inert markers and collection of faeces by sieving: evacuation of diets with fish meal, soybean meal or bacterial meal. Aquaculture 172:291-299.
Trudel, M., A. Tremblay, R. Schetagne, and J. B. Rasmussen. 2000. Estimating food consumption rates of fish using a mercury mass balance model. Canadian Journal of Fisheries and Aquatic Sciences 57:414-428.
Trudel, M., A. Tremblay, R. Schetagne, and J. B. Rasmussen. 2001. Why are dwarf fish so small? An energetic analysis of polymorphism in Lake Whitefish (Coregonus
clupeaformis). Canadian Journal of Fisheries and Aquatic Sciences 58:394-405.
Tyler, A. V. 1970. Rates of gastric emptying in young cod. Journal of the Fisheries Board of Canada 27:1177-1189.
20
Wilcove, D. S., D. Rothstein, J. Bubow, A. Phillips, and E. Losos. 1998. Quantifying threats to imperilled species in the United States. Bioscience 48:607-615.
21
CHAPTER 21
TROPHIC IMPACT COMPARISONS BETWEEN CO-EXISTING INVASIVE AND
NATIVE FISH SPECIES
INTRODUCTION
Canada is vulnerable to introductions of aquatic invasive species (AIS) because of
the country’s long coastline and numerous aquatic environments. Such characteristics
make the detection and management of AIS within the country a top priority (CCFAM
Aquatic Invasive Species Task Group 2004). Collectively, AIS cost the Canadian
economy between $7.5 and $35 billion annually (Dawson 2002; Colautti et al. 2006).
Research indicates approximately three AIS become established in Canada’s coastal or
inland waters every two years (Ricciardi 2006), and although some do not contribute
much to resource declines, others have had significant impacts.
Analyzing invaded habitats and the resident biota is essential in AIS management
(Olden et al. 2006). Some non-native fish may have an impact in one area, but may be of
no concern relative to other species in another location where species composition and/or
habitat (climate, substrate, temperature) is different. An example of this dichotomy is
invasive Yellow Perch Perca flavescens in southern British Columbia (BC). Yellow
Perch are common to many areas of North America (Scott and Crossman 1973), where
they are typically thought of as an innocuous representative of the ecosystem within
1 I hereby declare this chapter incorporates material thatis a result of joint research, as follows:
22
which they exist. After a history including both legal and illegal introductions (Brown et
al. 2009; Runciman and Leaf 2009), Yellow Perch are now a management concern in
southern BC. Introductions of Yellow Perch have been shown to affect growth and
feeding habits of some salmonid species (Fraser 1978), hence efforts are now underway
to reduce impact on important salmonid fisheries. Invasive Rainbow Smelt Osmerus
mordax in various North American waters has also attracted management attention.
Evans and Loftus (1987) suggested Rainbow Smelt may have harmful, neutral, or even
beneficial effects on other species in the Laurentian Great Lakes region (hereafter
referred to as the Great Lakes). Rainbow Smelt are a significant prey of Walleye Sander
vitreus and Sauger Sander canadensis in Lake Winnipeg, but may cause increases in
mercury content and reduced eating quality in such predatory fish (Stewart and
Watkinson 2004). As well, Rainbow Smelt have been shown to prey on young of, as
well as compete with other fish species (Loftus and Hulsman 1986; Hrabik et al. 1998;
Hrabik et al. 2001).
The Great Lakes themselves provide an excellent opportunity to study effects of
numerous AIS due to a long history of introductions, including both intentional and
unintentional activities (Mills et al. 1994). Over the past two centuries, over 25
non-native species have been introduced to the Great Lakes (Mills et al. 1993; Ricciardi 2006;
US Environmental Protection Agency 2011). Within these waters, introductions have
been both harmful and beneficial. Perhaps the most famous harmful introductions
include Sea Lamprey Petromyzon marinus, which has parasitized economically important
species in the Great Lakes, and dreissenid mussels (Zebra Mussels Dreissena polymorpha
23
1995), altered benthic invertebrate communities (Botts et al. 1996), increased mortality of
native mussels (Haag et al. 1993), and biofouled drinking water- and hydro-electric
facilities (Connelly et al. 2007). Beneficial introductions include those related to sport
fishing, and although there is no doubt sport fish have some impact on ecosystem
functioning, the economic value associated with these introduced species has been
welcomed. Sport fishing in the Great Lakes is valued at $7 billion annually (American
Sport Fishing Association 2008; Dettmers et al. 2012), and many of the salmonid species
angled for are non-native, such as Chinook Salmon Oncorhynchus tshawytscha, Coho
Salmon Oncorhynchus kisutch, Rainbow Trout Oncorhynchus mykiss, Pink Salmon
Oncorhynchus gorbuscha, Sockeye Salmon Oncorhynchus nerka, Atlantic Salmon Salmo
salar, and Brown Trout Salmo trutta. The range of impact, including differing
perspectives from different user groups (Dettmers et al. 2012), highlights the complexity
of AIS management, helping to explain why it is difficult to predict which species may be
beneficial or have no significant impacts, and which may cause harm.
Ecological impact of AIS can take many forms: physical alteration of structure
(Connelly et al. 2007), shifts in chemical processes (Heath et al. 1995), increases in
mortality through predation (Sepulveda et al. 2013) or fouling (Haag et al. 1993), and/or
trophic impact (Wilson et al. 2004) which is the focus of this research. Trophic impact
can be assessed through analysis of food consumption rate (FCR; Liao et al. 2005; Dick
et al. 2012), as species that consume more food relative to others will deplete resources
more quickly. Reduction in populations of co-habiting species can lead to alterations in
energy pathways, including trophic cascades (Simon and Townsend 2003). Bioenergetic
24
popular approach to estimate the energetic requirements of fishes. The mass-balance
approach explores the difference between gains through FCR and the energetic costs of
metabolism and wastes under specified growth and thermal conditions; gains in excess of
costs are available for growth.
Consumption = Metabolism + Wastes + Growth
Metabolism is expressed as routine metabolic rate (RMR) which consists of the
standard metabolic rate for a resting fish and an activity multiplier to account for normal
spontaneous activity (Beamish and Mookherjii 1964). Specific dynamic action (SDA), or
the cost of digesting and assimilating food, is also considered part of the metabolic cost.
Wastes include egestion and excretion, while growth considers both somatic and gonadal
production. Brett and Groves (1979) found that approximately 37-44% of ingested
energy is used for metabolism, 27-43% is used for egestion and excretion, and 20-29% is
available for growth. Therefore, understanding one or more of the bioenergetic processes
of food consumption, metabolic rate, or growth may provide an approximation of the
trophic impact of a species.
The hypothesis of the current research is that energetic rates, and therefore trophic
impact, will be higher in invasive compared to native fish species. This hypothesis was
tested using bioenergetic principles in two ways: 1) provide and compare measures of
FCR, RMR, and GR of invasive and co-existing native fish species based on actual
scenarios, and 2) summarize actual scenarios that evaluated one or more of FCR, RMR,
and/or GR in invasive compared to co-existing native fish species. To differentiate
25
termed histories”, while studies used in the second objective were termed
“case-studies”.
METHODS
Bioenergetic rates for a species can vary greatly from one location to another in
response to environmental variables such as temperature, water current, amount of habitat
available for hiding from predators, interactions with other species, abundances and types
of prey, etc. For instance, reduced growth occurs in species such as Northern Pike Esox
lucius (Margenau et al. 1998), Yellow Perch (Heath and Roff 1996), and Coho Salmon
(Rosenfeld 2005) in areas where these species exist in high densities and/or feed on
nutritionally poor food. As well, oxygen consumption rate is typically elevated in fish
inhabiting streams as opposed to calm water (Clausen 1936). As such, the current
research uses case-specific scenarios and generally does not make comparisons between
bioenergetic rates of species across scenarios.
For the first objective, literature was reviewed for scenarios in which invasive and
native fish species demonstrated trophic overlap (i.e. shared food resources).
Bioenergetic rates for each species were determined using four pieces of information
upon which energy use in a species depends: 1) species weight, 2) water temperature, 3)
species diet including prey energy densities, and 4) predator energy density. Allometric
principles (Peters 1983) reveal that FCR and RMR decrease with increasing body size
(Kleiber 1932; Hanson et al. 1997). Additionally, thermodynamic principles suggest
FCR and RMR increase with increasing temperature up to the species-specific
26
Gillooly et al. 2001). The nutritional composition of a species’ diet can cause large
differences in GR potential between two separate species, although in the current
research this component was expected not to account for much difference since a
requirement of scenarios analyzed was evidence of trophic overlap. Lastly, energy
density of the species is used to convert growth from units of energy (J • g fish-1 • d-1) to
units of mass (g fish mass • day-1). Body weight of each species was set based on
information provided by the case-histories examined. Water temperatures were either
based on the temperatures provided by the case-histories, or in the absence of temperature
information, was set to the average final temperature preferendum (FTP) of the invasive
and native species examined. Diet of each species was based on information provided by
the case-histories, and prey and predator energy densities were obtained from literature.
The first bioenergetic rate calculated for each species was FCR. For simplicity, it
was assumed the maximum proportion of food consumption was being met in each
scenario (i.e. bioenergetics p = 1), meaning no environmental factors were assumed to be
limiting FCR other than water temperature. This assumption made for conservative
estimates of differences between bioenergetic rates, since in scenarios involving
competition, resources are limiting and, thus, the negatively affected (i.e. non-invasive)
species should demonstrate reduced FCR. FCR was expressed as g food • g fish-1 • d-1
for graphical display, but needed to be converted to J • g fish-1 • d-1 for later use in the
calculation of GR. Conversion from the former to the later units was achieved by
multiplying FCR by prey energy density (J • g prey-1). RMR, including SDA and
activity, was similarly expressed in units of g O2 • g fish-1 • d-1 for graphical display, but
27
achieved by multiplying RMR by the oxy caloric coefficient of 13,562 J • g oxygen-1.
Energy used in egestion and excretion was converted from g waste • g fish-1 • d-1 to J • g
fish-1 • d-1, again for later use in calculating GR, by multiplying by prey energy density.
Lastly, GR was calculated by subtracting energy allocated to RMR and wastes from FCR.
GR was then converted to g fish mass • g fish-1 • d-1 to standardize for differences in body
mass among species.
Similar to the first objective, for objective 2, literature was reviewed for scenarios
in which invasive and native fish species demonstrated trophic overlap (i.e. shared food
resources). However, instead of calculating bioenergetic rates, the scenarios were simply
searched for some form of evaluation of FCR, RMR, or GR in the invasive and native
fish species.
The literature search conducted increased awareness of how difficult a task it is to
find either 1) studies providing evidence of substantial trophic overlap between native
and invasive fish species as well as providing enough information to estimate FCR, RMR
and GR in the case of case-histories, or 2) studies providing evidence of substantial
trophic overlap between native and invasive fish species and simply providing some form
of evaluation of bioenergetic rates in both species groups. Quantification of the number
of useful versus non-useful studies encountered in the current research would help
convey the tedious nature of this sort of research, thereby supporting suggestions
concerning improvements that could be made to studies examining interactions between
native and invasive fish species. Since the literature search performed in the current
research was not documented, a follow-up search comprised of three parts was performed
28
third part was targeted at a specific lake. This species- and lake-specific strategy was
beneficial in two regards: 1) it helped maintain consistency between the initial search and
the follow-up search, as species- and lake-specific keywords were common in the initial
search, and 2) it helped increase efficiency of the follow-up search process, which was
important because significant amounts of time had already been spent reviewing studies
during the initial search. Efficiency was further enhanced by filtering follow-up searches
using the “Fisheries” and “Marine and freshwater biology” search areas as well as the
“article” document type in the Web of Science interface. Follow-up searches also only
targeted studies published from 1980 onward. 1980 was chosen as the cut-off year
because none of the six studies used in the current research (that were found during the
initial search) were published prior to 1984. Further, to ensure follow-up searches used
keywords well-suited to the goals of the initial search, care was taken to use keywords
common to two or more of the six studies.
Consistent with attempts made during the initial search, the first part of the
follow-up search was specifically targeted at Yellow Perch due to reasons provided in the
Introduction section of the current research (i.e. they are native and considered innocuous
in many areas of Canada, but considered invasive in southern BC), and the second part of
the follow-up search was specifically targeted at carp because of the significant
popularity of this group in North America. Also consistent with attempts made during
the initial search, the third part of the follow-up search was specifically targeted at Lake
Michigan. Lake Michigan was chosen because it is a great study site for examination of
interactions between invasive and native fish species due to its long history of invasions