ABSTRACT
JORDAN, KELLY NICOLE. Evaluating Division I Collegiate Academic Support Programs: The Student Athletes’ Perceptions. (Under the direction of Judy Peel.)
BIOGRAPHY
ACKNOWLEGEMENTS
TABLE OF CONTENTS
Page
LIST OF TABLES . . . v
LIST OF FIGURES . . . vi
Evaluating Division I Collegiate Academic Support Programs for Student Athletes Review of the Literature. . . .. . . 1
Methods. . . 4
Sample . . . . . . 4
Instrumentation. . . 4
Data Collection. . . 5
Statistics. . . 8
Models. . . 9
Results . . . 9
Conclusions. . . 12
References . . . 16
APPENDICES . . . 17
List of Tables
Table 1.1 Student Athletes’ Grade Point Averages . . . 9 Table 2.1 Significant Partial Correlations Between
GPA and Academic Support Variables . .. . . 10 Table 2.2 The Academic Support Variables With Significant
LIST OF FIGURES
Figure 1.1 Student Athletes’ Sports . . . 7 Figure 1.2 Student Athlete Classification . . . 8
Review of the Literature
The marriage of college athletics and academics has been referred to as “American higher education’s peculiar institution” because of the difficulty student athletes have had balancing all aspects of their young adults lives (Howard-Hamilton & Sina, 2001, p. 39). Expected to report to school early for preseason, practice before and after class, and play in weeknight games, student athletes have devoted a great deal of time to their sport leaving very little time to focus on academics (Saxon, 1999). In 1983, American universities started incorporating academic support programs designed to assist student athletes in academic, personal, and career development through academic counseling and other programs (Saunches, 2000). The primary purpose for Academic Support Programs was to help student athletes not only maintain academic eligibility, but also successfully graduate from their universities.
Academic support coordinators facilitated orientation and transitional programs to address the unique needs of college student athletes (Pope & Miller, 1996). Specific seminars on nutrition, gambling, drug and alcohol abuse, study skills, and note-taking were developed to help the student athletes make positive decisions in a wide variety of areas that affect their lives (Naughton, 1997).
been unsuccessful in the classroom because they were not mature enough to utilize the full spectrum of academic services available (Spurgeon, French, & Keith, 1991).
A review of the literature revealed that though incongruence between student athletes academic and athletic performance existed, there was not a uniform way to evaluate the services and programs academic support provided (Baldwin, 1999; Lucas and Lovaglia, 1998; Pope & Miller, 1999; Howard-Hamilton & Sina, 2001). Several academic support programs including San Diego State University, the University of Southern California, the University of Virginia, Clemson University, the University of North Carolina at Chapel Hill, and NC State University did not have an annual, written evaluation of academic services for student athletes (Gumble, 2004; Shahawey, 2004; Jimenez, 2004; Grayson, 2004; & Mercer, 2004). Though some of these universities were working on developing assessments, an instrument was not in place.
According to Theobald (1979, p.19), by using evaluation methods, educational institutions would be able to “measure the effects their programs have against the goals it sets out to accomplish as a means of contributing to subsequent decision making about the program and improving future programming.” The evaluation process is extremely important because the research and data is only as good as the tool and the respondents’ willingness to be truthful and open (Tasci & Knutson, 2003).
1. A significant correlation exists between the advising, tutorial, computing, study hall, and career services provided by the NC State University Academic Support Program for Student Athletes and the academic success of the student athletes.
Both the Academic Support Program for Student Athletes and the student athletes should benefit from this study. With increasing eligibility requirements enforced by the National Collegiate Athletic Association, the NCAA, academic support program directors are under pressure to provide services that will increase the student athletes’ academic success and lead to graduation. An annual evaluation of the student athletes’ perceptions would allow academic support program directors to assess the success of the programs and services as well as make adjustments for the following year.
Evaluation of academic support programs is also valuable because of documentation. Documentation of program effectiveness over time would allow academic support staff to gain leverage when promoting their services. The results could be used to request budget increases, improve facilities, and receive more equipment that would benefit the student athletes’ academic success.
Methods
Sample
Of the 562 student athletes at NC State University, 229, or 40.7%, completed the Student Athlete Academic Support Evaluation Instrument (see Appendix A.). NC State University was chosen because it is a division I university and has an academic support staff and tutorial program for the student athletes. NC State University also has competitive football, men’s basketball, and women’s basketball teams, which have been hallmark sports for division I schools. Traditionally, hallmark sports have had student athletes that are the most academically challenged.
Instrumentation
The Student Athlete Academic Support Evaluation Instrument, SAASEI, was developed using items from three existing surveys used to garner student athletes’ perceptions of academic services. These surveys included exit interviews used by Clemson University and University of North Carolina at Chapel Hill and an Academic Support Program for Student Athletes Expectation and Satisfaction Survey created by NC State University’s Office of Planning and Analysis (Zelna, 2004). The Expectation and Satisfaction Survey revealed the NC State student athletes’ expectations of the Academic Support Program for Student Athletes and how well their expectations were being met.
as establishing contacts with respondents who are very active (Cho & LaRose, 1999). With the online survey, student athletes were reached anywhere they had computer access and paper, pencils, and human error in data entry were eliminated (Tasci & Knutson, 2003).
The SAASEI had six content areas including advising, tutoring, computing facilities, study hall, career services, and demographics. A four point likert scale of
agree, somewhat agree, somewhat disagree, and disagree was used and the option to respond with didn’t use was also provided for certain sections of the survey. The survey consisted of 41 items. Thirty-nine items had scores ranging from four to one corresponding to the above categories and didn’t use received a missing value in the STATA software package that calculated the statistics. Certain demographic items including classification and cumulative grade point average were indicated using free response.
The reliability of the SAASEI was determined using the reliability coefficient Cronbach’s alpha. The reliability coefficient for the SAASEI was 0.85. A reliability coefficient between 0.6 and 0.8 is considered highly reliable, so the data gathered by the SAASEI had a high degree of internal reliability (Mitra and Lankford, 1999). Since a convenience sample was used, the results were not generalizable to student athletes who did not complete the survey, but high internal validity existed.
Data Collection
using two methods. The first method involved scheduling short team meetings where the student athletes sat at a computer and completed the Student Athlete Academic Support Evaluation Instrument. In order to access the survey questions, the student athletes had to read and agree to a consent form that appeared on the screen. Each student athlete completed the SAASEI at a separate computer and left once the “successful submission” page appeared on the screen. This process was repeated for eleven out of the thirteen teams.
The second method involved the women’s gymnastics team and track team members each receiving typed directions distributed by their coaches describing how to access the SAASEI and submit it online. The gymnasts and track team members completed the surveys independently at computers located both on and off campus. Each team had a week to complete the surveys before the data was collected. This method was used because neither team could hold a team meeting in a computer lab due to the nature of their competition schedule. Neither method involved pre-selection of student athletes, making this a convenience sample.
men’s and women’s soccer, fourteen were from softball, twenty-four were from men’s and women’s swimming, twenty-one were from men’s and women’s tennis, thirteen were from track, ten were from women’s volleyball, and nineteen were from wrestling (see
Figure 1.1).
Figure 1.1 Student Athletes' Sports
0 5 10 15 20 25 30 35 40 45 B a sebal l B a sket b al l Foot bal l G y m nast ics Go lf Ri
fle Soccer
S o ftbal l S w immi n g Te nni s Tr ack/ Fi el d V o lle y b a ll W re s tlin g Sport N u m b er of S tu d en t A thl et es
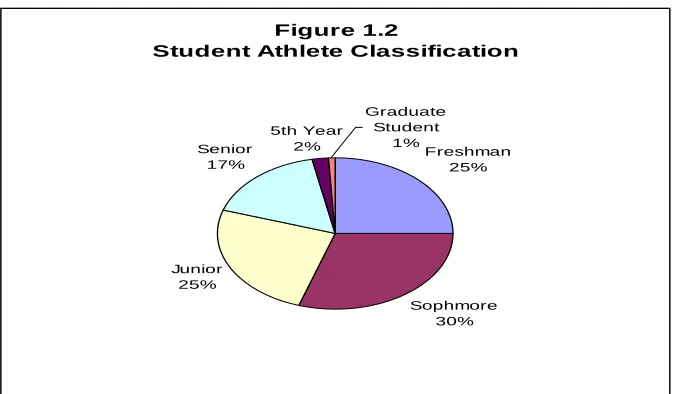
Of the 224 who revealed their classification, 25% were freshmen, 30% were
sophomores, 25% were juniors, 17% were seniors, just over 2% were in their fifth year,
and less than 1% were in graduate school (see Figure 1.2). The data from each team was
saved in a database upon successful submission. Back-up data was sent anonymously to
an email account with an alias sender attached in order to maintain the student athletes’
Figure 1.2
Student Athlete Classification
Freshman 25% Sophmore 30% Junior 25% Senior 17% 5th Year 2% Graduate Student 1% Statistics
The hypothesis was tested using partial correlation measurements of the student athletes’ grade point averages, GPA’s, compared to each survey item to show which services had a significant (p< 0.05) relationship to academic success. No specific GPA was determined to be successful, instead the partial correlation revealed which academic support services had a significant positive correlation with the student athletes’ overall grade point averages and which services had a significant negative correlation (Agresti & Finlay, 1986).
Models
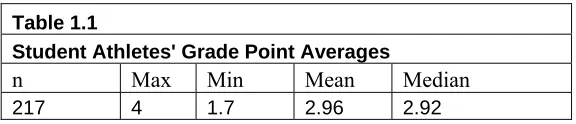
The model GPA= f(Support Services) was used to uncover what proportion of the variation in the student athletes’ academic success that was explained by the academic support services (Agresti & Finlay, 1986). Academic success, therefore, was measured on a continuum, not by a specific grade point average. The summary of the student athletes’ GPA’s was displayed in Table 1.1.
Table 1.1 Student Athletes' Grade Point Averages
n Max Min Mean Median
217 4 1.7 2.96 2.92
Note: Numbers reflect the respondents to the SAASEI.
The model for Somer’s D, dy.x= (C-D)/ [n(n-1)/2-Tx], was used to show the positive and negative correlations between the student athletes’ GPA’s and their responses to the academic support factors. The C and D referred to the concordant and discordant pairs. Concordant pairs occurred when the student athletes’ GPA’s ranked near the same level as their response to the academic support factor. A pair is discordant when either the GPA or the response to the academic support factor was ranked lower than the other (1986). The n referred to the number of student athletes’ measured in the each calculation. Tau-b, the geometric average between the student athletes’ GPA’s and their responses to the academic support factors, was the T value (1986).
Results
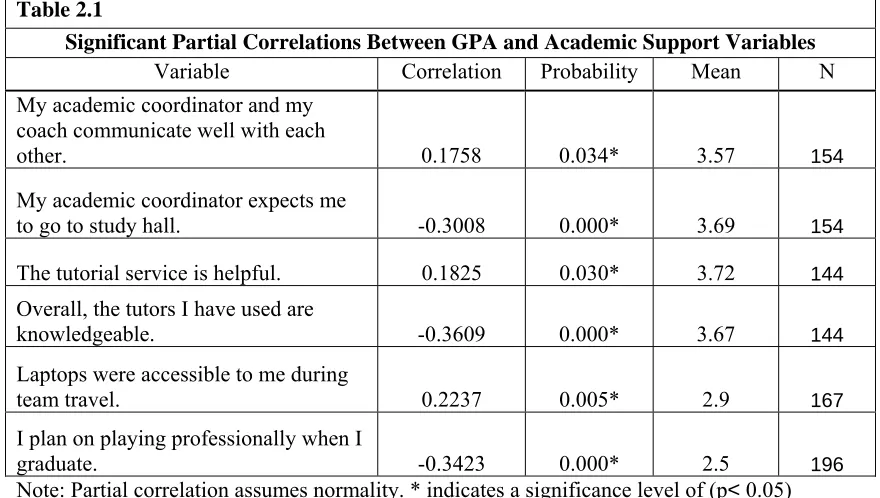
the academic coordinator and coach (ρ=0.1758), the helpfulness of the tutorial program (ρ= 0.1825), and the accessibility of laptops during team travel (ρ=0.2237) were significantly associated with an increase in the student athletes’ academic success. In other words, the respondents that agreed with these specific characteristics of the Academic Support Program for Student Athletes had significantly higher academic success than those who disagreed with the item.
Table 2.1
Significant Partial Correlations Between GPA and Academic Support Variables
Variable Correlation Probability Mean N
My academic coordinator and my coach communicate well with each
other. 0.1758 0.034* 3.57 154
My academic coordinator expects me
to go to study hall. -0.3008 0.000* 3.69 154
The tutorial service is helpful. 0.1825 0.030* 3.72 144
Overall, the tutors I have used are
knowledgeable. -0.3609 0.000* 3.67 144
Laptops were accessible to me during
team travel. 0.2237 0.005* 2.9 167
I plan on playing professionally when I
graduate. -0.3423 0.000* 2.5 196
Note: Partial correlation assumes normality. * indicates a significance level of (p< 0.05)
The partial correlation results also indicated that the expectation that the student athletes attended study hall (ρ= -0.3008), knowledgeable tutors (ρ= -0.3609), and the expectation of becoming a professional athlete (ρ= -0.3423) were significantly associated with a decrease in the student athletes’ academic success. In other words, student athletes who agreed with these items had a significantly lower academic success.
but by also showing the strength and direction of the association. Displayed in Table 2.2, the expectation that student athletes attend study hall (τ= -0.096431) was negatively associated with the student athlete’s academic success. In fact, the rate of academic success was 9.6% lower for the student athletes who were expected to attend study hall. Study hall participation (τ= -0.065038) was also negatively associated with academic success. Participation in study hall was associated with a 6.5% lower academic success rate. Student athletes with a high grade point average were often not expected to go to study hall. Only those with low academic success rates, GPA’s, were expected to attend and each team at NC State has its own GPA requirement for study hall attendance.
Knowledgeable tutors (τ= -0.151761) did not increase the academic success of the respondents. Though 70% of the respondents agreed that their tutors were knowledgeable, this was associated with 15.2% lower academic success rates. This result, similar to the study hall statistics, showed that perhaps the student athletes had tutors because of their academic weaknesses. A pre and post test study on study hall and tutorial support would better identify the effectiveness of those services.
associated with student athletes whose academic success rates were 10% below their peers.
The final survey item, expectation of playing professionally upon graduation (τ=
-0.239749), was significantly associated with the student athletes whose academic success rate was 24% lower than those who did not expect to play professionally. This was the most noteworthy finding since literature points to motivation as a common reason why student athletes have not excelled academically; they expected to play professionally and may not have cared as much about academic success.
Table 2.2
The Academic Support Variables With Significant Influence on Academic Success
Variable Coefficient
Standard
Error Probability z value My academic coordinator expects me to
go to study hall. -0.096431 0.0395212 0.015* -2.44 Overall, the tutors I have used are
knowledgeable. -0.151761 0.0449806 0.001* -3.37
The computers were dependable. -0.136725 0.0460273 0.003* -2.97 I have visited the Career Center located
on campus. -0.100472 0.0440721 0.023* -2.28
I plan on playing professionally when I
graduate. -0.239749 0.0414911 0.00* -5.78
Note: Somer's D does not assume normality. * indicates a significance level of (p< 0.05)
Conclusions
The negative correlations found between study hall participation, knowledgeable tutors, and the use of tutorial services should be researched further using a pre and post test model as indicated earlier.
The most interesting statistic was the percentage of student athletes who expected to play professionally upon graduation. Out of the 216 student athletes who responded to the question, 79 (36.57%) agreed that they planned on playing professionally after college. Another 52 (24.7%) respondents either somewhat agreed or somewhat disagreed with the statement. The student athletes who reported their plans to play professionally had significantly lower academic success than those who did not plan on playing professionally. This conclusion should be studied further if a large percentage of student athletes at other universities expect to play professionally. Education of the actual number of student athletes that will actually go pro may be necessary. It is important not to dissuade student athletes from pursuing their dreams, but student athletes should be aware of the importance of their education since a lengthy, lucrative career in professional sports is uncommon.
Future researchers could examine the relationship between student athletes who focus on succeeding athletically in order to secure a professional career after college and their academic success (Howard-Hamilton & Sina, 2001). It may be useful to see how strongly professional sport aspirations affect academic motivation.
increase student athletes’ academic success. Previous studies indicated that when the coaching staff does not communicate the importance of academics, the student athletes perceive it and are less inclined to make the most of their academic opportunities (Pearson, 1989). Perhaps, if that is the case, then fostering better communication between academic support staff and the coaches could be a solution.
The results of the SAASEI could also be used by the NCAA. Every ten years, member institutions are evaluated for accreditation by the NCAA (Fagg, 2005). Member institutions could be required to evaluate their academic support services in order to receive accreditation. The results would not only be beneficial for academic support programs and student athletes, but it would also show the dedication the academic support staff has for improving student athletes’ services.
In summary, the findings of this study supported the hypothesis that a significant correlation existed between some of the student athletes’ academic services provided by the NC State University Academic Support Program and the student athletes’ academic success, and therefore should be replicated using more student athletes and possibly more division I universities. The stringent NCAA policies created to increase graduation rates among student athletes have raised the expectation that student athletes not only successfully compete in their sport, but that they succeed in the classroom as well.
References
Agresti, A. & Finlay, B. (1986). Statistical Methods for the Social Sciences. San Fransisco, CA.: Dellen Publishing Co.
Baldwin, B.T. (1999). The factors that head football coaches at NCAA Division 1A universities
use to evaluate a potential athlete during the recruiting process. Unpublished master’s
thesis, Ball State University.
Cho, H., & LaRose, R. (1999). Privacy Issues in Internet Surveys. Social Science Computer
Review, 17(4), 421-434.
Faculty Committee on Athletics (1990). Exit interview survey. UNC Chapel Hill. Fagg, J. (personal communication, April 4, 2005)
Grayson, P. (personal communication, October 25, 2004) Gumble, M. (personal communication, October 21, 2004)
Howard-Hamilton, M.F., & Sina, J.A. (2001). New Directions for Student Services. San Francisco: Jossey-Bass.
Jimenez, T. (personal communication, October 26, 2004) Leger, C. (personal communication, November 29, 2004)
Lucas, J.W., & Lovaglia, M.J. (1998). Athlete’s expectation for success in athletics compared to academic competition. The Sport Journal, 5(2).
Mercer, R. (personal communication, October 22, 2004)
Mitra, A., & Lankford, S. (1999). Research Methods in Park, Recreation, and Leisure Services. Champaign, IL.: Sagamore Publishing.
Moiseichik, M., & Hughes, J. (2003). Programs that work administrative review: Broad reaching evaluation of an organization. Journal of Park and Recreation Administration, 21(3) 166.
Naughton, J. (1997). “The University of North Carolina is proud of its balance of big time athletics and quality academics; It has avoided scandal, but officials are vigilant against potential problems.” TheChronicle of Higher Education. A56.
Pearson, D.W. (1989). Perceptions of an Academic Support Program for Student Athletes in a
Major University. Unpublished doctoral dissertation, University of Houston.
Phillips, T.D. (2003). Exit interview survey for student athletes. Clemson University.
Pope, M.L., & Miller, M.T. (1996). A review of the literature related to service for college
student-athletes. Information Analysis.
Pope, M.L., & Miller, M.T. (1999). Support Services for Student-Athletes: Athletic Department
and Student Affairs Officers’ Perceptions. Report Research.
Saxon, L.H. (1996). College Sports: Time to Insist Athletics Push Academics. Riverside Press- Enterprise. September 17, 1996.
Spurgeon, J.H., French, K.E., & Keith, J.A. (1991). Gamecocks Revisited: A follow-up study of the University of South Carolina football players after two decades. Applied Research in
Coaching and Athletics Annual. 289-299.
Saunches, N. (2000). An Analysis of Exit Surveys of Student Athletes at the University of North
Carolina at Chapel Hill from 1994-1999. Unpublished master’s thesis, University of
North Carolina, Chapel Hill.
Shahawey, M.E. (personal communication, October 21, 2004).
Tasci, A.D.A., & Knutson, B.J. (2003). Online research modes: Waiting for leisure, hospitality, and tourism researchers. Journal of Hospitality and Leisure Marketing. 10 314.
Theobald, W. (1979). Evaluation of Recreation and Park Programs. New York: John Wiley and Sons.
APPENDIX