ISSN(Online): 2320-9801 ISSN (Print): 2320-9798
I
nternational
J
ournal of
I
nnovative
R
esearch in
C
omputer
and
C
ommunication
E
ngineering
(A High Impact Factor, Monthly, Peer Reviewed Journal) Website: www.ijircce.com
Vol. 7, Issue 8, August 2019
Evaluating the Effectiveness of Mobile
Telecommunication Network in APAPA Lagos
South-West, Nigeria
Pahalson, C. A. D
1, Tarkaa, N. S
2,
Habila Nuhu
3M. Eng Postgraduate Student, Dept. of EEE, UAM, Makurdi, Nigeria.1 Ph.D. Scholar, Dept. of EEE, UAM, Makurdi, Nigeria2
Ph.D. Scholar, Dept. of Science, plateau State Polytechnic Barkin- Ladi, Nigeria3
ABSTRACT: Quality of service and customer satisfaction in a cellular communication system is the major concern for
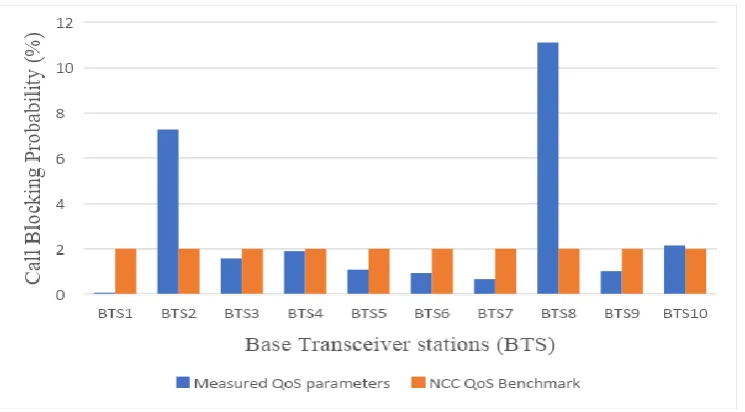
real time applications. In order to fulfill the users‘ demand, it is important for mobile network operators to ensure stability and efficiency by delivering a consistent, reliable and high quality end-user satisfaction. In this paper, a performance evaluation of a cellular network provider is presented. The data for the research was collected from Mobile Telecommunication Network (MTN), a leading telecom operator in Nigeria. The parameters of the network and operational data were collected from 10 arbitrary selected base stations from Apapa area of Lagos state covering a period of six months. The research was developed by holistically exploring the Key Performance Indicators (KPIs) covering all aspects of network planning and development. It was found that the call blocking probability for all the base stations except BTSs 2, 8and 10 fell below the NCC stated benchmark of 2% signifying good performance. Also the trunking efficiency of BTSs 2, 4, 1, 8, 3, 10, 5 and 6 in increasing order were slightly above the 60% benchmark prescribed by NCC. The results of the analysis of drop-call probability performance at all the 10 base stations were also found to be within acceptable limits. On the whole, the results revealed that the MTN subnetwork in the Apapa area was performing satisfactorily. However further optimization is required at the affected BTSs for improved trunking efficiency and call blocking probability.
KEYWORDS: Quality of Service, Call blocking Probability, Channel Utilization rate, KPI and Drop-call probability.
I. INTRODUCTION
ISSN(Online): 2320-9801 ISSN (Print): 2320-9798
I
nternational
J
ournal of
I
nnovative
R
esearch in
C
omputer
and
C
ommunication
E
ngineering
(A High Impact Factor, Monthly, Peer Reviewed Journal) Website: www.ijircce.com
Vol. 7, Issue 8, August 2019
time service, and the evident interest in using the Internet for a range of activities that are critical to both the public and private sectors
Key Performance Indicators (KPIs) have been extensively investigated and widely used in accessing the quality of services generally by the service providers. [16] used KPIs to evaluate the performance of an operational GSM network. The network performance evaluation is based on four major KPIs, i.e., call setup success rate, call drop rate, handover success rate and traffic congestion. In [15], the authors evaluate the handled traffic and network utilization of an operative GSM network during eight months. They developed a regression-based forecasting model for the traffic. The performance of GSM and GPRS operational network is presented in [18] with a review of the most common KPIs that are used to evaluate the performance of GSM and GPRS networks. The relationships between these KPIs are introduced and thresholds for some KPIs are suggested so that the GSM operators should not exceed them. [17] addressed the optimization of GSM network, data sorting and analyzing, implementing the optimization and system fine tuning. Network dimensioning such as BSC, MSC and other related parameters are addressed and the top ten wireless parameters are listed which are the most important from the authors‘ point of view. In [23], the KPIs for QoS evaluation in GSM network are identified. Four assessment parameters (network accessibility, service retainability, connection quality, and network coverage) for evaluating the QoS were applied on four GSM networks in Nigeria. The results of that study showed that the QoS of GSM networks in Nigeria is unreliable and the network accessibility and retainability are unsatisfactory. The study in [24] aimed at presenting the QoS of network optimization and evaluation of KPIs provided by GSM operators in terms of the ability to establish and maintain call connections, call retention, handover, inter and intra network call set-up. [19] carried out comparative analysis of network congestion. In their research, they proposed a combine and non – combined model for managing the congestion control. The research proposed a new scheme that can control congestion in GSM network. The network performance evaluation was based on four major key performance indicators (KPIs) which include call setup success rate, CDR, handover success rate and traffic channel congestion rate. The KPIs were explored and the performance of the new model was compared with that of the non-combined (existing) model. Finally, improvement methodologies were suggested. [25] carried out traffic congestion audit of MTN cells located within Dutse metropolis, which involves following routes between the cells and assessing the quality of service (QoS). Drive test was conducted to collect traffic data, the base transceiver station (BTS) power throughput was measured and the maximum carrying capacity of mobile stations (MSs) was identified which enabled him to determine the amount of deviation from the expected power. He identified the channels and/or interface(s) that habitually contributed to this traffic congestion by comparing the outcomes with the KPIs. Conclusively, he found out that the channels that are greatly involved in call setup are simultaneously played a vital role toward congestion effect. The work of [20] investigated the causes of congestion using a survey research design methodology, live data from MTN BTS and BSC, as well as customer feedback. The study showed that a major cause of MTN network congestion is lack of adequate network resources to cope with the demand of its teeming subscribers. Similarly, [21] simulated some traffic models in MATLAB environment for evaluating performance of GSM networks using Call Completion Ratio (CCR) and Answer Seizure Ratio (ASR) on four mobile network‘s BTS and BSC in Nigeria. The result showed that the QoS is not reliable as a result of network congestion. However, the work did not identify the cause or proffer solution to the congestion problem. Similarly, [22] established traffic pattern for 6 BSCs over 24 hours in Nigeria for a period of five months and the analysis showed that the busy hour is 20:00 on five of the BSCs and 14:00 on one of the BSCs.
II. THEORY OF WORK
ISSN(Online): 2320-9801 ISSN (Print): 2320-9798
I
nternational
J
ournal of
I
nnovative
R
esearch in
C
omputer
and
C
ommunication
E
ngineering
(A High Impact Factor, Monthly, Peer Reviewed Journal) Website: www.ijircce.com
Vol. 7, Issue 8, August 2019
The evaluation of the network is done by looking at the Key Performance Indicators (KPI) [ 1] of the network. Typical KPIs are metrics for measuring QoS. QoS is most commonly measured by the following metrics: call blocking probability, trunking efficiency and drop-call probability
III. CALL BLOCKING PROBABILITY
In a wireless mobile network, CBP or GoS is among the key performance measures in mobile communication network. Usually this parameter is specified in the design. To evaluate the performance of a wireless network, the concept of traffic offered, traffic carried, and traffic lost is illustrated in Figure 1
Figure 1: Network Traffic scenario [11]
The term of GoS is donated by PB is used and it is defined in [4] as;
(1)
In general,
ISSN(Online): 2320-9801 ISSN (Print): 2320-9798
I
nternational
J
ournal of
I
nnovative
R
esearch in
C
omputer
and
C
ommunication
E
ngineering
(A High Impact Factor, Monthly, Peer Reviewed Journal) Website: www.ijircce.com
Vol. 7, Issue 8, August 2019
[2] also defined GoS as:
(2)
Served is the total number of served users in a defined target area and existing is the total number of users in this area. The GoS denotes the probability that a specific service is available. The operator of GSM networks usually tries to guarantee a minimum GoS of about 90 percent.
IV. TRUNKING EFFICIENCY OF THE CELLULAR NETWORK
Another important parameter which is usually used to characterize the efficiency of cellular network is called trunking efficiency (channel utilization efficiency). Trunking efficiency is the maximum traffic intensity that a system can provide for a given GoS which is determined by the amount of traffic per channel [6]
Trunking Efficiency (3)
Trunking efficiency is also measured by the channel usage efficiency (or loading factor) [12]. The channel utilization depends on the total traffic and call arrival rate. In the Erlang B model
(4)
The Erlang-B formula is not entirely applicable to cellular systems, because it does not account for handoff calls. Furthermore, the total offered traffic per cell may be time-varying due to the spatial movement of the subscribers, whereas the offered traffic in the Erlang-B formula is assumed to be constant. The Erlang-B formula
(5)
Where, is the offered traffic (capacity) , is the blocking probability, is the total number of traffic channels and is number of users.
To calculate the capacity of the given cell using blocking probability and the number of carriers, we need the well-known Erlang B table or formulas and the number of traffic channels for different number of carriers. The result we get is the traffic capacity in Erlangs, which can easily be transferred into the number of subscribers and formulation as:
(6)
ISSN(Online): 2320-9801 ISSN (Print): 2320-9798
I
nternational
J
ournal of
I
nnovative
R
esearch in
C
omputer
and
C
ommunication
E
ngineering
(A High Impact Factor, Monthly, Peer Reviewed Journal) Website: www.ijircce.com
Vol. 7, Issue 8, August 2019
V. DROPPED- CALL PROBABILITY
Dropped call is the common term for describing the rate of calls which end due to technical reasons. The probability of such an event is known as drop- call probability [10]. Drop-call probability is given by [13] as:
n ≥ 0 (7)
Here, is the drop-call rate, t the call duration, while is a random variable that counts the number of drops and n
is the confirmed calls dropped. Call dropping events constitute a Poisson probability distribution function. This model, there are no assumption in a particular technology, it is worthwhile to note that the model can be exploited to predict the drop-call probability in different networks (e.g. GSM, PCS, UMTS). The drop-call probability is one of the most important QoS index used to monitor the performance of cellular networks. Wireless service providers have to design the network to minimize the call dropping probability for customer care. Generally, more than 50% of the reasons for dropped calls by [13] in a cell, are reported to be mainly due to electromagnetic causes, and other factors are; the prepaid account balance, service plan subscribed, power supply of the mobile devices, the users‘ mobility mechanism, and handoff. There are different ways to calculate DCR. It can be calculated as dropped calls per Erlang, dropped calls over originated calls and dropped calls over all calls handled by each cell, including incoming handovers. In this work, we will use dropped calls over originated calls only, since it is the most common way in which operators calculate DCR. Furthermore, studying call dropping behaviors as a function of other network parameters (e.g. traffic load, utilization factor, call arrival rate and call duration) would aid the optimization of the system‘s performance and guarantee excellent quality of service delivery as well as improved revenue. Moreover, [13] showed that the number of dropped calls due to inadequate radio link quality and other similar reasons is calculated from the relation
(8)
The application of the above formula (equations 5, 7 and 8) in probability analysis as carried out in various literature [13] and [14] shows that dropped-call probability decreases with an increasing number of channels.
i. Call Arrival Rate
Call arrival rate , refers to the traffic offered expressed as the number of call attempts per unit time which is given by [26] as:
(9)
ii. Call Duration
Call duration is another parameter that can affect the quality of service in a cellular network, hence it is considered when planning the network [7]. Call duration or mean call holding time is defined as the time a mobile station takes to complete a call connection. Mathematically, call duration is given by [8] as:
ISSN(Online): 2320-9801 ISSN (Print): 2320-9798
I
nternational
J
ournal of
I
nnovative
R
esearch in
C
omputer
and
C
ommunication
E
ngineering
(A High Impact Factor, Monthly, Peer Reviewed Journal) Website: www.ijircce.com
Vol. 7, Issue 8, August 2019
Where; = traffic intensity in Erlang, = call arrival rate
iii. Channel Utilization Factor
The utilization factor is the ratio of the time that the network is in use to the total time that it could be in use. Utilization factor is the traffic load in the cellular network. Traffic load signifies the strength of the offered traffic in the network [9]. By definition, the traffic load is the ratio between the arrival rate of calls and the service rate of the calls arriving. Utilization factor gives the product of total traffic offered and the mean service time
. (11) Where is an Average Traffic Intensity, is the Mean Holding time
Therefore, we can simply analyze the impact on model results of the call-arrival rate and of the call duration.
VI. METHODOLOGY
Traffic analysis plays an important role in the planning and network design in cellular communication system, particularly in network resource allocation, performance evaluation of network in terms of utilization capacity and coverage.
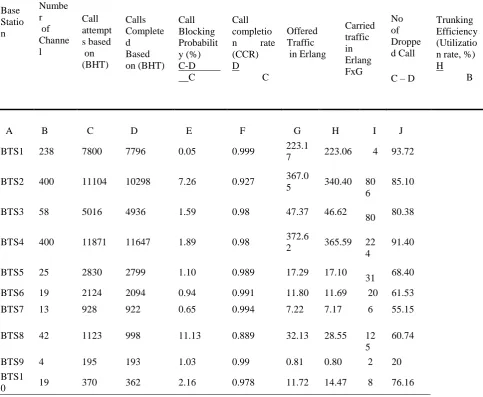
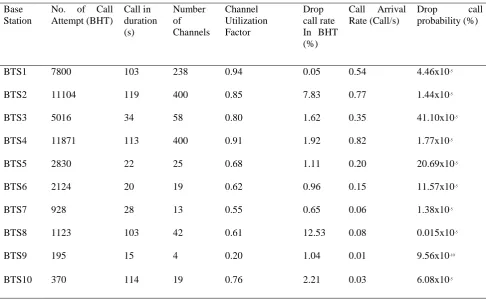
An average Busy Hour Traffic (BHT) data for six months is presented in Table 1 using the busy hour for Ten different GSM base stations in Apapa Lagos, south western part of Nigeria in order to evaluate the performance making use of data obtained for three key performance indicators. The primary data for this study were obtained from the OMC are; number of call attempts, number of successful call and service time (calls duration). These traffic parameters were used to determine the offered traffic, block traffic (loss traffic), traffic channel and other traffic performance parameters also called Traffic Key Performance Indicator (KPI). They are Calls Completion Rate (CCR), Grade of Service (GoS), Channels Utilization Rate (CUR), drop- call rate (DCR), call arrival rate and drop-call probability etc., by improving these parameters, we improve the quality of network from using Table 1 and equations (3), (6), (7), and (8) were presented in Table 2 and Table 3.
VII. DATA ANALYSIS AND RESULTS
Average busy hour key performance indicator for the ten base transceiver stations were shown in Table 2 and Table 3.
Table 1: KPIs data Obtained from OMC for the Ten Base Transceiver Stations for six months
S/N Base Station Call attempt Based on (BHT)
Successful call Based On (BHT)
ISSN(Online): 2320-9801 ISSN (Print): 2320-9798
I
nternational
J
ournal of
I
nnovative
R
esearch in
C
omputer
and
C
ommunication
E
ngineering
(A High Impact Factor, Monthly, Peer Reviewed Journal) Website: www.ijircce.com
Vol. 7, Issue 8, August 2019
Table 2: Calls Analysis of 10 Base Transceiver Stations Indicators for six months
Base Statio n Numbe r of Channe l Call attempt s based on (BHT) Calls Complete d Based on (BHT) Call Blocking Probabilit y (%) C-D C Call completio n rate (CCR) D C Offered Traffic in Erlang Carried traffic in Erlang FxG No of Droppe d Call C – D
Trunking Efficiency (Utilizatio n rate, %) H B
A B C D E F G H I J BTS1 238 7800 7796 0.05 0.999 223.1
7 223.06 4 93.72 BTS2 400 11104 10298 7.26 0.927 367.0
5 340.40 80 6
85.10
BTS3 58 5016 4936 1.59 0.98 47.37 46.62
80 80.38 BTS4 400 11871 11647 1.89 0.98 372.6
2 365.59 22 4
91.40
BTS5 25 2830 2799 1.10 0.989 17.29 17.10
31 68.40 BTS6 19 2124 2094 0.94 0.991 11.80 11.69 20 61.53 BTS7 13 928 922 0.65 0.994 7.22 7.17 6 55.15 BTS8 42 1123 998 11.13 0.889 32.13 28.55 12
5
60.74 BTS9 4 195 193 1.03 0.99 0.81 0.80 2 20 BTS1
0 19 370 362 2.16 0.978 11.72 14.47 8 76.16
ISSN(Online): 2320-9801 ISSN (Print): 2320-9798
I
nternational
J
ournal of
I
nnovative
R
esearch in
C
omputer
and
C
ommunication
E
ngineering
(A High Impact Factor, Monthly, Peer Reviewed Journal) Website: www.ijircce.com
Vol. 7, Issue 8, August 2019
Table 3: Evaluation of Drop Call Rates, Call Arrival Rate and Drop Call Probability
Base Station
No. of Call Attempt (BHT)
Call in duration (s)
Number of Channels
Channel Utilization Factor
Drop call rate In BHT (%)
Call Arrival Rate (Call/s)
Drop call probability (%)
BTS1 7800 103 238 0.94 0.05 0.54 4.46x10⁻⁵
BTS2 11104 119 400 0.85 7.83 0.77 1.44x10⁻⁵
BTS3 5016 34 58 0.80 1.62 0.35 41.10x10⁻⁵
BTS4 11871 113 400 0.91 1.92 0.82 1.77x10⁻⁵
BTS5 2830 22 25 0.68 1.11 0.20 20.69x10⁻⁵
BTS6 2124 20 19 0.62 0.96 0.15 11.57x10⁻⁵
BTS7 928 28 13 0.55 0.65 0.06 1.38x10⁻⁵
BTS8 1123 103 42 0.61 12.53 0.08 0.015x10⁻⁵
BTS9 195 15 4 0.20 1.04 0.01 9.56x10⁻¹⁰
BTS10 370 114 19 0.76 2.21 0.03 6.08x10⁻⁵
Analysis of Call Blocking Probability of Cellular Network
ISSN(Online): 2320-9801 ISSN (Print): 2320-9798
I
nternational
J
ournal of
I
nnovative
R
esearch in
C
omputer
and
C
ommunication
E
ngineering
(A High Impact Factor, Monthly, Peer Reviewed Journal) Website: www.ijircce.com
Vol. 7, Issue 8, August 2019
Figure 2: Comparison of NCC QoS Benchmark and estimated Call Blocking Probability
Analysis of Trunking Efficiency of the Cellular Network
In the case of MTN network in Apapa, the trunking efficiency performance is presented in Table 1 and plotted in Figure 3. It can be seen that the best performing base stations are 7 and 9 having the lowest trunking efficiency. Base transceiver stations 2, 4, 1, 8 and 3 followed by 10, 5 and 6 trunking efficiencies is above 60% benchmark stated by NCC. These will result in loss of calls or blocked calls in affected base transceiver stations. Effort should be made by the mobile communication operator to provide good quality of service (QoS) and monitoring agency (NCC) should ensure that they conform to recommended standard to avoid blocked calls during the busy hour. Thus appropriate optimization measure is required to increase capacity.
ISSN(Online): 2320-9801 ISSN (Print): 2320-9798
I
nternational
J
ournal of
I
nnovative
R
esearch in
C
omputer
and
C
ommunication
E
ngineering
(A High Impact Factor, Monthly, Peer Reviewed Journal) Website: www.ijircce.com
Vol. 7, Issue 8, August 2019
Analysis of Drop Call Probability of the Cellular Network
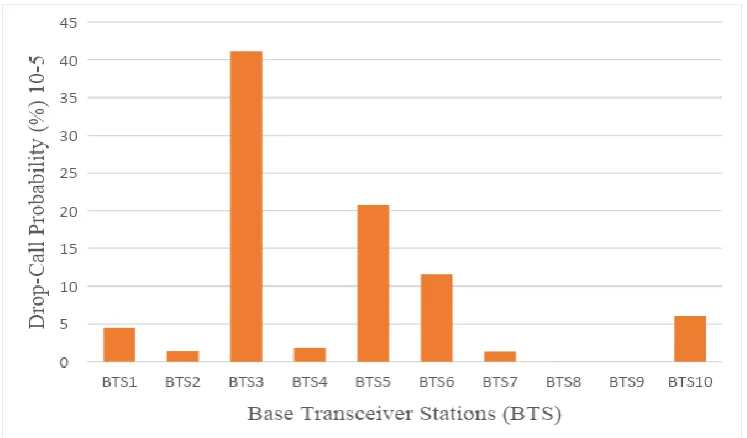
The drop-call probability is one of the most important parameter for assessing the quality of service (QoS) in a cellular network. Table 2 and Figure 4 confirms that MTN network in Apapa is performing satisfactorily. This is because the estimated values of drop-call probabilities were well below the benchmark at all the 10 base stations.
Figure 4: Comparison of Drop-Call Probability at Base Transceiver Stations
VIII. CONCLUSION
The main goal of our research work is to evaluate the existing QoS performance for Mtn network. The evaluation is made based on some performance metrics such as call blocking probability, trunking efficiency and drop-call probability. On basis of the results and literature review, the performance of the network was satisfactory.
REFERENCES
[1] Laiho, J., Wacker, A., and T. Novosad, T., Radio Network Planning and Optimization for UMTS, John Wiley & Sons, Chichester, UK, 2002. [2] Gerdenitsch, A., Jakl, S., Toeltsch, M., and Neubauer, T.,‖ Intelligent Algorithms for System Capacity Optimization of UMTS FDD Networks‖, 4th International Conference on 3G Mobile Communication Technologies, London, United Kongdom, 2003
[3] Ekpenyong, M and Isabona, J., Modeling the Effect of Dropped Calls on Cell Traffic in Established 3G-Based Cellular Networks. IEEE; Vol.7, no.2, pp. 157-164, 2014
[4] Cragin, B.L., ―Prediction of Seasonal Trends in Cellular Dropped Call Probability‖, IEEE, Capital City Applied Research, Research Paper, 2375 Club Mredian Dr. #B7, Okemos, MI 48864, USA, 2006
[5] Ericsson Radio System AB, GSM System Survey, Course Documentation EN/LZT/123 3321 RZB pp. 77, 1998
[6] Faruque, S., ―High Capacity Cell Planning Based on Fractional Frequency Reuse with Optimum Trunking Efficiency‖. Vehicular technology
conference, VTC98. 48th IEEE. Vol. 2, pp.1458-1460, 1996
[7] Mishra, A. R., "Fundamentals of Cellular Network Planning." Chicago: American Market Association, 2004 [8] Lee W.C.Y., ―Mobile Cellular Telecommunication‖. McGraw – Hill Book Company, 1995
[9] Madan, B.D., Dhamarajs, S and Trivedi, K.S., ―Combined Guard Channel and Mobile Assisted Handoff for cellular Networks‖ IEEE Transactions on Vehicular Technology. 2006
ISSN(Online): 2320-9801 ISSN (Print): 2320-9798
I
nternational
J
ournal of
I
nnovative
R
esearch in
C
omputer
and
C
ommunication
E
ngineering
(A High Impact Factor, Monthly, Peer Reviewed Journal) Website: www.ijircce.com
Vol. 7, Issue 8, August 2019
[11] Tam, W.M., Lau, F.C.M., Tse, C.K., Xia, Y.X. and Small, M., Traffic Analysis of a Mobile Communication System Based on a Scale-Free User Network. International Symposium on Nonlinear Theory and Its Applications (NOLTA2005), Bruges, 18-21 October 2005, pp 130-133, 2005 [12] Swales S. C, Beach M. A, Edwards D. J and McGeehan, J. P., ―The Performance enhancement of Multi beam Adaptive Base-Station Antennas for Cellular Land Mobile Radio Systems," IEEE Transactions on Vehicular Technology, Vol.no.1, pp 56-67, 1990
[13] Tarkaa, N.S. Mom, M. Ani CI. Drop Call Probability Factors in Cellular Network. International Journal of Scientific and Engineering Research IJSER, Vol.2, no.10 pp 1-5, 2010
[14] Boggia, G., Camarda, P and D‘Alconzo, A., ―Modeling of Call Dropping in Well-Established Cellular Networks‖, EURASIP Journal on Wireless Communications and Networking, Vol. 2007, Article ID17826, October, 2007
[15] Boulmalf, M., Abrache, J., Aouam, T., and Horroud, H., "Traffic Analysis of GSM Networks," IEEE Journal, pp.498-503, 2009
[16] Haider B. Zafrullah,M. and Islam, M. K., "Radio Frequency Optimisation and QoS Evaluation in Operational GSM Network. Proceedings of the World Congress on Engineering and Computer Science 2009,Vol 1 WCECS 2009, San Francisco
[17] Jia, S., Guo, Y., Wang, Z. and Kang, K., ‗Some lessons learned in GSM network optimization‘, in Proceedings of the IEEE International
Conference on Machine Vision and Human-machine Interface (MVHI), pp.569–571, 2010
[18] Kyriazakos, S., Gkroustiotis, V., Karambalis, C., Kechagias, C., Papaoulakis, N., Nikitopoulo D. and Karetsos, G., ‗Performance evaluation of GSM and GPRS systems based on measurement campaigns‘, in Proceedings of the 5th IEEE International Symposium on Wireless Personal Multimedia Communications, Vol.3: pp.1167– 1171
[19] Mbachu C. B. and Usiade R. E., Comparative analysis of the performances of a combined and non-combined models designs for congestion
controls in global system for mobile communication (GSM) network. Int. J. Adv. Res. Technol. Vol.4, no.10, pp.109-122, 2015
[20] Mughele, E., Olatokun, S. Olatokun, W. & Adegbola T., ―Congestion control mechanisms and patterns of call distribution in GSM
telecommunication networks: The case of MTN Nigeria, African Journal of Computing and ICT, ISSN2006-1781, Vol.5, no.1, pp.29-42, 2012
[21] Ohaneme, C. O., Akpado, K. A., Alumona, T. L. and Emenike, I. S., "Performance Evaluation of Mobile Network Interconnections in Nigeria,"
International Journal of Scientific and Engineering Research, Vol.3, no.4, 2012
[22] Oladeji E.O, Onwuka E.N, Aibinu M.A., Determination of Voice Traffic Busy Hour and Traffic Forecasting in Global System of Mobile Communication (GSM) in Nigeria, 11th Malaysia International Conference on Communications 26th - 28th November 2013, Kuala Lumpur, Malaysia
[23] Popoola J. J., Megbowon I. O. and Adeloye V. S. A., Performance Evaluation and Improvement on Quality of Service of Global System for Mobile Communications in Nigeria, Journal of Information Technology Impact Vol.9, no.2, pp.91-106, 2009
[24] Shoewu O. and Edeko, F.O. (2011). "Outgoing Call Quality Evaluation of GSM Network Services in Epe, Lagos State." American Journal of
Scientific and Industrial Research (AJSIR), Vol.2, no.3, pp.409-417.
[25] Surajo A. M., Performance appraisal of mobile telecommunication network (MTN) traffic congestion in Dutse, Jigawa State. ATBU, J. Sci. Technol. Educ. (JOSTE), Vol.4, no.1, pp.67-83, 2016
[26] Perumalraja, R., Chung-Horng, L., and Anand, S. (2014). ―QoS- Awere Distributed Security Architecture for 4G Multihop Wireless Networks‖
![Figure 1: Network Traffic scenario [11]](https://thumb-us.123doks.com/thumbv2/123dok_us/1371735.1169904/3.595.131.460.322.587/figure-network-traffic-scenario.webp)