ISSN(Online): 2320-9801
ISSN (Print): 2320-9798
I
nternational
J
ournal of
I
nnovative
R
esearch in
C
omputer
and
C
ommunication
E
ngineering
(An ISO 3297: 2007 Certified Organization)
Vol. 4, Issue 8, August 2016
Optimal Classifier for the Diagnosis of Breast
Cancer using Computational Intelligence
Techniques
Ms.Sneha Badrinath Sanap 1,Vijay L. Agrawal2
PG Student, HVPM’s College of Engineering and Technology, Amravati, India
Associate Professor, Dept. of EnTC, HVPM’s College of Engineering and Technology, Amravati, India
ABSTRACT: In this paper a new classification algorithm is proposed for the Efficient Classification of Breast Tumor. In order to develop algorithm 33 CT scan images of patients have been considered consisting of Benign Tumor, Malignant Tumor and Normal Breast Computed tomography (CT) Scan image. With a view to extract features from the CT scan images after image processing, an algorithm proposes (WHT) Wavelet Transform coefficients. The Efficient classifiers based on Multilayer Perceptron (MLP) Neural Network. A separate Cross-Validation dataset is used for proper evaluation of the proposed classification algorithm with respect to important performance measures, such as MSE and classification accuracy. The Average Classification Accuracy of MLP Neural Network comprising of one hidden layers with 1 PE’s organized in a typical topology is found to be superior (100 %) for Training . Finally, optimal algorithm has been developed on the basis of the best classifier performance. The algorithm will provide an effective alternative to traditional method of Breast Computed tomography (CT) scan image analysis for deciding the tumor in Breast is Benign or Malignant.
KEYWORDS: Neural solution, MatLab, Excel, CT scan images.
I. INTRODUCTION
The early detection of Breast cancer is a most challenging problem to identify in human body, due to the different -different cells structure of cancer, where most of the cells are overlapped with each other. Cancer diagnosis is one of the most danger problems in the medical domain. Most of researchers have focused try to improve performance and possible to obtain Best and satisfactory results. The correct classification of cancer is an important real-world medical problem. Cancer has become one of the most harmful Death disease around the world and research into Breast cancer diagnosis and treatment has become an one of the most important issue all over the world.
In the modern age of computerized fully automated trend of living, the field of automated diagnostic systems plays an important and vital role. Automated diagnostic system designs in Medical Image processing are one such field where numerous systems are proposed and still many more under conceptual design due explosive growth of the technology today [1].. More people die because of Breast cancer than any other types of cancer such as Breast, colon, and prostate cancers. There is significant evidence indicating that the early detection of Breast cancer will decrease death rate [2].
The proposed algorithm provides Efficient Classification of Breast Tumor based on ( M L P ) Multi-layer Perceptron neural network ap- proach and tested on the Breast 33 CT scan images comprising of features extracted using (DCT) discrete cosine Transform domain co-efficient .
II. RELATED WORK (LITERATURESURVEY)
ISSN(Online): 2320-9801
ISSN (Print): 2320-9798
I
nternational
J
ournal of
I
nnovative
R
esearch in
C
omputer
and
C
ommunication
E
ngineering
(An ISO 3297: 2007 Certified Organization)
Vol. 4, Issue 8, August 2016
have been used in Breast Cancer diagnosis in the recent years. Neural Networks classifiers have been used in a medical diagnosis because of its characteristics like fast learning.
2] Authors used a Computer-Aided Diagnosis System for Digital Mammograms Based on Fuzzy-Neural and Feature Extraction Techniques The system is capable of detecting nodules when they are in their initial stages, facilitating their early diagnosis, thus, improving the patients probability.
3] Authors used Imaging of Breast Cancer with Optical Coherence Tomography Needle Probes .The method used Interstitial imaging, needle probe, OCT needle, optical coherence tomography (OCT). To enable a clear delineation of tumor boundary from surrounding adipose tissue and identification of microarchitectural features.
4] Authers used Computer-Aided Diagnosis of Solid Breast Nodules:Use of an Artificial Neural Network Based on Multiple Sonographic Features .The developed CAD algorithm has the potential to increase the specificity of US for characterization of breast lesions.
III.PROPOSED ALGORITHM
A. Research methodology :
Figure 1: Methodology of work
It is proposed to study Efficient Classification of Breast Tumor using Neural Classifier. Data acquisition for the proposed classifier designed for the diagnosis of Breast Cancer shall be in the form of CT Scanned images. Image data will be Collected from the different- different hospitals of the country .The most important un correlated features as well as coefficient from the images will be extracted .In order to extract features, statistical techniques, image processing techniques, transformed domain will be used.
1) Images Collected
ISSN(Online): 2320-9801
ISSN (Print): 2320-9798
I
nternational
J
ournal of
I
nnovative
R
esearch in
C
omputer
and
C
ommunication
E
ngineering
(An ISO 3297: 2007 Certified Organization)
Vol. 4, Issue 8, August 2016
2) Feature Extraction
Collected Breast tumor CT Scan images are in .jpg format. By using CT scan images processing & cropping the region of Tumor the 128 features are extracted .
Fig. 2: Few Samples of input processed CT scan images of Breast tumor. (Above Breast images are of Benign, Malignant )
Each Breast CT image is represented by a feature vector, F; which is comprised of 128 different parameters. The dataset contains 33 instances (exemplars) for three different classification The classifier based on neural network is trained from the training dataset, where a feature vector is mapped on to a particular class or name of the Breast disease. The neural network learns from data (training exemplars) and the connection weights and biases are estimated as a result of this learning.
3) Neural Networks
Following Neural Networks are tested: a) Multilayer perceptron (MLP)
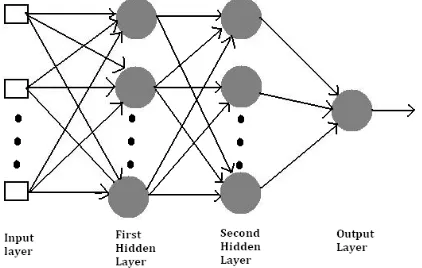
The most common neural network model is the multi layer perceptron (MLP). This type of neural network is known as a supervised network because it requires a desired output in order to learn. The goal of this type of network is to create a model that correctly maps the input to the output using historical data so that the model can then be used to produce the output when the desired output is unknown. A graphical representation of an MLP is shown below:
ISSN(Online): 2320-9801
ISSN (Print): 2320-9798
I
nternational
J
ournal of
I
nnovative
R
esearch in
C
omputer
and
C
ommunication
E
ngineering
(An ISO 3297: 2007 Certified Organization)
Vol. 4, Issue 8, August 2016
The MLP and many other neural networks learn using an algorithm called backpropagation. With backpropagation, the input data is repeatedly presented to the neural network. With each presentation the output of the neural network is compared to the desired output and an error is computed. This error is then fed back (backpropagated) to the neural network and used to adjust the weights such that the error decreases with each iteration and the neural model gets closer and closer to producing the desired output. This process is known as "training". [10]
Learning Rules used:
Momentum(MOM)
Momentum simply adds a fraction m of the previous weight update to the current one. The momentum parameter is used to prevent the system from converging to a local minimum or saddle point. A high momentum parameter can also help to increase the speed of convergence of the system. However, setting the momentum parameter too high can create a risk of overshooting the minimum, which can cause the system to become unstable. A momentum coefficient that is too low cannot reliably avoid local minima, and can also slow down the training of the system.
Conjugate Gradient (CG)
CG is the most popular iterative method for solving large systems of linear equations. CG is effective for systems of the form A=xb-A (1) where x _is an unknown vector, b is a known vector, and A _is a known, square, symmetric, positive-definite (or positive-indefinite) matrix. (Don’t worry if you’ve forgotten what “positive-definite” means; we shall review it.) These systems arise in many important settings, such as finite difference and finite element methods for solving partial differential equations, structural analysis, circuit analysis, and math homework.
Developed by Widrow and Hoff, the delta rule, also called the Least Mean Square (LMS) method, is one of the most commonly used learning rules. For a given input vector, the output vector is compared to the correct answer. If the difference is zero, no learning takes place; otherwise, the weights are adjusted to reduce this difference. The change in weight from ui to uj is given by: dwij = r* ai * ej, where r is the learning rate, ai represents the activation of ui and ej is the difference between the expected output and the actual output of uj. If the set of input patterns form a linearly independent set then arbitrary associations can be learned using the delta rule.
It has been shown that for networks with linear activation functions and with no hidden units (hidden units are found in networks with more than two layers), the error squared vs. the weight graph is a paraboloid in n-space. Since the proportionality constant is negative, the graph of such a function is concave upward and has a minimum value. The vertex of this paraboloid represents the point where the error is minimized. The weight vector corresponding to this point is then the ideal weight vector.
Developed by Widrow and Hoff, the delta rule, also called the Least Mean Square (LMS) method, is one of the most commonly used learning rules. For a given input vector, the output vector is compared to the correct answer. If the difference is zero, no learning takes place; otherwise, the weights are adjusted to reduce this difference. The change in weight from ui to uj is given by: dwij = r* ai * ej, where r is the learning rate, ai represents the activation of ui and ej is the difference between the expected output and the actual output of uj. If the set of input patterns form a linearly independent set then arbitrary associations can be learned using the delta rule.
It has been shown that for networks with linear activation functions and with no hidden units (hidden units are found in networks with more than two layers), the error squared vs. the weight graph is a paraboloid in n-space. Since the proportionality constant is negative, the graph of such a function is concave upward and has a minimum value. The vertex of this paraboloid represents the point where the error is minimized. The weight vector corresponding to this point is then the ideal weight vector.
Quick propagation
Quick propagation (Quickprop) [1] is one of the most effective and widely used adaptive learning rules. There is only one global parameter making a significant contribution to the result, the e-parameter. Quick-propagation uses a set of heuristics to optimise Back-propagation, the condition where e is used is when the sign for the current slope and previous slope for the weight is the same.
Delta by Delta
ISSN(Online): 2320-9801
ISSN (Print): 2320-9798
I
nternational
J
ournal of
I
nnovative
R
esearch in
C
omputer
and
C
ommunication
E
ngineering
(An ISO 3297: 2007 Certified Organization)
Vol. 4, Issue 8, August 2016
weight from ui to uj is given by: dwij = r* ai * ej, where r is the learning rate, ai represents the activation of ui and ej is the difference between the expected output and the actual output of uj. If the set of input patterns form a linearly independent set then arbitrary associations can be learned using the delta rule.
It has been shown that for networks with linear activation functions and with no hidden units (hidden units are found in networks with more than two layers), the error squared vs. the weight graph is a paraboloid in n-space. Since the proportionality constant is negative, the graph of such a function is concave upward and has a minimum value. The vertex of this paraboloid represents the point where the error is minimized. The weight vector corresponding to this point is then the ideal weight vector. [10]
IV. SIMULATION RESULTS
1) Computer Simulation
The MLP neural network has been simulated for 33 tumor CT Scan images out of which 29 (90% of total images) were used for training purpose and 4 (10% of total images) were used for cross validation.
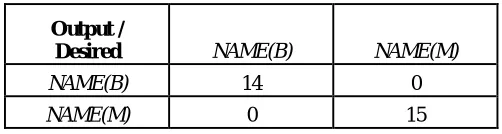
The simulation of best classifier along with the confusion matrix is shown below :
Fig.4 MLP neural network trained with MOM learning rule
2) Results :
Here Table I and Table II Contend the C.V (cross validation) as well as Training data set. B stand for Benign And M stand For Malignant tumor identification.
Output /
Desired NAME(B) NAME(M)
NAME(B) 2 0
NAME(M) 0 2
Table I. Confusion matrix on CV data set
TABLE II. Confusion matrix on Training data set
Here Table III and Table IV Contain the Training and C.V result. Table III show the result or identify the Benign and Malignant 100% or Table IV show the result or identify the Benign and Malignant 100%.
Output /
Desired NAME(B) NAME(M)
NAME(B) 14 0
ISSN(Online): 2320-9801
ISSN (Print): 2320-9798
I
nternational
J
ournal of
I
nnovative
R
esearch in
C
omputer
and
C
ommunication
E
ngineering
(An ISO 3297: 2007 Certified Organization)
Vol. 4, Issue 8, August 2016
Performance NAME(B) NAME(M)
MSE 3.757E-05 3.757E-05
NMSE 0.00015028 0.00015028
MAE 0.005319189 0.005319189
Min Abs Error 0.002192226 0.002192228
Max Abs Error 0.0103443 0.010344299
R 0.999942337 0.999942337
Percent Correct 100 100
TABLE III. Accuracy of the network on CV data set
Performance NAME(B) NAME(M)
MSE 1.54785E-05 1.54785E-05
NMSE 6.19878E-05 6.19878E-05
MAE 0.003695769 0.003695769
Min Abs Error 0.000786962 0.000786963
Max Abs Error 0.005602442 0.005602441
r 0.999969125 0.999969125
Percent Correct 100 100
TABLE IV. Accuracy of the network on training data set
Here, Table V Show the Finale results of this paper.
Learing Rule Processing Elements Training
Cross Validation
Benign
Malignant. Benign Malignant.
MOM
1 100% 100% 100% 100%
TABLE V. Multilayer Perceptron Neural Network Transform Domain : (WHT) Wavelet Transform
Here Table V Show the Finale result of this paper .It show the 1 Processing element with Momentum algorithm of Neuro Solution. it show the Benign 100% in C.V and Trainign and Malignant 100% in both of them.
V. CONCLUSION AND FUTURE WORK
The MLP classifier with MOM learning rule gives best performance of 100% in Training for malignant and benign tumor is 100% and in Cross validation 100% benign and 100% Malignant.
ISSN(Online): 2320-9801
ISSN (Print): 2320-9798
I
nternational
J
ournal of
I
nnovative
R
esearch in
C
omputer
and
C
ommunication
E
ngineering
(An ISO 3297: 2007 Certified Organization)
Vol. 4, Issue 8, August 2016
VI. ACKNOWLEDGMENT
We are very grateful to our HVPM College of Engineering and Technology to support and other faculty and associates of ENTC department who are directly & indirectly helped me for these paper.
REFERENCES
[1] Brijesh Verma and John Zakos.: “A Computer-Aided Diagnosis System for Digital Mammograms Based on Fuzzy-Neural and Feature Extraction Techniques”.: IEEE TRANSACTIONS ON INFORMATION TECHNOLOGY IN BIOMEDICINE, VOL. 5, NO. 1, MARCH 2001.
[2] Elise C. Fear,Xu Li,Susan C. Hagness, and Maria A. Stuchly.: “Confocal Microwave Imaging for Breast Cancer Detection: Localization of Tumors in Three Dimensions.: IEEE TRANSACTIONS ON BIOMEDICAL ENGINEERING, VOL. 49, NO. 8, AUGUST 2002.
[3] Essex J. Bond,Susan C. Hagness,and Barry D. Van Veen.: Microwave Imaging via Space-Time Beamforming for Early Detection of Breast Cancer.: IEEE TRANSACTIONS ON ANTENNAS AND PROPAGATION, VOL. 51, NO. 8, AUGUST 2003.
[4] Segyeong Joo, Yoon Seok Yang, Woo Kyung Moon, and Hee Chan Kim.: Computer-Aided Diagnosis of Solid Breast Nodules:Use of an Artificial Neural Network Based on Multiple Sonographic Features.: IEEE TRANSACTIONS ON MEDICAL IMAGING, VOL. 23, NO. 10, OCTOBER 2004
[5] Mark Converse, Essex J. Bond, Barry D. Van Veen, F and Susan C. Hagness.: A Computational Study of Ultra-Wideband Versus Narrowband Microwave Hyperthermia for Breast Cancer Treatment.: IEEE TRANSACTIONS ON MICROWAVE THEORY AND TECHNIQUES, VOL. 54, NO. 5, MAY 2006.
[6] Shivang Naik, Scott Doyle,Shannon Agner, Anant Madabhushi and Michael Feldman, +John Tomaszewski.: AUTOMATED GLAND AND NUCLEI SEGMENTATION FOR GRADING OF PROSTATE AND BREAST CANCER HISTOPATHOLOGY.: 978-1-4244-2003-2/08/$25.00 ©2008 IEEE
[7] Jinshan Tang, S, Rangaraj M. Rangayyan, Jun Xu, Issam El Naqa,and Yongyi Yang.: Computer-Aided Detection and Diagnosis of Breast Cancer With Mammography: Recent Advances.:IEEE TRANSACTION ON INFORMATION TECHNOLOGY IN BIOMEDICAL VOL.13, NO2, MARCH 2009
[8] Robert A. McLaughlin, Bryden C. Quirk, Andrea Curatolo, Rodney W. Kirk, LorettaScolaro, Dirk Lorenser, Peter D. Robbins, Benjamin A. Wood, Christobel M. Saunders,and David D. Sampson.: Imaging of Breast Cancer With Optical Coherence Tomography Needle Probes: Feasibility and Initial Results.: IEEE JOURNAL OF SELECTED TOPICS IN QUANTUM ELECTRONICS, VOL. 18, NO. 3, MAY/JUNE 2012.
[9] Karthikeyan Ganesan, U. Rajendra Acharya, Chua Kuang Chua, Lim Choo Min, K. Thomas Abraham, and Kwan-Hoong Ng.: Computer-Aided Breast Cancer Detection Using Mammograms: A Review: IEEE REVIEWS IN BIOMEDICAL ENGINEERING, VOL. 6, 2013
[10] Mitko Veta∗, Josien P. W. Pluim, Paul J. van Diest, and Max A. Viergever “Breast Cancer Histopathology Image Analysis: A Review” IEEE TRANSACTIONS ON BIOMEDICA ENGINEERING, VOL. 61, NO. 5, MAY 2014
BIOGRAPHY