Evaluating Argumentative and Narrative Essays using Graphs
Swapna Somasundaran, Brian Riordan, Binod Gyawali and Su-Youn Yoon
Educational Testing Service 660 Rosedale Road, Princeton
NJ 08541, USA
{ssomasundaran,briordan,bgyawali,SYoon}@ets.org
Abstract
This work investigates whether the development of ideas in writing can be captured by graph properties derived from the text. Focusing on student essays, we represent the essay as a graph, and encode a variety of graph properties including PageRank as features for modeling essay scores related to quality of development. We demonstrate that our approach improves on a state-of-the-art system on the task of holistic scoring of persuasive essays and on the task of scoring narrative essays along the development dimension.
1 Introduction
Development, elaboration and exemplification are important writing skills that come into play in many different genres of writing. In a persuasive essay, to produce good arguments, it is important to substanti-ate a stance. Similarly, in a story, it is important to develop plot, character and events. Consequently, skill in development is evaluated in essay writing tasks at all levels of education, from primary school to the graduate level. For example, on the Graduate Record Examination (GRE), the scoring guidelines recom-mend that the top score be assigned to persuasive essays that “develop the position fully with compelling reasons and/or persuasive examples”1. Primary school assessments of narrative writing (i.e., stories and personal experiences, real or imagined) also test this skill. For instance, the scoring rubric for one of the U.S. Common Core State Standards tests2has a dimension for “elaboration and development”, where top scores are given to essays where “experiences, characters, settings and/or events are clearly developed”.
Previous research has investigated techniques for the automated assessment of essays by evaluating aspects of writing such as grammar, fluency, and coherence (Shermis and Burstein, 2013; Miltsakaki and Kukich, 2004; Attali and Burstein, 2006; Rus and Niraula, 2012; Stab and Gurevych, 2014b; Somasun-daran et al., 2014; Rahimi et al., 2015; Song et al., 2014; Farra et al., 2015). In this work, we investigate how to evaluate the development of ideas and exemplification. Specifically, we explore whether develop-ment is reflected in the structure of graphs constructed from the discourse proximity of essay concepts. We construct graphs for each essay where the essay’s concepts comprise the nodes and links are formed from concepts occurring in adjacent sentences. We then use properties of each graph, such as PageRank, to predict essay quality, including the quality of development. Our hypothesis is that this novel graph representation can help distinguish essays with well-developed ideas from essays lacking development and elaboration.
We test the effectiveness of our approach on two different essay datasets: holistically scored persuasive essays and trait-scored narrative essays. Our results demonstrate that graph-based features are useful across genres for essay scoring, and improve the performance of models for both holistic scoring and trait scoring. With the addition of these features, we are able to improve on the state of the art in essay scoring.
This work is licensed under a Creative Commons Attribution 4.0 International Licence. Licence details: http://creativecommons.org/licenses/by/4.0/
1https://www.ets.org/gre/revised general/prepare/analytical writing/issue/scoring guide 2http://sbac.portal.airast.org/wp-content/uploads/2015/03/Narrative-050814.pdf
The rest of the paper is organized as follows. Section 2 presents our intuitions, methods for graph construction, and features for scoring. Section 3 introduces our data. Experiments and analyses are in Sections 4 and 5, respectively. We discuss related work in Section 6 and conclude in Section 7.
2 Graphs for capturing development
In the process of developing a story or an argument, experienced writers provide detailed, illustrative examples. For example, consider a persuasive essay from Stab and Gurevych (2014a) responding to the prompt “In order to become integrated into society in their adopted countries, immigrants should abandon their old ways and adapt to local customs and codes of behavior. Do you agree or disagree?” The essay, a portion of which is shown in Example 1, takes a stance that immigrants should maintain their cultural identity.
Example 1. The last 50 years have seen an increasing number of immigrants to other countries... However I strongly believe that they are able to sustain their cultural identities and doing so help they keep their origin values.
Firstly, maintaining one’s cultural identity is a key important rule to help individuals emerge in the new multicultural envi-ronments. Take Australia for example, ...
Secondly, it is crucial to keep ones identity for they need a connection back to their country as well as teach their children their value of origin. For instance, children immigrated to a new country will face social troubles ...
To conclude, ...
The writer first takes a stance that immigrants should sustain their identities. He then presents a claim (“maintaining one’s cultural identity is a key important rule...”) and then develops this idea (“Take Australia for example, ...”). Once this example is discussed, the writer moves on to another claim and example. The writer concludes by reiterating the main stance.
Intuitively, the linguistic correlates of development are new words related to sub-topics and allied topics that writers introduce into the discourse to support or illustrate their main points. Rather than repeating the same vocabulary over and over, writers enrich the vocabulary of the essay as they develop examples. The discourse flow is also affected by development – when claims and examples are devel-oped, vocabulary associated with the main topic or stance is suspended, then revived when the discussion of the example is complete. In more detail, as the reader moves from sentence to sentence in an essay, he encounters concepts that either have been previously introduced or that are new to the discourse. When there is a repetition of ideas across the essay, the reader encounters the same concepts over and over again. On the other hand, when an example is introduced (e.g., to support a claim or to develop an idea), the reader encounters new concepts. As the example is developed further in successive sentences, the reader continues to move between concepts pertaining to this example and tends not to encounter concepts from the main topic of the essay. When the example is complete, the reader again encounters words pertaining to the main topic or stance. In a typical essay, this process repeats as the writer moves between presenting the main topic claims and detailed examples to develop the claims.
This type of development structure is also often evident in skillful narrative storytelling. After a character or situation is introduced, it may be described or fleshed out (via background information, vivid descriptions, etc.) before the writer returns to the main story line. The writer may briefly digress from the main goal of the story to add plot, character, and situation details.
2.1 Essay as a Graph
just once. Finally, multiple links between two nodes are collapsed into a single weighted link, where the weight is equal to the number of links between the two nodes.
We hypothesize that the structure of graphs constructed in this way can distinguish essays where there is no development from essays where ideas are developed in detail. For instance, if a writer repeats the same idea over and over, the corresponding graph will have nodes (corresponding to repeated ideas) that are heavily linked to other nodes. When an idea is not developed, the nodes corresponding to this idea will tend to have very few neighbors.
2.2 Graph Characteristics
Node degree The number of neighbors that a node has can indicate how it is connected to other con-cepts in the discourse. If a node has high degree, it is connected to more concon-cepts, indicating that it has occurred in more contexts. Similarly, a node with low degree is sparsely connected to other nodes, corresponding to a concept that is mentioned in passing, without being developed. A large number of such sparsely connected nodes in an essay might indicate underdeveloped ideas.
PageRank PageRank (Brin and Page, 1998) emulates a “random surfer” on a graph. In our graph, this random surfer will move from concept to concept. PageRank is influenced by both the number of nodes and by the structure of the graph.
The number of nodes in the graph is influenced by the number of unique concepts in an essay. When an essay is characterized by development, we expect that more concepts get introduced into the discourse. On the other hand, mere repetition will not increase the number of nodes in the graph. The larger the graph, the lower the PageRank value assigned to individual nodes (if link characteristics remain constant). Node count (i.e., unique concepts) remaining constant, the link structure of the graph is influenced by both development and repetition. When an example is well developed, the nodes corresponding to this development will form a well connected sub-graph. Consequently, there will be a shift in the distribution of PageRank values to reflect the fact that the random surfer is likely to visit these nodes with comparable probabilities as the nodes of the main theme or stance. When there is little development, PageRank values will be skewed and concentrated on a few nodes. Similarly, if an idea is repeated many times in the essay, the corresponding set of nodes will have very high connectivity, thus obtaining high PageRank values.
2.3 Graph Features
With the goal of encoding the graph characteristics described above, we developed 19 features: 6 features based on degree, one feature designed to capture the basic connectivity of the graph, and 12 features based on PageRank.
Features based on degree: We use three features to capture underdeveloped ideas: percentage of
nodes in the graph with degree one (perNodesDeg1), percentage of nodes in the graph with degree two (perNodesDeg2), and percentage of nodes in the graph with degree three (perNodesDeg3). A node can get one neighbor if everything in the previous and next sentence (except for one word type) gets filtered out. Recall that, during graph construction, words with fewer than 4 characters are filtered out as non-content. For example, the sentence “I can say in the end it may be all good” will have only one resulting node in the graph.
Two features encode the degree of the two top most connected nodes in the graph: degreeTop1 and
degreeTop2. A third feature, degreeMed, is the median degree and encodes the general connectivity structure of the graph. Finally, thestarScorefeature aims to capture the extent to which the graph has a star-like appearance: the number of links from the node with the highest degree divided by the total number of links in the graph.
larger graph (i.e., a graph with more nodes) will receive a smaller PageRank value. To mitigate this effect, we create a new set of PageRank-based features in which the values of the original PageRank features are multiplied by the total number of nodes in the graph, producing node count-normalized features. These features are: prTop1NodeNorm,prTop2NodeNormandprTop3NodeNormandprMedNodeNorm. While the 12 proposed features are correlated, in our experiments we use an Elastic Net learner (Zou and Hastie, 2005), which is designed for the case of groups of correlated features and performs automatic feature selection.
3 Data
To test our hypotheses, we carried out experiments in two different genres using two different datasets. The first dataset, persuasive, is comprised of 1000 persuasive essays written by test takers from a high stakes assessment. The essays are holistically scored on an integer scale from 1 to 6 (with score point 6 assigned to excellent essays). The data distribution for each score point is as follows: score 0 = 0.3%; score 1 = 2%; score 2 = 12.3%; score 3 = 42.3%; score 4 = 33.6%; score 5 = 8.4%; score 6 = 1.1%. Essays were scored by expert human annotators trained in operational essay scoring. Holistic scores were assigned based on writing proficiency displayed in analyzing an issue topic. Scores take into account a number of factors such as organization, development, language fluency, use of proper grammar, mechanics, and language conventions. With this dataset, we investigate if and how development in the form of developing a persuasive stance is captured by our approach.
The second dataset, narrative, is obtained from the CriterionR writing evaluation system3 and is
comprised of 590 narrative essays written by middle and high school students. These essays were scored based on a rubric developed by the Smarter Balanced Assessment Consortium4 for assessing narrative essays5. The rubrics assign three separate “trait” scores to each essay for the dimensions of Organization, Development, and Conventions. The scores for the Organization and Development traits are on an integer scale from 0 (“non-scorable”) to 4 (“excellent”), and the score for Conventions is on a 3 point scale from 0 (‘little or no command of conventions”) to 2 (“excellent”). The data distribution is as follows:
Organization: score 0 = 4.9%; score 1 = 5.4%; score 2 = 27.3%; score 3 = 32.0%; score 4 = 30.4%. Development: score 0 = 4.9%; score 1 = 6.6%; score 2 = 34.1%; score 3 = 28.5%; score 4 = 25.9%. Conventions: score 0 = 9.7%; score 1 = 47.1%; score 2 = 43.2%.
Inter-annotator agreement is calculated using quadratic weighted kappa (QWK) (Cohen, 1968). QWK for the three dimensions was: Organization = 0.726; Development = 0.741; Conventions = 0.459. Cor-relation between the dimension scores (Pearson’sr) are: Conventions and Organization = 0.41; Conven-tions and Development= 0.43; Organization and Development = 0.89. This dataset allows us to test if the proposed features work across different genres of writing. Additionally, as this data is scored separately along the development dimension, it allows us to test if our approach indeed captures development.
4 Experiments
We performed 10-fold cross validation experiments on thepersuasiveandnarrativedatasets to evaluate whether our proposed graph-based features help predict scores of essay quality and development. We used Gephi (Bastian et al., 2009) for generating the graph features listed in Section 2.3. All default parameters were used (epsilon, probability and number of iterations). We compared our proposed fea-tures with two baseline feature sets. Performance was measured with Quadratic Weighted Kappa (QWK) (Cohen, 1968), a common metric for measuring essay scoring performance. QWK scores are averaged across the 10 folds. We used a bootstrap significance test (Berg-Kirkpatrick et al., 2012; Zhang et al., 2004) to test if improvements over baselines are significant. We used the Elastic Net implementation from scikit-learn (Pedregosa et al., 2011)6.
3https://criterion.ets.org/ 4http://www.smarterbalanced.org
4.1 Baselines
e-rater Features (eRaterFeat) E-rater (Attali and Burstein, 2006), a state-of-the-art system for auto-matic essay scoring, uses a comprehensive set of features covering many aspects of writing quality, such as grammar, language use, mechanics, fluency, style, organization, and development. We use the e-rater feature set as a baseline and compare with our proposed features by employing the same learning algo-rithm over both feature sets. Development in eRaterFeat is captured by a feature that sums up the counts of the thesis, main points, supporting ideas, and conclusion elements in the essay, where the individual elements (e.g., supporting ideas) are identified in a separate step as described in Burstein et al. (2003).
We investigate how our graph-based features perform in comparison to the eRaterFeat feature set and in combination with it. Specifically, for holistic scoring, we hypothesize that graph features will improve over eRaterFeat performance by improving construct coverage. For trait scoring of development, we hypothesize that the based features will perform as well or better than eRaterFeat since the graph-based feature set is designed to capture this trait.
Lexical Diversity Baseline (lexdiv) As discussed in Section 2, development and exemplification in-troduce new concepts into the discourse. A simple measure of lexical diversity is the type-token ratio, the ratio of the count of unique word types to the count of word tokens in the essay. To ascertain whether the graph features do more than capture lexical diversity in the essay, we employ the type-token ratio as a baseline. We refer to this feature aslexdiv. While we do not expect this single feature to perform well by itself for holistic scoring, our goal is to test if its combination with eRaterFeat produces similar or better performance to that achieved by the combination of graph features to eRaterFeat.
4.2 Results
All features (baseline and proposed) are extracted for all essays in both datasets. For the persuasive
dataset, the features are used to predict the target holistic score. For thenarrativedataset, the features are used to train three separate systems, one for predicting each trait score.
Table 1 reports the results of the feature sets (individually and in combination) for holistic scoring of persuasive essays. Statistically significant improvements over eRaterFeat (E) are indicated with * for
p < 0.05 and ** for p < 0.005. All feature sets significantly outperform the lexdiv baseline (p <
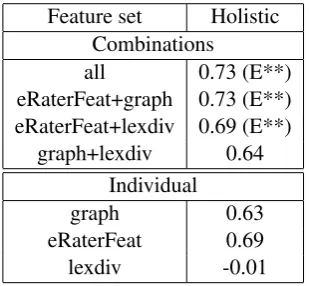
0.005); to reduce clutter, we omit these significance results in the tables. At the level of individual feature sets, eRaterFeat is the best performer. This is expected, as eRaterFeat uses a suite of features capturing a variety of language proficiency measures that the holistic score represents, while the graph-based (and lexdiv) features capture only one aspect of writing. The lexdiv baseline is a poor performer, not substantially improving the performance of any system or system combination to which it is added.
Notably, when graph features are added to eRaterFeat features (eRaterFeat+graph), there is a signif-icant boost in performance of 4 percentage points. This result is promising, as it indicates that graph features capture a part of the construct previously not covered in the state of the art.
Feature set Holistic Combinations
all 0.73 (E**) eRaterFeat+graph 0.73 (E**) eRaterFeat+lexdiv 0.69 (E**)
graph+lexdiv 0.64 Individual
graph 0.63
[image:5.595.86.241.573.716.2]eRaterFeat 0.69 lexdiv -0.01 Table 1: Performance (QWK) of feature sets on holistic scoring on the persuasive dataset. “all” = eRaterFeat+graph+lexdiv.
Feature set Conv. Org. Dev. Combinations
all 0.34 0.50 0.57 (E**) eRaterFeat+graph 0.36 0.51 0.57 (E**) eRaterFeat+lexdiv 0.37 0.50 0.54
graph+lexdiv 0.23 0.51 0.55 Individual
graph 0.24 0.51 0.56 (E*) eRaterFeat 0.36 0.49 0.52
[image:5.595.286.513.573.715.2]lexdiv -0.01 0.11 0.12
Table 2 reports the performance of the different feature sets and their combinations on trait scoring of narrative essays. In general, the QWK values are lower than those in Table 1, suggesting that scoring of stories is a much harder task. As expected, eRaterFeat is the best performing individual feature set for Conventions; graph and lexdiv features are not designed to score this aspect of writing. There is a slight improvement in eRaterFeat performance when lexdiv is added (eRaterFeat+lexdiv), but this improvement is not significant over eRaterFeat individually.
For Organization the graph features are the best performing individual feature set. In combination with eRaterFeat (eRaterFeat+graph), QWK remains the same. However, in neither case is there a statis-tically significant improvement. Nevertheless, this result is interesting, as it shows that graph features, while intended to capture development, are able to predict Organization scores at least as well as a well-established system. We believe this is presumably because the Organization and Development traits are correlated.
Confirming our hypothesis, the graph feature set is the best performer for scoring Development. The graph feature set individually improves on eRaterFeat by 4 percentage points, a significant difference (p < 0.05). This result is notable as it shows that the graph features indeed capture the Development construct much more effectively than the features in eRaterFeat. When graph and eRaterFeat features are combined (eRaterFeat+graph), there is an additional 1 point improvement over eRaterFeat alone.
5 Analysis
Our results provide strong evidence that the graph-based feature set is useful for essay scoring. In this section, we examine in more detail how the graph features are related to the Development score from the
narrativedataset.
5.1 Correlation Analysis
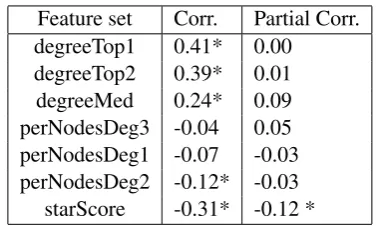
We employed correlation analysis to study the relationship of each of our graph features with Develop-ment trait scores. Table 3 lists the correlation (Pearson’sr) between each degree-based graph feature and its correlation with Development scores. All features exceptperNodeDeg1andperNodeDeg3have medium (> 0.3) to low (between 0.1 and 0.3) correlation with scores (significant atp < 0.005). The features encoding values of the higher degree of nodes,degreeTop1anddegreeTop2, are positively cor-related with scores. This indicates that the higher the connection of central ideas to other concepts, the better the development of the essay. Interestingly,starScoreis negatively correlated with Development scores, suggesting that essays where most of the links represent connections to a single idea have little or no development.
Feature set Corr. Partial Corr. degreeTop1 0.41* 0.00
degreeTop2 0.39* 0.01 degreeMed 0.24* 0.09 perNodesDeg3 -0.04 0.05 perNodesDeg1 -0.07 -0.03 perNodesDeg2 -0.12* -0.03
starScore -0.31* -0.12 *
Table 3: Correlation and partial correlation (controlling for length) of node degree-based features with Development trait scores. * = sig-nificant atp <0.005.
Feature set Corr. Partial Corr. prMedLog 0.63 * 0.35 * prTop3Log 0.57 * 0.31 * prTop2Log 0.56 * 0.30 * prTop1Log 0.52 * 0.27 * prTop3NodeNorm 0.49 * 0.09 prTop2NodeNorm 0.44 * 0.07 prTop1NodeNorm 0.41 * 0.05 prMedNodeNorm 0.06 0.10
[image:6.595.308.515.523.703.2]prTop1 -0.33 * -0.20 * prTop2 -0.41 * -0.22 * prTop3 -0.48 * -0.23 * prMed -0.48 * -0.26 *
Table 4: Correlation and partial correlation (con-trolling for length) of PageRank-based features with Development trait scores. * = significant at p <
[image:6.595.79.269.556.669.2]In Table 4 we see that all features based on PageRank, with the exception ofprMedNodeNorm, are moderately or highly correlated with development (p < 0.005). All of the raw PageRank features show a negative correlation with Development scores, which implies that the lower the highest PageRank values, better the development of the essay. This happens when: (1) there are more nodes in the graph (indicating a large number of concepts in the essay); (2) the links for a graph are more distributed. Such decentralization indicates that the writer emphasizes the detailed development of multiple concepts and tends not to repeat a single concept. The negative log and nodeNorm counterparts of the raw features are naturally positively correlated with the scores.
Indeed, it is impossible to develop an idea or character without using additional words. As a result, longer essays may receive higher scores. The graph-based features are also naturally affected by essay length. Nevertheless, it is informative to investigate if a feature has predictive value even after the effect of essay length is removed. Looking at the partial correlations (accounting for length) in Tables 3 and 4 (Partial Corr. column), the node degree-basedstarScorefeature and all PageRank-based features with the exception of *nodeNorm features retain their respective correlations with Development scores (p <0.005), albeit to a smaller degree.
5.2 Qualitative Analysis
To explore whether the graph features indeed encode the intuitions discussed in Section 2, we modified the contents of the sample essay discussed in Example 1 in various ways to simulate a lack of develop-ment and repetition of ideas. This essay is very similar to the persuasive essays in our dataset7. In each simulated essay, we maintained the length of the original as much as possible so that we could see the effect of the parameters we varied. We simulated different scenarios:
No development (no-dev):This simulates a scenario where the writer does not expand beyond the main stance or theme. We replaced the second and third paragraphs of the essay with the first paragraph (which contains the main stance).
Vague development (vague-dev): This simulates a scenario where the writer provides vague develop-ment for the main stance, but does not fully elaborate on the main claims. We deleted the examples in the second and third paragraphs (i.e., the text spans “Take Australia ...” and “For instance ...”, respectively). Note that this results in an essay that is smaller than the original.
Vague development with repetition (vague-dev-rep): This simulates a scenario where the writer reit-erates an idea multiple times, without substantially developing it. Similar to vague-dev, the text of the examples are deleted, but in this case they are replaced by the first sentence of the corresponding para-graph (“Firstly, ...” and “Secondly, ...”, respectively). The number of words approximately matches the original, so that the simulated essay is similar in length to the original.
essay length degreeTop1 degreeTop2 starScore prTop1Log prTop2Log prTop3Log prMedLog
original 2025 67 65 0.073 3.460 3.485 3.813 4.742
vague-dev-rep 2033 34 29 0.102 3.093 3.373 3.400 3.862
vague-dev 1005 33 28 0.115 3.031 3.204 3.218 3.929
no-dev 2026 24 24 0.155 2.697 2.697 3.200 3.200
Table 5: Graph-based feature values under different simulated conditions of essay development. length
= number of characters.
Table 5 shows several graph features computed from the different scenarios (we reproduce only a subset of features due to space limitations). Notice that all features show sensitivity to the type of devel-opment. The degree-based features (degreeTop1,degreeTop2) and PageRank-based features (prTop1Log,
prTop2Log,prTop3Log) rank the essays from worst to best in the order: no-dev, vague-dev, vague-dev-rep, original. These features rank the vague development (vague-dev) essay higher than no development (no-dev) essay, even though the latter is a longer essay. The starScorefeature ranks the essays in the same order, keeping in mind that this feature is negatively correlated with Development scores. The
prMedLogfeature, which is most highly correlated Development scores in Table 4, ranks vague
ment (vague-dev) higher than vague development with additional repetition (vague-dev-rep), penalizing repetition that contains the same amount of development.
6 Related Work
Entity-based approaches to discourse coherence focus on the distribution of entities in discourse, under the assumption that a patterned focus on discourse entities is indicative of greater topic continuity. Barzi-lay and Lapata (2008) formalize these intuitions to predict coherence. Their work has been extended in a number of ways, such as adding sentence-to-sentence sequences based on predicted discourse relations (Lin et al., 2011; Feng et al., 2014), adding information about topics (Elsner and Charniak, 2011), and incorporating other linguistic features (Eisner and Charniak, 2011). Burstein et al. (2010) employ this idea for evaluating coherence in student essays. Morris and Hirst (1991) connect highly related words in the discourse to create chains, which indicate cohesion of ideas in text. This idea is employed in the context of essay evaluation by Somasundaran et al. (2014) to capture discourse coherence quality. Our approach does not evaluate discourse coherence and does not employ cohesion-based relations. Rather, we use discourse-based proximity relations to evaluate the development of ideas.
Hearst’s TextTiling algorithm (Hearst, 1997) captures some elaboration of subtopics by measuring the differences of word profiles between discourse segments. Our work also captures the use of subtopics, but we do not address the issue of text segmentation.
Guinaudeau and Strube (2013) build a graph representation of entities and sentences to predict sen-tence ordering, summary coherence, and readability. Mesgar and Strube (2015) extend this graph repre-sentation by adding rhetorical relations, and use subgraph mining techniques improve readability clas-sification accuracy. Petersen et al. (2015) leverage the graph representation of Guinaudeau and Strube to compute a variety of graph-based metrics to measure coherence, including PageRank, and show that these features improve the relevance of IR results. In contrast with these lines of work, our graph structure only contains nodes for words, not sentences, and edges are inserted for words in consecutive sentences. Additionally, our goal is to predict essay scores, focusing on capturing the development trait.
In argumentative writing, it has been observed that support and elaboration plays an important role in overall comprehensibility (Garing, 2014; Duterte-Angeles, 2005). Miltsakaki and Kukich (2004) developed the concept of “rough shifts” in discourse and found that more rough shifts and less elaboration negatively correlated with essay score. In related work, O’Rourke et al. (2011) develop a method to measure the semantic or topic flow of essays. Rahimi et al. (2015) tie together the concepts of discourse coherence, essay organization, and argumentation for scoring short answers. Farra et al. (2015) evaluate whether a given opinion is topically relevant to the persuasive goal in student essays. These works are complementary to ours: while these approaches do not penalize repetition and lack of development, our approach is not sensitive to topicality and organization.
Stab and Gurevych (2014b) propose methods for identifying argumentation components in persuasive essays, including claims and premises. Peldszus and Stede (2015) demonstrate how the resulting graphs of argument components and their relations can be parsed into discourse structure. Song et al. (2014) as well as Ghosh et al. (2016) explore features specific to argumentation and argumentation schemes. While our features capture elaboration in persuasive essays, they are not tied to the specifics of argumentation, and we demonstrate the applicability of these features across genres. Along similar lines, previous work in narrative evaluation (Evanini and Wang, 2013; Hassanali et al., 2013; Somasundaran et al., 2015) explores features that are complementary to ours.
Within the area of predicting text quality more generally, researchers have focused on readability and text complexity using a variety of features such as entity grid features (Pitler and Nenkova, 2008), language model-based features (Kate et al., 2010; Feng et al., 2010), grade-level features (Qumsiyeh and Ng, 2011). Jiang et al. (2015) uses a graph representation to predict readability.
7 Conclusion
from the structure of essays. From our graph representation of word types and sentence-adjacency links, to capture development, we computed both graph structural features based on node degree and PageRank features. To the best of our knowledge, this is the first work on employing graphs to capture this aspect of writing.
We performed experiments to show that our approach complements previously established features in essay scoring. Specifically, we demonstrated that our feature set significantly improves on the state of the art for holistic essay scoring. For trait scoring, we showed that our features are more effective in capturing writing development than existing feature sets. As part of this investigation, we also explored automated scoring of narratives, a relatively less explored genre of student writing. Results across genres (persuasive and narrative) and scoring granularity (holistic and trait) demonstrated that graph-based features are effective at capturing development in writing.
In future work we plan to explore ways to incorporate and represent more information in the graphs, such as discourse relations, morphological variants, equivalence classes of semantically similar words and synonyms, as well as examine performance trends on publicly available essay datasets.
References
Yigal Attali and Jill Burstein. 2006. Automated essay scoring with e-rater v. 2.0. Journal of Technology, Learning, and Assessment, 4:3.
Regina Barzilay and Mirella Lapata. 2008. Modeling local coherence: An entity-based approach. Computational Linguistics, 34(1):1–34.
Mathieu Bastian, Sebastien Heymann, and Mathieu Jacomy. 2009. Gephi: An open source software for exploring and manipulating networks. InProceedings of International AAAI Conference on Weblogs and Social Media. Taylor Berg-Kirkpatrick, David Burkett, and Dan Klein. 2012. An empirical investigation of statistical
signif-icance in NLP. In Proceedings of the 2012 Joint Conference on Empirical Methods in Natural Language Processing and Computational Natural Language Learning, pages 995–1005. Association for Computational Linguistics.
Sergey Brin and Lawrence Page. 1998. The anatomy of a large-scale hypertextual web search engine. In Proceed-ings of Seventh International World-Wide Web Conference (WWW 1998).
Jill Burstein, Daniel Marcu, and Kevin Knight. 2003. Finding the write stuff: Automatic identification of discourse structure in student essays.IEEE Intelligent Systems, 18(1):32–39.
Jill Burstein, Joel Tetreault, and Slava Andreyev. 2010. Using entity-based features to model coherence in student essays. InProceedings of Human language technologies: The 2010 annual conference of the North Ameri-can chapter of the Association for Computational Linguistics, pages 681–684. Association for Computational Linguistics.
Jacob Cohen. 1968. Weighted kappa: Nominal scale agreement provision for scaled disagreement or partial credit.
Psychological Bulletin, 70(4):213.
S Duterte-Angeles. 2005. Coherence in the argumentative essays of ADZU college freshmen: A textual analysis of writing quality. Ph.D. thesis.
Micha Eisner and Eugene Charniak. 2011. Extending the Entity Grid with Entity-specific Features. In Proceed-ings of the 49th Annual Meeting of the Association for Computational Linguistics: Human Language Technolo-gies: short papers-Volume 2, pages 125–129. Association for Computational Linguistics.
Micha Elsner and Eugene Charniak. 2011. Disentangling Chat with Local Coherence Models. InProceedings of the 49th Annual Meeting of the Association for Computational Linguistics: Human Language Technologies-Volume 1, pages 1179–1189. Association for Computational Linguistics.
Keelan Evanini and Xinhao Wang. 2013. Automated speech scoring for non-native middle school students with multiple task types. InProceedings of Interspeech, pages 2435–2439.
Lijun Feng, Martin Jansche, Matt Huenerfauth, and Noemie Elhadad. 2010. A Comparison of Features for Automatic Readability Assessment. InProceedings of the 23rd International Conference on Computational Linguistics.
Vanessa Wei Feng, Ziheng Lin, Graeme Hirst, and Singapore Press Holdings. 2014. The impact of deep hierarchi-cal discourse structures in the evaluation of text coherence. InProceedings of the 25th International Conference on Computational Linguistics, pages 940–949.
Alphie G Garing. 2014. Coherence in Argumentative Essays of First-Year College of Liberal Arts Students at De La Salle University. InDLSU Research Congress.
Debanjan Ghosh, Aquila Khanam, Yubo Han, and Smaranda Muresan. 2016. Coarse-grained argumentation features for scoring persuasive essays. InProceedings of the 54th Annual Meeting of the Association for Com-putational Linguistics, pages 549–554.
Camille Guinaudeau and Michael Strube. 2013. Graph-based Local Coherence Modeling. InProceedings of the Association for Computational Linguistics, pages 93–103.
Khairun-nisa Hassanali, Yang Liu, and Thamar Solorio. 2013. Using Latent Dirichlet Allocation for child narrative analysis. InProceedings of the 2013 Workshop on Biomedical Natural Language Processing. Association for Computational Linguistics.
Marti A. Hearst. 1997. TextTiling: Segmenting Text into Multi-paragraph Subtopic Passages. Computational Linguistics, 23:33–64.
Zhiwei Jiang. 2015. A Graph-based Readability Assessment Method using Word Coupling. InProceedings of the 2015 Conference on Empirical Methods in Natural Language Processing, pages 411–420.
Rohit J Kate, Xiaoqiang Luo, Siddharth Patwardhan, Martin Franz, Radu Florian, Raymond J Mooney, Salim Roukos, and Chris Welty. 2010. Learning to predict readability using diverse linguistic features. In Pro-ceedings of the 23rd International Conference on Computational Linguistics, pages 546–554. Association for Computational Linguistics.
Ziheng Lin, Hwee Tou Ng, and Min-Yen Kan. 2011. Automatically evaluating text coherence using discourse relations. InProceedings of the 49th Annual Meeting of the Association for Computational Linguistics: Human Language Technologies-Volume 1, pages 997–1006.
Mohsen Mesgar and Michael Strube. 2015. Graph-based Coherence Modeling for Assessing Readability. In
Proceedings of Lexical and Computational Semantics (*SEM 2015), pages 309–318.
Eleni Miltsakaki and Karen Kukich. 2004. Evaluation of text coherence for electronic essay scoring systems.
Natural Language Engineering, 10(01):25–55.
Jane Morris and Graeme Hirst. 1991. Lexical cohesion computed by thesaural relations as an indicator of the structure of text.Computational linguistics, 17(1):21–48.
Stephen T. O’Rourke, Rafael A. Calvo, and Danielle S. McNamara. 2011. Visualizing Topic Flow in Students’ Essays.Educational Technology & Society, 14:4–15.
Fabian Pedregosa, Ga¨el Varoquaux, Alexandre Gramfort, Vincent Michel, Bertrand Thirion, Olivier Grisel, Math-ieu Blondel, Peter Prettenhofer, Ron Weiss, Vincent Dubourg, et al. 2011. Scikit-learn: Machine learning in Python.Journal of Machine Learning Research, 12:2825–2830.
Andreas Peldszus and Manfred Stede. 2015. Joint prediction in MST-style discourse parsing for argumentation mining. InProceedings of Empirical Methods in Natural Language Processing, pages 938–948.
Casper Petersen, Christina Lioma, Jakob Grue Simonsen, and Birger Larsen. 2015. Entropy and Graph Based Modelling of Document Coherence using Discourse Entities: An Application to IR. InProceedings of the 2015 International Conference on The Theory of Information Retrieval.
Emily Pitler and Ani Nenkova. 2008. Revisiting readability: A unified framework for predicting text quality. In
Proceedings of Empirical Methods in Natural Language Processing, pages 186–195.
Zahra Rahimi, Diane Litman, Elaine Wang, and Richard Correnti. 2015. Incorporating Coherence of Topics as a Criterion in Automatic Response-to-Text Assessment of the Organization of Writing. InProceedings of the 10th Workshop on Innovative Use of NLP for Building Educational Applications.
Vasile Rus and Nobal Niraula. 2012. Automated detection of local coherence in short argumentative essays based on centering theory. InComputational Linguistics and Intelligent Text Processing, pages 450–461. Springer. Mark D Shermis and Jill Burstein. 2013. Handbook of automated essay evaluation: Current applications and new
directions. Routledge.
Swapna Somasundaran, Jill Burstein, and Martin Chodorow. 2014. Lexical Chaining for Measuring Discourse Coherence Quality in Test-taker Essays. InProceedings of the 25th International Conference on Computational Linguistics.
Swapna Somasundaran, Chong Min Lee, Martin Chodorow, and Xinhao Wang. 2015. Automated scoring of picture-based story narration. InProceedings of the Tenth Workshop on Innovative Use of NLP for Building Educational Applications, pages 42–48.
Yi Song, Michael Heilman, Beata Beigman Klebanov, and Paul Deane. 2014. Applying argumentation schemes for essay scoring. InProceedings of the First Workshop on Argumentation Mining, pages 69–78, Baltimore, Maryland, June. Association for Computational Linguistics.
Christian Stab and Iryna Gurevych. 2014a. Annotating argument components and relations in persuasive essays. InProceedings of COLING 2014, the 25th International Conference on Computational Linguistics: Technical Papers, pages 1501–1510.
Christian Stab and Iryna Gurevych. 2014b. Identifying argumentative discourse structures in persuasive essays. InProceedings of Empirical Methods in Natural Language Processing, pages 46–56.
Ying Zhang, Stephan Vogel, and Alex Waibel. 2004. Interpreting bleu/nist scores: How much improvement do we need to have a better system? InProceedings of the Fourth International Conference on Language Resources and Evaluation (LREC), pages 2051–2054.