An Approach for Combining Content-based and Collaborative Filters
Qing Li
Dept. of Computer Sciences Kumoh National Institute of Technology Kumi, kyungpook, 730-701,South Korea
Byeong Man Kim Dept. of Computer Sciences Kumoh National Institute of Technology Kumi, kyungpook, 730-701,South Korea
Abstract
In this work, we apply a clustering tech-nique to integrate the contents of items into the item-based collaborative filtering framework. The group rating information that is obtained from the clustering result provides a way to introduce content in-formation into collaborative recommenda-tion and solves the cold start problem. Extensive experiments have been con-ducted on MovieLens data to analyze the characteristics of our technique. The re-sults show that our approach contributes to the improvement of prediction quality of the item-based collaborative filtering, especially for the cold start problem.
1 Introduction
There are two dominant research paradigms of in-formation filtering: content-based and collabora-tive filtering. Content-based filtering selects the right information for users by comparing represen-tations of searching information to represenrepresen-tations of contents of user profiles which express interests of users. Content-based information filtering has proven to be effective in locating textual items relevant to a topic using techniques, such as Boo-lean queries (Anick et al., 1990; Lee et al., 1993; Verhoeff et al., 1961), vector-space queries (Salton and Buckley, 1998), probabilistic model (Robert-son and Sparck, 1976), neural network (Kim and Raghavan, 2000) and fuzzy set model (Ogawa et
al., 1991). However, content-based filtering has some limitations:
• It is hard for content-based filtering to pro-vide serendipitous recommendations, be-cause all the information is selected and recommended based on the content.
• It is hard for novices to use content-based systems effectively.
Collaborative filtering is the technique of using peer opinions to predict the interests of others. A target user is matched against the database to dis-cover neighbors, who have historically had similar interests to target user. Items that neighbors like are then recommended to the target user. The Tap-estry text filtering system, developed by Nichols and others at the Xerox Palo Alto Research Center (PARC), applied collaborative filtering (Douglas, 1993; Harman, 1994). The GroupLens project at the University of Minnesota is a popular collabora-tive system. Collaboracollabora-tive systems have been widely used in so many areas, such as Ringo sys-tem recommends music albums (Upendar and Patti, 1995), MovieLens system recommends movies, Jeter system recommends jokes (Gupta et al., 1999) and Flycasting recommends online radio (Hauver, 2001).
Collaborative filtering system overcomes some limitations of content-based filtering. The system can suggest items (the things to be recommended, such as books, music etc.) to users and recommen-dations are based on the ratings of items, instead of the contents of the items, which can improve the quality of recommendations. Although collabora-tive filtering has been successfully used in both research and practice, there still remain some chal-lenges for it as an efficient information filtering. This work was supported by Korea Research Foundation
• Cold start problem, where recommendations are required for items that no user has yet rated.
• Although collaborative filtering can improve the quality of recommendations based on the user ratings, it completely denies any infor-mation that can be extracted from contents.
It is obvious that the content-based filtering does not suffer the above problems. So it is a natu-ral way to combine them in order to achieve a bet-ter performance of filbet-tering, and take the advantages of each.
The rest of the paper is organized as follows. The next section provides a brief describing of re-lated work. In section 3, we present the detail algo-rithmic components of our approach, and look into the methods of grouping items, calculating the similarities between items and solving the cold start problem. Section 4 describes our experimental work. It provides details of our data sets, evalua-tion metrics, results of our experiment and discus-sion of the results. The final section provides some concluding remarks.
2 Related work
Proposed approaches to hybrid system, which combines content-based and collaborative filters together, can be categorized into two groups.
One group is the linear combination of results of collaborative and content-based filtering, such as systems that are described by Claypool (1999) and Wasfi (1999). ProfBuilder (Wasfi, 1999) rec-ommends web pages using both content-based and collaborative filters, and each creates a recommen-dation list without combining them to make a combined prediction. Claypool (1999) describes a hybrid approach for an online newspaper domain, combining the two predictions using an adaptive weighted average: as the number of users access-ing an item increases, the weight of the collabora-tive component tends to increase. But how to decide the weights of collaborative and content-based components is unclearly given by the author. The other group is the sequential combination of content-based filtering and collaborative filter-ing. In this system, firstly, content-based filtering algorithm is applied to find users, who share simi-lar interests. Secondly, collaborative algorithm is applied to make predictions, such as RAAP (Delgado et al., 1998) and Fab filtering systems
(Balabanovic and Shoham, 1990). RAAP is a con-tent-based collaborative information filtering for helping the user to classify domain specific infor-mation found in the WWW, and also recommends these URLs to other users with similar interests. To decide the similar interests of users is using scal-able Pearson correlation algorithm based on web page category. Fab system, which uses content-based techniques instead of user ratings to create profiles of users. So the quality of predictions is fully depended on the content-based techniques, inaccurate profiles result in inaccurate correlations with other users and thus make poor predictions.
As for collaborative recommendation, there are two ways to calculate the similarity for clique rec-ommendation – item-based and user-based. Sarwar (Sarwar et al, 2001) has proved that item-based collaborative filtering is better than user-based col-laborative filtering at precision and computation complexity.
Figure1. Overview of the our approach
3 Overview of our approach
In this paper, we suggest a technique that intro-duces the contents of items into the item-based collaborative filtering to improve its prediction quality and solve the cold start problem. Shortly, we call the technique ICHM (Item-based Cluster-ing Hybrid Method).
In ICHM, we integrate the item information and user ratings to calculate the item-item similarity. Figure 1 shows this procedure. The detail proce-dure of our approach is described as follows:
• Apply clustering algorithm to group the items, then use the result, which is repre-sented by the fuzzy set, to create a group-rating matrix.
• Compute the similarity: firstly, calculate the similarity of group-rating matrix using ad-justed-cosine algorithm, then calculate the similarity of item-rating matrix using Pear-son correlation-based algorithm. At last, the Rating Data
+ ratingItem
Collaborative filter Group
rating
Group
rater Clustering
Item content
total similarity is the linear combination of the above two.
• Make a prediction for an item by perform-ing a weighted average of deviations from the neighbour’s mean.
3.1 Group rating
The goal of grouping ratings is to group the items into several cliques and provides content-based information for collaborative similarity calculation. Each item has it’s own attribute features, such as movie item, which may have actor, actress, direc-tor, genre, and synopsis as its attribute features. Thus, we can group the items based on them.
The algorithm that is applied for grouping rat-ings is derived from K-means Clustering Algo-rithm (Han and Kamber, 2000). The difference is that we apply the fuzzy set theory to represent the affiliation between object and cluster. As shown in Figure 2, firstly, items are grouped into a given number of clusters. After completion of grouping, the probability of one object j (here one object means one item) to be assigned to a certain cluster is calculated as follows.
( , )
Pr ( , ) 1 - (1) ( , )
CS j k o j k
MaxCS i k
=
where Pr ( , )o j k means the probability of object j to be assigned to cluster k ; The CS j k( , ) means the function to calculate the counter-similarity be-tween object j and cluster k ; Max CS i k ( , )means the maximum counter-similarity between an object and cluster k.
Input : the number of clusters k and item attributes Output: a set of kclusters that minimizes the squared-error criterion, and the probability of each item to be assigned to each cluster center, which are represented as a fuzzy set.
(1) Arbitrarily choose k objects as the initial cluster centers
(2) Repeat (a) and (b) until no change
(a) (Re) assign each object to the cluster to which the object is the most similar, based on the mean value of the objects in the cluster
(b) Update the cluster means, i.e., calculate the mean value of the objects of each cluster;
(3) Compute the probability between objects and each cluster center.
Figure 2. Algorithm for grouping ratings
The counter-similarity CS j k( , ) can be calcu-lated by Euclidean distance or Cosine method.
3.2 Similarity computation
As we can see, after grouping the items, we get a new rating matrix. We can use the item-based col-laborative algorithm to calculate the similarity and make the predictions for users.
There are many ways to compute the similarity. In our approach, we use two of them, and make a linear combination of their results.
3.2.1 Pearson correlation-based similarity
The most common measure for calculating the similarity is the Pearson correlation algorithm. Pearson correlation measures the degree to which a linear relationship exists between two variables. The Pearson correlation coefficient is derived from a linear regression model, which relies on a set of assumptions regarding the data, namely that the relationship must be linear, and the errors must be independent and have a probability distribution with mean 0 and constant variance for every set-ting of the independent variable (McClave and Dietrich, 1998).
, ,
1
2 2
, ,
1 1
( )( )
cov( , )
( , ) (2)
( ) ( )
m
u k k u l l
u
m m
k l
u k k u l l
u i
R R R R
k l sim k l
R R R R
σ σ =
= =
− −
= =
− −
∑
∑
∑
where sim k l( , ) means the similarity between item
k andl; m means the total number of users, who rated on both item k and l;Rk, Rl are the average
ratings of item k and l , respectively;
,
u k
R ,Ru l, mean the rating of user uon item k andl
respectively.
3.2.2 Adjust cosine similarity
, , 1
2 2
, ,
1 1
( )( )
( , ) (3)
( ) ( )
m
u k u u l u
u
m m
u k u u l u
u u
R R R R
sim k l
R R R R
=
= =
− −
=
− −
∑
∑
∑
where sim k l( , ) means the similarity between item
k andl; m means the total number of users, who rates on both item k and l;Ru are the average
rat-ings of user u;Ru k, ,Ru l, mean the rating of user uon
item k andl respectively.
3.2.3 Linear combination of similarity
Due to difference in value range between item-rating matrix and group-item-rating matrix, we use dif-ferent methods to calculate the similarity. As for item-ratings matrix, the rating value is integer; As for group-rating matrix, it is the real value ranging from 0 to 1. The natural way is to enlarge the con-tinuous data range from [0 1] to [1 5] or reduce the discrete data range from [1 5] to [0 1] and then ap-ply Pearson correlation-based algorithm or ad-justed cosine algorithm to calculate similarity. We call this enlarged ICHM. We also propose another method: firstly, use Pearson correlation-based al-gorithm to calculate the similarity from item-rating matrix, and then calculate the similarity from group-rating matrix by adjusted cosine algorithm, at last, the total user similarity is linear combina-tion of the above two, we call this combination ICHM.
( , ) ( , )item (1- ) ( , )group (4)
sim k l =sim k l × c +sim k l ×c
where sim k l( , ) means the similarity between item
k and l ; c means the combination coefficient; ( , )item
sim k l means that the similarity between item
kand l, which is calculated from item-rating ma-trix; sim k l( , )groupmeans that the similarity between
item k and l , which is calculated from group-rating matrix.
3.3 Collaborative prediction
Prediction for an item is then computed by per-forming a weighted average of deviations from the neighbour’s mean. Here we use top N rule to se-lect the nearest N neighbours based on the simi-larities of items. The general formula for a prediction on item kof user u(Resnick et al., 1994) is:
, 1 ,
1
( ) ( , )
(5) ( , )
n
u i i
i
u k k n
i
R R sim k i
P R
sim k i
=
=
− × = +
∑
∑
where Pu k, represents the predication for the user
uon itemk; n means the total neighbours of item
k; Ru i, means the user u rating on item i; Rk is the
average ratings on item k; sim k i( , ) means the simi-larity between item k and its’ neighbour i ; Ri
means the average ratings on item i.
3.4 Cold start problem
In traditional collaborative filtering approach, it is hard for pure collaborative filtering to recommend a new item to user since no user made any rating on this new item. However, in our approach, based on the information from group-rating matrix, we can make predictions for the new item. In our ex-periment, it shows a good recommendation per-formance for the new items. In Equation 5, Rk is
the average rating of all ratings on item k. As for the new item, no user makes any rating on it, Rk
should be the zero. Since Rk is the standard
base-line of user ratings and it is zero, it is unreasonable for us to apply Equation 5 to new item. Therefore, for a new item, we use the Rneighbors, the average
rat-ing of all ratrat-ings on the new item’s nearest neighbour instead of Rk, which is inferred by the
group-rating matrix.
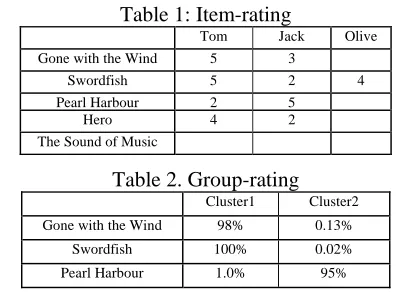
3.5 A scenario of our approach
Users:
Number of users: three
User name: Tom, Jack, and Oliver Items:
Item category: movie Number of items: five
Title of items: Gone with the Wind, Pearl Harbour, Swordfish, Hero, The Sound of Music
Ratings: 1~5 integer score
[image:4.595.312.510.590.736.2]Too bad:1 Bad:2 Common:3 Good:4 too good:5
Table 1: Item-rating
Tom Jack Olive Gone with the Wind 5 3
Swordfish 5 2 4
Pearl Harbour 2 5
Hero 4 2
The Sound of Music
Table 2. Group-rating
Cluster1 Cluster2 Gone with the Wind 98% 0.13%
Hero 95% 1.2% The Sound of Music 0.12% 98%
The following is a procedure of our approach.
• Based on the item contents, such as movie genre, director, actor, actress, even synopsis, we apply clustering algorithm to group the items. Here, we use fuzzy set to represent the clustering result. Assume the result is as follows: Cluster 1: {Gone with the Wind (98%), Swordfish (100%), Pearl Harbour (1.0%), Hero (95%), The Sound of Music (0.12%)}, Cluster 2: {Gone with the Wind (0.13%), Swordfish (0.02%), Pearl Harbour (95%), Hero (1.2%), The Sound of Music (98%)}, the number in the parenthesis fol-lowing the movie name means the probabil-ity of the movie belonging to the cluster.
• We use group-rating engine to make a group-rating matrix. As Table 2 shows. Then combine the group-rating matrix and item-rating matrix to form a new rating ma-trix.
• Now, we can calculate the similarity be-tween items based on this new unified rating data matrix. The similarity between items consists of two parts. The first part calcu-lates the similarity based on user ratings, us-ing the Pearson correlation-based algorithm. The second part calculates the similarity based on the clustering result by using ad-justed cosine algorithm. The total similarity between items is the linear combination of them. For example, when we calculate the similarity between Gone with the Wind and
Swordfish, firstly, sim(G,S)itemand sim(G,S)group
are calculated based on Equation 2 and 3 separately.
item
2 2 2 2
(5-4) (5-3.5)+(3-4) (2-3.5)
sim(G,S) = 1
(5-4) +(3-4) (5-3.5) +(3.5-2)
× × =
×
group
2 2 2 2
sim(G,S) =
(0.98-0.59) (1-0.59)+(0.013-0.39) (0.002-0.39)
(0.98-0.59) +(0.013-0.39) (1-0.59) +(0.002-0.39)
0.9999
× ×
=
Secondly, sim(G,S) is calculated based on Formula 4, here the combination coefficient is 0.4.
sim(G,S)=1 (1-0.4)+0.9999 0.4=0.9999 × ×
• Then, predictions for items are calculated by performing a weighted average of deviations from the neighbour’s mean.
In the example, we can observe, the item - The Sound of Music, which no one make any rating on, can be treated as a new item. In traditional item-based collaborative method, which makes predic-tion only based on item-based matrix (Table 1), it is impossible to make predictions on this item. However, in our approach, we can make prediction for users, based on group rating (Table 2).
From the description of our approach, we can observe that this approach can fully realize the strengths of content-based filtering, mitigating the effects of the new user problem. In addition, when calculating the similarity, our approach considers the information not only from personal tastes but also from the contents, which provides a latent ability for better prediction and makes serendipi-tous recommendation.
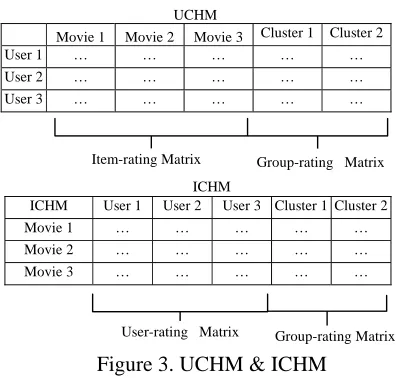
3.6 UCHM
UCHM
Movie 1 Movie 2 Movie 3 Cluster 1 Cluster 2
User 1 … … …
User 2 … … …
User 3 … … …
ICHM
ICHM User 1 User 2 User 3 Cluster 1 Cluster 2
Movie 1 … … …
Movie 2 … … …
[image:5.595.309.507.379.568.2]Movie 3 … … …
Figure 3. UCHM & ICHM
Clustering technique not only can be applied to item-based collaborative recommenders but also can be applied to user-based collaborative recom-menders. Shortly we call the late one UCHM
(User-based Clustering Hybrid Method)
In UCHM, clustering is based on the attributes of user profiles and clustering result is treated as items. However, in ICHM, clustering is based on the attributes of items and clustering result is treated as users, as Figure 3 shows.
In Combination UCHM, we apply Equation 2 to calculate the similarity in user-rating matrix, and
Equation 3 to calculate the similarity in group-rating matrix. Then make a linear combination of them. When we apply Equation 2 and 3 to UCHM,
k and l mean the user and umeans the item, in-stead the original meaning.
As for UCHM, clustering is based on the user profiles. User profiles indicate the information needs or preferences on items that users are inter-ested in. A user profile can consist of several pro-file vectors and each propro-file vector represents an aspect of his preferences, such as movie genre, director, actor, actress and synopsis. The profile vectors are automatically constructed from rating data by the following simple equation.
( ) A = m n/ 8
where, n is the number of items whose ranking value is lager than a given threshold, m is the num-ber of items containing attribute A among n items and its ranking is larger than threshold. In our ex-periment, we set the value of the threshold as 3. For example, in Section 3.5, Tom makes ratings on four movies, and three of them lager than the threshold 3. From the genre information, we know
Gone with the Wind belongs to love genre, sword-fish and Hero belong to action genre. So Tom’s profile is as follows. Tom {love (1/3), action (2/3)}.
4 Experimental evaluations
4.1 Data set
Currently, we perform experiment on a subset of movie rating data collected from the MovieLens web-based recommender. The data set contained 100,000 ratings from 943 users and 1,682 movies, with each user rating at least 20 items. We divide data set into a training set and a test data set.
4.2 Evaluation metrics
MAE (Mean Absolute Error) has widely been used in evaluating the accuracy of a recommender sys-tem by comparing the numerical recommendation scores against the actual user ratings in the test data. The MAE is calculated by summing these absolute errors of the corresponding rating-prediction pairs and then computing the average.
, , 1
(7)
n
u i u i
u P R
MAE
n
= −
=
∑
where Pu i, means the user uprediction on item i;
,
u i
R means the user u rating on item i in the test
data; nis the number of rating-prediction pairs be-tween the test data and the prediction result. The lower the MAE, the more accurate.
4.3 Behaviours of our method
0.735 0.745 0.755 0.765 0.775
0 5 10 20 30 40 50 60 70 No. of Clusters
MAE
[image:6.595.306.519.182.291.2]ICHM UCHM
Figure 4. Sensitivity of the cluster size
[image:6.595.307.515.390.506.2]We implement group-rating method described in section 3.1 and test them on MovieLens data with the different number of clusters. Figure 4 shows the experimental results. It can be observed that the number of clusters does affect the quality of pre-diction, no matter in UCHM or ICHM.
Figure 5. Coefficient
In order to find the optimal combination coeffi-cient c in the Equation 4, we conducted a series of experiments by changing combination coefficient from 0 to 1 with a constant step 0.1. Figure 5 shows that when the coefficient arrives at 0.4, an optimal recommendation performance is achieved.
0.73 0.735 0.74 0.745 0.75 0.755 0.76
10 20 30 40 50 60 NO.of Neigbors
MAE
Cosine Angle Euclidean Distance
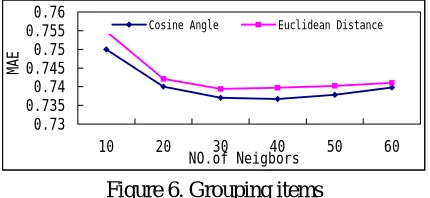
Figure 6. Grouping items
As described in Section 3.2, our grouping rat-ings method needs to calculate similarity between
0.73 0.74 0.75 0.76 0.77 0.78
0.1 0.2 0.3 0.4 0.5 0.6 0.7 0.8 0.9 1
Coefficient
MAE
[image:6.595.308.523.594.693.2]objects and clusters. So, we try two methods – one is Euclidean distance and the other cosine angle. It can be observed in Figure 6 that the approach of cosine angle method has a trend to show better per-formance than the Euclidean Distance method, but the difference is negligible.
Figure 7. Comparison
From the Figure 7, it can be observed that the performance of combinationICHM is the best, and the second is the enlarged ICHM, which is fol-lowed by the item-based collaborative method, the last is UCHM (User-based Clustering Hybrid Method) which applies the clustering technique described in Section 3 to user-based collaborative filtering, where user profiles are clustered instead of item contents.
We also can observe that the size of neighbour-hood does affect the quality of prediction (Her-locker et al., 1999). The performance improves as we increase the neighbourhood size from 10 to 30, then tends to be flat.
1 2 3 4 5
1 2 3 4 5 6 7 8 9 10 11
Movie items
Ratings
[image:7.595.76.284.187.299.2]Real Value Predict Value
Figure 8. Cold start problem
Table 3. MAE of new item
10 20 30 40 50 100
MAE 0.743 0.755 0.812 0.732 0.762 0.757
As for cold start problem, we choose the items from the training data set and delete all the ratings of those items, thus we can treat them as new items. First, we randomly selected item No.946. In the test data, user No.946 has 11 ratings, which is de-scribed by bar real value in Figure 8. We can ob-serve that the prediction for a new item can partially reflect the user preference. To generalize
the observation, we randomly select the number of items from 10 to 50 with the step of 10 and 100 from the test data, and delete all the ratings of those items and treat them as new items. Table 3 shows that ICHM can solve the cold start problem.
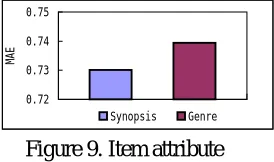
0.72 0.73 0.74 0.75
MAE
Synopsis Genre
Figure 9. Item attribute
When we apply clustering method to movie items, we use the item attribute – movie genre. However, our approach can consider more dimen-sion of item attribute, such as actor, actress, and director, even the synopsis. In order to observe the effect of the high dimension item attributes, we collect the 100 movie synopsis from Internet Movie Database (http://www.imdb.com) to provide attribute information for clustering movies. In our experiment, it shows that the correct attributes of movies can further improve the performance of recommender system, as Figure 9 shows.
4.4 Our method versus the classic one
Although some hybrid recommender systems have already exited, it is hard to make an evaluation among them. Some systems (Delgado et al., 1998) use Boolean value (relevant or irrelevant) to repre-sent user preferences, while others use numeric value. The same evaluation metrics cannot make a fair comparison. Further more, the quality of some systems depends on the time, in which system pa-rameters are changed with user feedback (Claypool et al., 1999), and Claypool does not clearly de-scribe how to change the weight with time passed. However, we can make a simple concept compari-son. In Fab system, the similarity for prediction is only based on the user profiles. As for UCHM, which groups the content information of user pro-files and uses user-based collaborative algorithm instead of ICHM, the impact of combination coef-ficient can be observed in Figure 5. In UCHM, when the value of coefficient equals to 1, it de-scribes condition that Fab applied, which means the similarity between users is only calculated from the group-rating matrix. In that condition, the MAE shows the worst quality of recommendation.
0.735 0.745 0.755 0.765 0.775
10 20 30 40 50 60 70 80 90 100
No. of neighbors
MAE
[image:7.595.77.286.484.625.2]5 Conclusions
We apply clustering technique to the item content information to complement the user rating infor-mation, which improves the correctness of collabo-rative similarity, and solves the cold start problem. Our work indicates that the correct application of the item information can improve the recommendation performance.
References
Anick, P. G., Brennan, J. D., Flynn, R. A., Hanssen, D. R., Alvey, B. and Robbins, J.M.. 1990. A Direct Ma-nipulation Interface for Boolean Information Re-trieval via Natural Language Query, In Proc. ACM-SIGIR Conf., pp.135-150.
Balabanovic, M. and Shoham, Y.. 1997. Fab: Content-Based, Collaborative Recommendation, Communica-tions of the ACM, 40(3), pp.66-72.
Claypool, M., Gokhale, A., Miranda, T., Murnikov, P., Netes, D. and Sartin, M.. 1999. Combining content-based and collaborative filters in an online newspa-per , In Proc. ACM-SIGIR Workshop on Recom-mender Systems: Algorithms and Evaluation. Delgado, J., Ishii, N. and Ura, T.. 1998. Content-based
Collaborative Information Filtering: Actively Learn-ing to Classify and Recommend Documents, In Proc. Second Int. Workshop, CIA'98, pp.206-215.
Douglas B. Terry. 1993. A tour through tapestry, In Proc. ACM Conf. on Organizational Computing Sys-tems (COOCS). pp.21—30.
Gupta, D., Digiovanni, M., Narita, H. and Goldberg, K.. 1999. Jester 2.0: A New Linear-Time Collaborative Filtering Algorithm Applied to Jokes, In Proc. ACM-SIGIR Workshop on Recommender Systems: Algo-rithms and Evaluation.
Han, J., and Kamber, M.. 2000. Data mining: Concepts and Techniques. New York: Morgan-Kaufman. Harman D.. 1994. Overview of TREC-3, In
Proc.TREC-3, pp.1-19.
Hauver, D. B.. 2001. Flycasting: Using Collaborative Filtering to Generate a Play list for Online Radio, In Int. Conf. on Web Delivery of Music.
Herlocker, J., Konstan, J., Borchers A., and Riedl, J.. 1999. An algorithmic framework for performing col-laborative Filtering, In Proc. ACM-SIGIR Conf., 1999, pp. 230-237.
Kim, M. and Raghavan, V.V.. 2000. Adaptive concept-based retrieval using a neural network, In Proc. Of
ACM-SIGIR Workshop on Mathematical/Formal Methods in IR.
McClave, J. T. and Dietrich, F. H.. 1998. Statistics. San Francisco: Ellen Publishing Company.
Lee, J.H., Kim, M.H. and Lee, Y.H.. 1993. Ranking documents in thesaurus-based Boolean retrieval sys-tems, Information Processing and Management, 30(1), pp.79-91.
Oard, D.W. and Marchionini, G.. 1996. A conceptual framework for text filtering, Technical Report EE-TR-96-25, CAR-TR-830, CS-TR3643.
Ogawa, Y., Morita, T. and Kobayashi, K.. 1991. A fuzzy document retrieval system using the keyword connec-tion matrix and a learning method, Fuzzy sets and Systems, 1991, pp.39, pp.163-179.
O'Conner, M. and Herlocker, J.. 1999. Clustering items for collaborative filtering, In Proc. ACM-SIGIR Workshop on Recommender Systems.
Resnick, P., Iacovou, N., Suchak, M., Bergstorm, P. and Riedl, J.. 1994. GroupLens: An open architecture for collaborative filtering of Netnews, In Proc. ACM Conf. on Computer-Supported Cooperative Work. pp.175-186.
Ricardo Baeza-Yates, Berthier Riberio-Neto. 1999. Modern Information Retrieval. New York:Addison-Wesley Publishers.
Robertson S. E. and Sparck Jones K.. 1976. Relevance weighting of search terms, J. of the American Society for Information Science, 1976, pp.27, pp.129-146. Salton, G. and Buckley, C.. 1988. Term-weight
ap-proaches in automatic retrieval, Information Proc-essing and Management, 24(5), 1988, pp.513-523. Sarwar, B. M., Karypis, G., Konstan, J. A. and Riedl, J..
2001. Item-based Collaborative Filtering Recom-mendation Algorithms, In Proc. Tenth Int. WWW Conf. 2001, pp. 285-295.
Upendra, S. and Patti, M.. 1995. Social Information Filtering: Algorithms for Automating "Word of Mouth", In Proc. ACM CHI'95 Conf. on Human Fac-tors in Computing Systems. pp.210—217.
Verhoeff, J., Goffman, W. and Belzer, J.. 1961. Ineffi-ciency of the use of the boolean functions for infor-mation retrieval systems, Communications of the ACM, 4, pp.557--558, pp.594.