O
RANGE: a Method for Evaluating Automatic Evaluation Metrics
for Machine Translation
Chin-Yew Lin and Franz Josef Och Information Sciences Institute University of Southern California
4676 Admiralty Way Marina del Rey, CA 90292, USA
{cyl,och}@isi.edu
Abstract
Comparisons of automatic evaluation metrics for machine translation are usually conducted on corpus level using correlation statistics such as Pearson’s product moment correlation coefficient or Spearman’s rank order correlation coefficient between human scores and automatic scores. However, such comparisons rely on human judgments of translation qualities such as adequacy and fluency. Unfortunately, these judgments are often inconsistent and very expensive to acquire. In this paper, we introduce a new evaluation method, ORANGE, for evaluating automatic machine translation evaluation metrics automatically without extra human involvement other than using a set of reference translations. We also show the results of comparing several existing automatic metrics and three new automatic metrics using ORANGE.
1 Introduction
To automatically evaluate machine translations, the machine translation community recently adopted an n-gram co-occurrence scoring procedure BLEU (Papineni et al. 2001). A similar metric, NIST, used by NIST (NIST 2002) in a couple of machine translation evaluations in the past two years is based on BLEU. The main idea of BLEU is to measure the translation closeness between a candidate translation and a set of reference translations with a numerical metric. Although the idea of using objective functions to automatically evaluate machine translation quality is not new (Su et al. 1992), the success of BLEU prompts a lot of interests in developing better automatic evaluation metrics. For example, Akiba et al. (2001) proposed a metric called RED based on edit distances over a set of multiple references. Nießen et al. (2000) calculated the length-normalized edit distance, called word error rate (WER), between a candidate and multiple
reference translations. Leusch et al. (2003) proposed a related measure called position-independent word error rate (PER) that did not consider word position, i.e. using bag-of-words instead. Turian et al. (2003) introduced General Text Matcher (GTM) based on accuracy measures such as recall, precision, and F-measure.
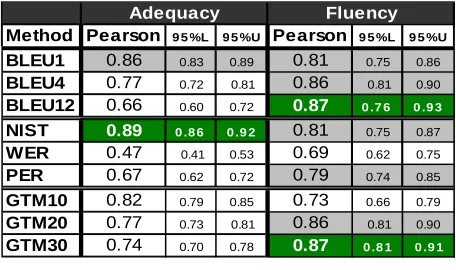
With so many different automatic metrics available, it is necessary to have a common and objective way to evaluate these metrics. Comparison of automatic evaluation metrics are usually conducted on corpus level using correlation analysis between human scores and automatic scores such as BLEU, NIST, WER, and PER. However, the performance of automatic metrics in terms of human vs. system correlation analysis is not stable across different evaluation settings. For example, Table 1 shows the Pearson’s linear correlation coefficient analysis of 8 machine translation systems from 2003 NIST Chinese-English machine translation evaluation. The Pearson’ correlation coefficients are computed according to different automatic evaluation methods vs. human assigned adequacy and fluency. BLEU1, 4, and 12 are BLEU with maximum n-gram lengths of 1, 4, and 12 respectively. GTM10, 20, and 30 are GTM with exponents of 1.0, 2.0, and 3.0 respectively. 95% confidence intervals are estimated using bootstrap resampling (Davison and Hinkley 1997). From the BLEU group, we found that shorter BLEU has better adequacy correlation while longer BLEU has better fluency correlation. GTM with smaller exponent has better adequacy correlation and GTM with larger exponent has better fluency correlation. NIST is very good in adequacy correlation but not as good as GTM30 in fluency correlation. Based on these observations, we are not able to conclude which metric is the best because it depends on the manual evaluation criteria. This results also indicate that high correlation between human and automatic scores in both adequacy and fluency cannot always been achieved at the same time.
(dark/green cells). However, many metrics are statistically equivalent (gray cells) to them when we factor in the 95% confidence intervals. For example, even PER is as good as BLEU12 in adequacy. One reason for this might be due to data sparseness since only 8 systems are available.
The other potential problem for correlation analysis of human vs. automatic framework is that high corpus-level correlation might not translate to high sentence-level correlation. However, high sentence-level correlation is often an important property that machine translation researchers look for. For example, candidate translations shorter than 12 words would have zero BLEU12 score but BLEU12 has the best correlation with human judgment in fluency as shown in Table 1.
In order to evaluate the ever increasing number of automatic evaluation metrics for machine translation objectively, efficiently, and reliably, we introduce a new evaluation method: ORANGE.We describe ORANGE in details in Section 2 and briefly introduce three new automatic metrics that will be used in comparisons in Section 3. The results of comparing several existing automatic metrics and the three new automatic metrics using ORANGE will be presented in Section 4. We conclude this paper and discuss future directions in Section 5.
2 ORANGE
Intuitively a good evaluation metric should give higher score to a good translation than a bad one. Therefore, a good translation should be ranked higher than a bad translation based their scores. One basic assumption of all automatic evaluation metrics for machine translation is that reference translations are good translations and the more a machine translation is similar to its reference translations the better. We adopt this assumption and add one more assumption that automatic translations are usually worst than their reference
translations. Therefore, reference translations should be ranked higher than machine translations on average if a good automatic evaluation metric is used. Based on these assumptions, we propose a new automatic evaluation method for evaluation of automatic machine translation metrics as follows:
Given a source sentence, its machine translations, and its reference translations, we compute the average rank of the reference translations within the combined machine and reference translation list. For example, a statistical machine translation system such as ISI’s AlTemp SMT system (Och 2003) can generate a list of n-best alternative translations given a source sentence. We compute the automatic scores for the n-best translations and their reference translations. We then rank these translations, calculate the average rank of the references in the n-best list, and compute the ratio of the average reference rank to the length of the n-best list. We call this ratio “ORANGE” (Oracle1 Ranking for
Gisting Evaluation) and the smaller the ratio is, the better the automatic metric is.
There are several advantages of the proposed ORANGE evaluation method:
• No extra human involvement – ORANGE uses the existing human references but not human evaluations.
• Applicable on sentence-level – Diagnostic error analysis on sentence-level is naturally provided. This is a feature that many machine translation researchers look for. • Many existing data points – Every sentence
is a data point instead of every system (corpus-level). For example, there are 919 sentences vs. 8 systems in the 2003 NIST Chinese-English machine translation evaluation.
• Only one objective function to optimize – Minimize a single ORANGE score instead of maximize Pearson’s correlation coefficients between automatic scores and human judgments in adequacy, fluency, or other quality metrics.
• A natural fit to the existing statistical machine translation framework – A metric that ranks a good translation high in an n-best list could be easily integrated in a minimal error rate statistical machine translation training framework (Och 2003). The overall system performance in terms of
1 Oracles refer to the reference translations used in
the evaluation procedure.
Method Pearson 9 5 %L 9 5 %U Pearson 9 5 %L 9 5 %U
BLEU1 0.86 0.83 0.89 0.81 0.75 0.86
BLEU4 0.77 0.72 0.81 0.86 0.81 0.90
BLEU12 0.66 0.60 0.72 0.87 0 .7 6 0 .9 3
NIST 0.89 0 .8 6 0 .9 2 0.81 0.75 0.87
WER 0.47 0.41 0.53 0.69 0.62 0.75
PER 0.67 0.62 0.72 0.79 0.74 0.85
GTM10 0.82 0.79 0.85 0.73 0.66 0.79
GTM20 0.77 0.73 0.81 0.86 0.81 0.90
GTM30 0.74 0.70 0.78 0.87 0 .8 1 0 .9 1
Adequacy Fluency
generating more human like translations should also be improved.
Before we demonstrate how to use ORANGE to evaluate automatic metrics, we briefly introduce three new metrics in the next section.
3 Three New Metrics
ROUGE-L and ROUGE-S are described in details in Lin and Och (2004). Since these two metrics are relatively new, we provide short summaries of them in Section 3.1 and Section 3.3 respectively. ROUGE-W, an extension of ROUGE-L, is new and is explained in details in Section 3.2.
3.1 ROUGE-L: Longest Common Sub-sequence
Given two sequences X and Y, the longest common subsequence (LCS) of X and Y is a common subsequence with maximum length (Cormen et al. 1989). To apply LCS in machine translation evaluation, we view a translation as a sequence of words. The intuition is that the longer the LCS of two translations is, the more similar the two translations are. We propose using LCS-based F-measure to estimate the similarity between two translations X of length m and Y of length n, assuming X is a reference translation and Y is a candidate translation, as follows:
Rlcs
m
Y
X
LCS
(
,
)
=
(1)Plcs
n
Y
X
LCS
(
,
)
=
(2)Flcs
lcs lcs
lcs lcs
P
R
P
R
2 2
)
1
(
β
β
+
+
=
(3)Where LCS(X,Y) is the length of a longest common subsequence of X and Y, and β = Plcs/Rlcs
when ∂Flcs/∂Rlcs_=_∂Flcs/∂Plcs. We call the
LCS-based F-measure, i.e. Equation 3, ROUGE-L. Notice that ROUGE-L is 1 when X = Y since LCS(X,Y) = m or n; while ROUGE-L is zero when LCS(X,Y) = 0, i.e. there is nothing in common between X and Y.
One advantage of using LCS is that it does not require consecutive matches but in-sequence matches that reflect sentence level word order as n-grams. The other advantage is that it automatically includes longest in-sequence common n-grams, therefore no predefined n-gram length is necessary. By only awarding credit to in-sequence unigram matches, ROUGE-L also captures sentence level structure in a natural way. Consider the following example:
S1. police killed the gunman
S2.police kill the gunman S3.the gunman kill police
Using S1 as the reference translation, S2 has a ROUGE-L score of 3/4 = 0.75 and S3 has a ROUGE -L score of 2/4 = 0.5, with β = 1. Therefore S2 is better than S3 according to ROUGE-L. This example illustrated that ROUGE-L can work reliably at sentence level. However, LCS suffers one disadvantage: it only counts the main in-sequence words; therefore, other alternative LCSes and shorter sequences are not reflected in the final score. In the next section, we introduce ROUGE-W.
3.2 ROUGE-W: Weighted Longest Common Subsequence
LCS has many nice properties as we have described in the previous sections. Unfortunately, the basic LCS also has a problem that it does not differentiate LCSes of different spatial relations within their embedding sequences. For example, given a reference sequence X and two candidate sequences Y1 and Y2 as follows:
X: [A B C D E F G]
Y1: [A B C D H I K] Y2: [A H B K C I D]
Y1 and Y2 have the same ROUGE-L score.
However, in this case, Y1 should be the better
choice than Y2 because Y1 has consecutive matches.
To improve the basic LCS method, we can simply remember the length of consecutive matches encountered so far to a regular two dimensional dynamic program table computing LCS. We call this weighted LCS (WLCS) and use k to indicate the length of the current consecutive matches ending at words xi and yj. Given two sentences X
and Y, the recurrent relations can be written as follows:
(1) If xi = yj Then
// the length of consecutive matches at
// position i-1 and j-1
k = w(i-1,j-1)
c(i,j) = c(i-1,j-1) + f(k+1) – f(k)
// remember the length of consecutive
// matches at position i, j
w(i,j) = k+1 (2) Otherwise
If c(i-1,j) > c(i,j-1) Then
c(i,j) = c(i-1,j)
w(i,j) = 0 // no match at i, j
Else c(i,j) = c(i,j-1)
w(i,j) = 0 // no match ati, j
Where c is the dynamic programming table, 0 <=
i <= m, 0 <= j <= n, w is the table storing the length of consecutive matches ended at c table position i and j, and f is a function of consecutive matches at the table position, c(i,j). Notice that by providing different weighting function f, we can parameterize the WLCS algorithm to assign different credit to consecutive in-sequence matches.
The weighting function f must have the property that f(x+y) > f(x) + f(y) for any positive integers x
and y. In other words, consecutive matches are awarded more scores than non-consecutive matches. For example, f(k)-=-αk – β when k >= 0, and α, β> 0. This function charges a gap penalty of –β for each non-consecutive n-gram sequences. Another possible function family is the polynomial family of the form kα where -α > 1. However, in order to normalize the final ROUGE-W score, we also prefer to have a function that has a close form inverse function. For example, f(k)-=-k2 has a close
form inverse function f -1(k)-=-k1/2. F-measure
based on WLCS can be computed as follows, given two sequences X of length m and Y of length
WLCS-based F-measure, i.e. Equation 6, ROUGE -W. Using Equation 6 and f(k)-=-k2 as the
weighting function, the ROUGE-W scores for sequences Y1 and Y2 are 0.571 and 0.286 respectively. Therefore, Y1 would be ranked higher than Y2 using WLCS. We use the polynomial function of the form kα in the experiments described in Section 4 with the weighting factor α varying from 1.1 to 2.0 with 0.1 increment. ROUGE-W is the same as ROUGE-L when α is set to 1.
In the next section, we introduce the skip-bigram co-occurrence statistics.
3.3 ROUGE-S: Skip-Bigram Co-Occurrence Statistics
Skip-bigram is any pair of words in their sentence order, allowing for arbitrary gaps. Skip-bigram co-occurrence statistics measure the overlap of skip-bigrams between a candidate translation and a set
of reference translations. Using the example given in Section 3.1:
S1. police killed the gunman
S2.police kill the gunman S3.the gunman kill police S4.the gunman police killed
each sentence has C(4,2)2 = 6 skip-bigrams. For
example, S1 has the following skip-bigrams:
(“police killed”, “police the”, “police gunman”,
“killed the”, “killed gunman”, “the gunman”)
Given translations X of length m and Y of length n, assuming X is a reference translation and Y is a candidate translation, we compute skip-bigram-based F-measure as follows:
Rskip2
combination function. We call the skip-bigram-based F-measure, i.e. Equation 9, ROUGE-S. Using Equation 9 with β = 1 and S1 as the reference, S2’s ROUGE-S score is 0.5, S3 is 0.167, and S4 is 0.333. Therefore, S2 is better than S3 and S4, and S4 is better than S3.
One advantage of skip-bigram vs. BLEU is that it does not require consecutive matches but is still sensitive to word order. Comparing skip-bigram with LCS, skip-bigram counts all in-order matching word pairs while LCS only counts one longest common subsequence. We can limit the maximum skip distance, between two in-order words to control the admission of a skip-bigram. We use skip distances of 1 to 9 with increment of 1 (ROUGE-S1 to 9) and without any skip distance constraint (ROUGE-S*).
In the next section, we present the evaluations of BLEU, NIST, PER, WER, ROUGE-L, ROUGE-W, and ROUGE-S using the ORANGE evaluation method described in Section 2.
4 Experiments
Comparing automatic evaluation metrics using the ORANGE evaluation method is straightforward. To simulate real world scenario, we use n-best lists from ISI’s state-of-the-art statistical machine translation system, AlTemp (Och 2003), and the 2002 NIST Chinese-English evaluation corpus as the test corpus. There are 878 source sentences in Chinese and 4 sets of reference translations provided by LDC3. For exploration study, we
generate 1024-best list using AlTemp for 872 source sentences. AlTemp generates less than 1024 alternative translations for 6 out of the 878 source
3 Linguistic Data Consortium prepared these manual
translations as part of the DARPA’s TIDES project.
sentences. These 6 source sentences are excluded from the 1024-best set. In order to compute BLEU at sentence level, we apply the following smoothing technique:
Add one count to the gram hit and total n-gram count for n > 1. Therefore, for candidate translations with less than n words, they can still get a positive smoothed BLEU score from shorter n-gram matches; however if nothing matches then they will get zero scores.
We call the smoothed BLEU: BLEUS. For each candidate translation in the 1024-best list and each reference, we compute the following scores:
1. BLEUS1 to 9
2. NIST, PER, and WER 3. ROUGE-L
4. ROUGE-W with weight ranging from 1.1 to 2.0 with increment of 0.1
5. ROUGE-S with maximum skip distance ranging from 0 to 9 (ROUGE-S0 to S9) and without any skip distance limit (ROUGE-S*)
We compute the average score of the references and then rank the candidate translations and the references according to these automatic scores. The ORANGE score for each metric is calculated as the average rank of the average reference (oracle) score over the whole corpus (872 sentences) divided by the length of the n-best list plus 1. Assuming the length of the n-best list is N and the size of the corpus is S (in number of sentences), we compute Orange as follows:
ORANGE =
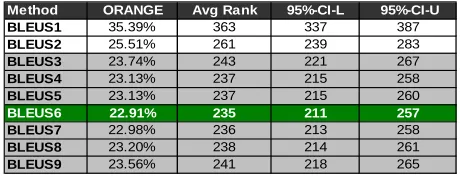
sentence i’s reference translations in n-best list i. Table 2 shows the results for BLEUS1 to 9. To assess the reliability of the results, 95% confidence intervals (95%-CI-L for lower bound and CI-U for upper bound) of average rank of the oracles are
Method ORANGE Avg Rank 95%-CI-L 95%-CI-U
BLEUS1 35.39% 363 337 387
BLEUS2 25.51% 261 239 283
BLEUS3 23.74% 243 221 267
BLEUS4 23.13% 237 215 258
BLEUS5 23.13% 237 215 260
BLEUS6 22.91% 235 211 257
BLEUS7 22.98% 236 213 258
BLEUS8 23.20% 238 214 261
BLEUS9 23.56% 241 218 265
Table 2. ORANGE scores for BLEUS1 to 9.
Method Pearson 9 5 %L 9 5 %U Pearson 9 5 %L 9 5 %U
BLEUS1 0.87 0 .8 4 0 .9 0 0.83 0.77 0.88
BLEUS2 0.84 0.81 0.87 0.85 0.80 0.90
BLEUS3 0.80 0.76 0.84 0.87 0.82 0.91
BLEUS4 0.76 0.72 0.80 0.88 0 .8 3 0 .9 2
BLEUS5 0.73 0.69 0.78 0.88 0 .8 3 0 .9 1
BLEUS6 0.70 0.65 0.75 0.87 0.82 0.91
BLEUS7 0.65 0.60 0.70 0.85 0.80 0.89
BLEUS8 0.58 0.52 0.64 0.82 0.76 0.86
BLEUS9 0.50 0.44 0.57 0.76 0.70 0.82
Adequacy Fluency
Table 3. Pearson's correlation analysis BLEUS1 to 9 vs. adequacy and fluency of 8 machine translation systems in 2003 NIST Chinese-English machine translation evaluation.
Method ORANGE Avg Rank 95%-CI-L 95%-CI-U
ROUGE-L 20.56% 211 190 234
ROUGE-W-1.1 20.45% 210 189 232
ROUGE-W-1.2 20.47% 210 186 230
ROUGE-W-1.3 20.69% 212 188 234
ROUGE-W-1.4 20.91% 214 191 238
ROUGE-W-1.5 21.17% 217 196 241
ROUGE-W-1.6 21.47% 220 199 242
ROUGE-W-1.7 21.72% 223 200 245
ROUGE-W-1.8 21.88% 224 204 246
ROUGE-W-1.9 22.04% 226 203 249
ROUGE-W-2.0 22.25% 228 206 250
Table 4. ORANGE scores for ROUGE-L and ROUGE-W-1.1 to 2.0.
Method ORANGE Avg Rank 95%-CI-L 95%-CI-U
ROUGE-S0 25.15% 258 234 280
ROUGE-S1 22.44% 230 209 253
ROUGE-S2 20.38% 209 186 231
ROUGE-S3 19.81% 203 183 226
ROUGE-S4 19.66% 202 177 224
ROUGE-S5 19.95% 204 184 226
ROUGE-S6 20.32% 208 187 230
ROUGE-S7 20.77% 213 191 236
ROUGE-S8 21.42% 220 198 242
ROUGE-S9 21.92% 225 204 247
ROUGE-S* 27.43% 281 259 304
estimated using bootstrap resampling (Davison and Hinkley). According to Table 2, BLEUS6 (dark/green cell) is the best performer among all BLEUSes, but it is statistically equivalent to BLEUS3, 4, 5, 7, 8, and 9 with 95% of confidence.
Table 3 shows Pearson’s correlation coefficient for BLEUS1 to 9 over 8 participants in 2003 NIST Chinese-English machine translation evaluation. According to Table 3, we find that shorter BLEUS has better correlation with adequacy. However, correlation with fluency increases when longer n-gram is considered but decreases after BLEUS5. There is no consensus winner that achieves best correlation with adequacy and fluency at the same time. So which version of BLEUS should we use? A reasonable answer is that if we would like to optimize for adequacy then choose BLEUS1; however, if we would like to optimize for fluency then choose BLEUS4 or BLEUS5. According to Table 2, we know that BLEUS6 on average places reference translations at rank 235 in a 1024-best list machine translations that is significantly better than BLEUS1 and BLEUS2. Therefore, we have better chance of finding more human-like translations on the top of an n-best list by choosing BLEUS6 instead of BLEUS2. To design automatic metrics better than BLEUS6, we can carry out error analysis over the machine translations that are ranked higher than their references. Based on the results of error analysis, promising modifications can be identified. This indicates that the ORANGE evaluation method provides a natural automatic evaluation metric development cycle.
Table 4 shows the ORANGE scores for ROUGE-L and ROUGE-W-1.1 to 2.0. ROUGE-W 1.1 does have better ORANGE score but it is equivalent to other ROUGE-W variants and ROUGE-L. Table 5 lists
performance of different ROUGE-S variants. ROUGE-S4 is the best performer but is only significantly better than ROUGE-S0 (bigram), ROUGE-S1, ROUGE-S9 and ROUGE-S*. The relatively worse performance of ROUGE-S* might to due to spurious matches such as “the the” or “the of”.
Table 6 summarizes the performance of 7 different metrics. ROUGE-S4 (dark/green cell) is the best with an ORANGE score of 19.66% that is statistically equivalent to ROUGE-L and ROUGE -W-1.1 (gray cells) and is significantly better than BLEUS6, NIST, PER, and WER. Among them PER is the worst.
To examine the length effect of n-best lists on the relative performance of automatic metrics, we use the AlTemp SMT system to generate a 16384-best list and compute ORANGE scores for BLEUS4, PER, WER, ROUGE-L, ROUGE-W-1.2, and ROUGE-S4. Only 474 source sentences that have more than 16384 alternative translations are used in this experiment. Table 7 shows the results. It confirms that when we extend the length of the n-best list to 16 times the size of the 1024-n-best, the relative performance of each automatic evaluation metric group stays the same. ROUGE-S4 is still the best performer. Figure 1 shows the trend of ORANGE scores for these metrics over N-best list of N from 1 to 16384 with length increment of 64. It is clear that relative performance of these metrics stay the same over the entire range.
5 Conclusion
In this paper we introduce a new automatic evaluation method, ORANGE, to evaluate automatic evaluation metrics for machine translations. We showed that the new method can be easily implemented and integrated with existing statistical machine translation frameworks. ORANGE assumes a good automatic evaluation metric should assign high scores to good translations and assign low scores to bad translations. Using reference translations as examples of good translations, we measure the quality of an automatic evaluation metric based on the average rank of the references within a list of alternative machine translations. Comparing with traditional approaches that require human judgments on adequacy or fluency, ORANGE requires no extra human involvement other than the availability of reference translations. It also streamlines the process of design and error analysis for developing new automatic metrics. Using ORANGE, we have only one parameter, i.e. ORANGE itself, to optimize vs. two in correlation analysis using human assigned adequacy and fluency. By examining the rank position of the Method ORANGE Avg Rank 95%-CI-L 95%-CI-U
BLEUS6 22.91% 235 211 257
NIST 29.70% 304 280 328
PER 36.84% 378 350 403
WER 23.90% 245 222 268
ROUGE-L 20.56% 211 190 234
ROUGE-W-1.1 20.45% 210 189 232
ROUGE-S4 19.66% 202 177 224
Table 6. Summary of ORANGE scores for 7 automatic evaluation metrics.
Method ORANGE Avg Rank 95%-CI-L 95%-CI-U
BLEUS4 18.27% 2993 2607 3474
PER 28.95% 4744 4245 5292
WER 19.36% 3172 2748 3639
ROUGE-L 16.22% 2657 2259 3072
ROUGE-W-1.2 15.87% 2600 2216 2989
ROUGE-S4 14.92% 2444 2028 2860
references, we can easily identify the confusion set of the references and propose new features to improve automatic metrics.
One caveat of the ORANGE method is that what if machine translations are as good as reference translations? To rule out this scenario, we can sample instances where machine translations are ranked higher than human translations. We then check the portion of the cases where machine translations are as good as the human translations. If the portion is small then the ORANGE method can be confidently applied. We conjecture that this is the case for the currently available machine translation systems. However, we plan to conduct the sampling procedure to verify this is indeed the case.
References
Akiba, Y., K. Imamura, and E. Sumita. 2001. Using Multiple Edit Distances to Automatically Rank Machine Translation Output. In Proceedings of the MT Summit VIII, Santiago de Compostela, Spain. Cormen, T. R., C. E. Leiserson, and R. L. Rivest. 1989.
Introduction to Algorithms. The MIT Press.
Davison, A. C. and D. V. Hinkley. 1997. Bootstrap Methods and Their Application. Cambridge University Press.
Leusch, G., N. Ueffing, and H. Ney. 2003. A Novel String-to-String Distance Measure with Applications to Machine Translation Evaluation. In Proceedings of MT Summit IX, New Orleans, U.S.A.
Lin, C-Y. and F.J. Och. 2004. Automatic Evaluation of Machine Translation Quality Using Longest Common Subsequence and Skip-Bigram Statistics. Submitted.
Nießen S., F.J. Och, G, Leusch, H. Ney. 2000. An Evaluation Tool for Machine Translation: Fast Evaluation for MT Research. In Proceedings of the 2nd International Conference on Language Resources and Evaluation, Athens, Greece.
NIST. 2002. Automatic Evaluation of Machine Translation Quality using N-gram Co-Occurrence Statistics. AAAAAAAAAAA http://www.nist.gov/speech/tests/mt/doc
Franz Josef Och. 2003. Minimum Error Rate Training for Statistical Machine Translation. In Proceedings of the 41st Annual Meeting of the Association for Computational Linguistics (ACL-2003), Sapporo, Japan.
Papineni, K., S. Roukos, T. Ward, and W.-J. Zhu. 2001. Bleu: a Method for Automatic Evaluation of Machine Translation. IBM Research Report RC22176 (W0109-022).
Su, K.-Y., M.-W. Wu, and J.-S. Chang. 1992. A New Quantitative Quality Measure for Machine Translation System. In Proceedings of COLING-92, Nantes, France.
Turian, J. P., L. Shen, and I. D. Melamed. 2003. Evaluation of Machine Translation and its Evaluation. In Proceedings of MT Summit IX, New Orleans, U.S.A.
2000 4000 6000 8000 10000 12000 14000 16000
0.1 0.15 0.2 0.25 0.3 0.35 0.4
ORANGE at Different NBEST Cutoff Length avg
NBEST Cutoff Length = 1 to 16384
ORANGE
BLEUS4 ROUGE−L PER ROUGE−S4 WER
ROUGE−W−1−2