Ensemble Classification of Grants using LDA-based Features
Ioannis Korkontzelos
∗, Beverley Thomas
†, Makoto Miwa
‡, Sophia Ananiadou
∗∗National Centre for Text Mining, School of Computer Science, University of Manchester, UK {ioannis.korkontzelos, sophia.ananiadou}@manchester.ac.uk
†Biotechnology and Biological Sciences Research Council (BBSRC), Polaris House, Swindon, UK
‡Toyota Technological Institute, Nagoya, Japan
Abstract
Classifying research grants into useful categories is a vital task for a funding body to give structure to the portfolio for analysis, informing strategic planning and decision-making. Automating this classification process would save time and effort, providing the accuracy of the classifications is maintained. We employ five classification models to classify a set of BBSRC-funded research grants in 21 research topics based on unigrams, technical terms and Latent Dirichlet Allocation models. To boost precision, we investigate methods for combining their predictions into five aggregate classifiers. Evaluation confirmed that ensemble classification models lead to higher precision. It was observed that there is not a single best-performing aggregate method for all research topics. Instead, the best-performing method for a research topic depends on the number of positive training instances available for this topic. Subject matter experts considered the predictions of aggregate models to correct erroneous or incomplete manual assignments.
Keywords:research grant classification, document classification, topic models
1.
Introduction
On a worldwide scale, funding bodies fund thousands of research grants per year. In the United Kingdom, national funding bodies are mostly organised by discipline in re-search councils. For example, the Biotechnology and Bi-ological Sciences Research Council (BBSRC) funds re-search in biotechnology and biology, the Medical Rere-search Council (MRC) funds research in medicine, the Engi-neering and Physical Sciences Research Council (EPSRC0 funds research in engineering and physical sciences etc. BBSRC processes, on average, over 1600 research grant applications per year.
Classifications give structure to research portfolios, en-abling timely, accurate portfolio analysis, to inform strate-gic planning and decision making, whilst also assisting in the process of peer review. Currently classification is a manual and subjective process taking considerable time and effort. Being able to assign classifications automatically will enable greater accuracy, consistency and timelines and has the potential to be used across a broad range of funding mechanisms. In addition, automatic classification offers the potential to amend the set of topics flexibly. The efficiency savings can free up capacity to perform increasingly sophis-ticated analyses. However, automatic assignment is only meaningful if the associated error rate is very limited, even if no assignment can be produced for some grants. Increas-ing classification accuracy requires that enough manually annotated data is available, to avoid error propagation and ensure that the resulting classification model will be able to generalise. The current study showed that automatic classi-fications were useful in correcting manual assignments. In this study, we address the task of classifying grants into
research topics. We combine a variety of classifiers whose features encode the words and technical terms in the de-scription of funded grants as well as Latent Dirichlet Allo-cation (LDA) topics. In particular, for each research topic we train five classification models based on Support Vector Machines (SVMs) that employ as features different combi-nations of words, techincal terms, LDA topics (Blei et al., 2003) and link LDA topics (Erosheva et al., 2004). LDA topics are used as a means of reducing sparsity in the space of words and technical terms.
Combining classifiers aims at boosting precision. The pre-dictions of the five basic classification models are combined using five voting-based aggregate classifiers. We investi-gate whether avoiding to produce final predictions for in-stances on which the basic classification models disagree leads to more accurate final predictions.
As evaluation data we use a set of freely available descrip-tions of BBSRC funded research grants to be assigned to 21 research topics. Combining diverse classifiers proves to be beneficial towards increasing classification performance without leaving many instances unclassified. The precision achievable by combined classification models for a research topic depends on the number of positive training instances available for this topic.
field value
reference number BB/C000072/1
title Understanding the role and regulation of cation homeostasis during citric acid stress in the spoilage yeast Saccharomyces cerevisiae
abstract
Yeasts are able to spoil foods and beverages because they have evolved mechanisms that allow them to adapt and grow under the extreme environmental conditions, such as acid pH, that are often used to preserve foods and drinks. Citric acid (E330) and its salts are used extensively in the food and beverage industry to control pH and act as preservatives to prevent microbial growth, but little is known about how yeasts adapt and grow in the presence of the acid...
objectives
We have identified three regulatory proteins, the protein kinases Hog1p, Sky1p and Ptk2p, whose function is required for optimal adaptation of spoilage yeast to the inhibitory effect of citric acid. Thus, the overall aim of this research will be to; a) identify the other component proteins of the signalling pathways used by Hog1p, Sky1p and Ptk2p; b) determine whether Hog1p, Sky1p and Ptk2p interact, or are components of the same, or different, signalling path-ways; and, b) identify what proteins Hog1p, Sky1p and Ptk2p interact with, and thus regulate, to switch on the adaptive mechanisms that allow the yeast to grow in the presence of citric acid stress. To fulfil these aims we will ...
initiative Proteomics and Cell Function (PCF) holding institution University of St. Andrews
[image:2.595.76.519.69.320.2]holding department Biology principal investigator Dr Peter Coote research topics MFS, MIC
Table 1: Example grant description
2.
Related work
LDA models have been applied extensively for a variety of purposes, e.g. modelling dependencies in text (Griffiths et al., 2005), matrix factorisation (Agarwal and Chen, 2010), decomposing biodiversity data (Valle et al., 2014), iden-tifying musical key-profiles (Hu and Saul, 2009) and cy-ber security (Aswani et al., 2015). Similarly to the present study, Torkkola (2003) used LDA models to reduce the dimensionality of token representation. Moreover, LDA topics have been used as classification features in Lee et al. (2015).
Semi-supervised LDA models have been used for classify-ing documents, ratclassify-ing movies from reviews, predictclassify-ing the popularity of webpages and for image classification and an-notation (Mcauliffe and Blei, 2008; Lacoste-Julien et al., 2009; Wang et al., 2009). Using semi-supervised LDA models for the current task is a matter of future work.
3.
Classification Models
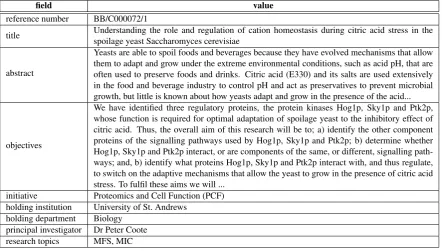
We build classification models for assigning a grant de-scription to one or more predefined research topics. A grant description is structured in fields, as shown in Table 1. We hypothesise that field content similarities between grants correspond to thematic similarities and thus should be the basis for assigning grants to research topics. As our base-line classification model, we employ a Support Vector Ma-chine (SVM) trained on features representing words in the textual fields of the grant descriptions, i.e. title, abstract and objectives.
Analysing the results and errors of the baseline experiment revealed that frequently grant descriptions in the same re-search topic do not share many words, due to the limited number of instances in the data set. The number of funded grants over the years is significant in terms of research but marginally sufficient to train a machine learner. To address
# abbreviation research topic
1 AGE ageing
2 AH animal health
3 AW animal welfare
4 CS crop science
5 DH diet and health
6 EG bioenergy
7 IB industrial biotechnology
8 IMM immunology
9 MFS microbial food safety
10 MIC microbiology
11 NS neuroscience and behaviour
12 PHM pharmaceuticals
13 PS plant science
14 REG regenerative biology
15 RRR replacement, reduction and refinement of animals in research
16 SB systems biology
17 SC stem cells
18 SS soil science
19 STR structural biology
20 SYN synthetic biology
[image:2.595.306.540.355.645.2]21 TD technology development
Table 2: Research topics
sparsity, we employed LDA models (Blei et al., 2003; Grif-fiths and Steyvers, 2004; Torkkola, 2003) to assign prob-abilistically grant descriptions to a predefined number of topics in an unsupervised manner based on content similar-ity. Using LDA topic features to represent grants addresses sparsity, because the LDA topics are less than the distinct words.
For example, the principal investigator’s name (table 1) can provide hints for classifying a grant, given that a researcher usually investigates a small number of areas and applies for follow-up grants. This extra Information can be ac-commodated in LDA models. The standard LDA model assumes the same distribution for all features. However, in-formation of different fields is not equally important for the task. To cover this requirement, we use the link LDA model (Erosheva et al., 2004), which allows considering different views to describe a single grant description. We employ separate views for the free text fields, the award details and the principal investigator’s name.
Thirdly, although free text fields often contain multiword technical terms, they are not parts of the feature represen-tation. Technical terms, as well-known/common phrases (concepts), occur naturally in text and are often shared be-tween grant descriptions. Complimentary to words, terms are used as features in the standard LDA model or as an ex-tra view in the link LDA model. We synthesise the above components into the classifiers:
SVM: A SVM trained on words in the free text fields, i.e. title abstract and objectives (table 1).
LDA: A SVM trained on the topic distribution of an LDA that considers words in the free text fields.
LDA + terms: A SVM trained on the topic distribution of an LDA that considers word and multiword terms in the free text fields.
link LDA: A SVM trained on the topic distribution of a link LDA that collectively considers the following views: (a) free text fields, (b) award details, i.e. ini-tiative, holding institution and department, and (c) principal investigator’s name.
link LDA + terms: A SVM trained on the topic distribu-tion of a link LDA that considers the views above plus a view for multiword terms extracted from the free text fields.
4.
Data
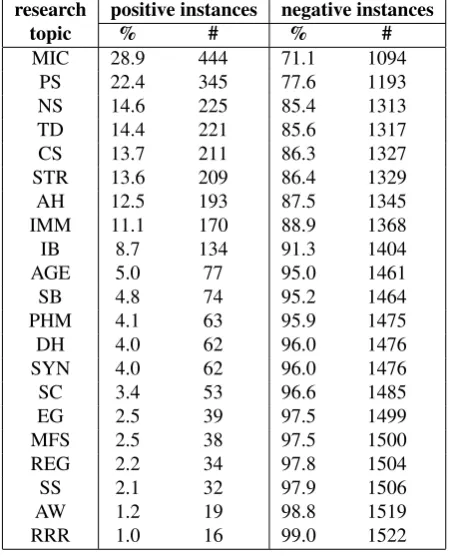
The dataset consists of 5,462 descriptions that have been awarded by the BBSRC between 2008 and 2013 or with annual spend between 2008/09 and 2013/14. For joint or transferred grants, only one grant per group was included in the dataset: the lead grant for joint grants or the original grant for transferred grants. 3,924 grants have been manu-ally assigned to one or more research topics in table 2 by subject matter experts. These grants were used as training data while the remaining 1,538 descriptions comprise the test data. Manual annotations of test set descriptions were provided at a later stage for evaluation. The description of each grant in these two sets consists of the fields shown in table 1. The abstract, the objectives and the initiative under which the grant was funder may be empty. Table 3 shows the numbers and associated percentages of posi-tive and negaposi-tive instances per research topic in the training data.
5.
Experiments
We evaluate five classification models, introduced in sec-tion 3., and we investigate predicsec-tion ensembles that can
research positive instances negative instances
topic % # % #
MIC 28.9 444 71.1 1094
PS 22.4 345 77.6 1193
NS 14.6 225 85.4 1313
TD 14.4 221 85.6 1317
CS 13.7 211 86.3 1327
STR 13.6 209 86.4 1329
AH 12.5 193 87.5 1345
IMM 11.1 170 88.9 1368
IB 8.7 134 91.3 1404
AGE 5.0 77 95.0 1461
SB 4.8 74 95.2 1464
PHM 4.1 63 95.9 1475
DH 4.0 62 96.0 1476
SYN 4.0 62 96.0 1476
SC 3.4 53 96.6 1485
EG 2.5 39 97.5 1499
MFS 2.5 38 97.5 1500
REG 2.2 34 97.8 1504
SS 2.1 32 97.9 1506
AW 1.2 19 98.8 1519
[image:3.595.310.535.70.349.2]RRR 1.0 16 99.0 1522
Table 3: Positive and negative instance counts and percent-ages per research topic sorted in order of decreasing posi-tive instances.
boost performance. In the pre-processing stage, the free text fields of grant descriptions, i.e. title abstract and ob-jectives and the fields describing award details, i.e. ini-tiative, holding institution and department (table 1), were sentence split and tokenised. Technical terms were ex-tracted using TerMine1 (Frantzi et al., 2000). For our ex-periments, the LibLinear SVM implementation2(Fan et al., 2008) was used, while the LDA model (Blei et al., 2003) and link LDA model (Erosheva et al., 2004) were imple-mented from scratch and parameters were set as follows: alpha =beta= 0.5. LDA models were trained for 2000 iterations to induce 500 topics. As evaluation measures, we employ precision (P), recall (R) and F-score (F1):
P = T P
T P +F P, R= T P T P +F N
F1= 2 P−1+R−1 −1
TP, FP and FN stand for true positives, false positives and false negatives, respectively.
As this study is part of a collaboration of the National Cen-tre for Text Mining (NaCTeM)3 and the BBSRC, to
eval-uate the classification models of section 3. we followed a procedure similar to the SemEval series4. Initially, the
BB-SRC provided fully annotated training data and unanno-tated test data. Classification models were trained on the
1nactem.ac.uk/software/termine
2In particular, L2-regularized L2-loss support vector
classi-fication (dual) solver was employed, with parameter settings: C= 1,eps= 0.01,p= 0.1.
3
nactem.ac.uk
Classification model
research SVM LDA LDA + terms link LDA link LDA + terms topic P R F1 P R F1 P R F1 P R F1 P R F1
MIC 91.9 74.6 82.3 87.9 72.1 79.2 86.5 73.9 79.7 85.6 73.9 79.3 89.1 73.4 80.5 PS 97.4 87.3 92.1 94.2 84.1 88.8 94.5 84.9 89.5 93.1 82.6 87.6 95.4 78.0 85.8
NS 99.0 85.8 91.9 98.0 86.7 92.0 97.0 87.6 92.1 98.0 85.3 91.2 96.6 88.4 92.3
TD 77.8 72.9 75.2 80.0 76.0 78.0 73.3 73.3 73.3 77.9 70.1 73.8 75.7 74.7 75.2 CS 88.7 77.7 82.8 89.3 75.7 81.8 85.4 74.9 79.8 85.3 71.6 77.8 88.2 74.4 80.7 STR 91.1 78.0 84.0 87.3 72.3 79.1 86.5 76.6 81.2 84.8 74.6 79.4 87.7 71.3 78.6 AH 93.1 77.2 84.4 92.3 80.8 86.2 94.1 82.4 87.9 92.0 77.7 84.3 89.0 79.3 83.8 IMM 94.5 71.2 81.2 90.8 69.4 78.7 90.9 76.5 83.1 84.2 68.8 75.7 87.3 72.9 79.5 IB 87.0 64.9 74.4 70.3 72.4 71.3 81.1 76.9 78.9 83.2 73.9 78.3 79.7 70.2 74.6 AGE 92.7 49.4 64.4 83.3 45.5 58.8 85.7 39.0 53.6 81.3 33.8 47.7 87.9 37.7 52.7 SB 81.9 48.7 61.0 74.4 43.2 54.7 81.3 52.7 63.9 76.2 43.2 55.2 76.2 43.2 55.2 PHM 87.5 22.2 35.4 87.5 33.3 48.3 74.4 46.0 56.9 76.7 36.5 49.5 77.8 33.3 46.7
DH 95.9 75.8 84.7 86.3 71.0 77.9 91.8 72.6 81.1 84.9 72.6 78.3 85.7 77.4 81.4 SYN 96.6 45.2 61.5 93.9 50.0 65.3 93.1 43.6 59.3 97.1 53.2 68.8 90.0 58.1 70.6 SC 100.0 58.5 73.8 86.7 73.6 79.6 92.3 67.9 78.3 84.6 62.3 71.7 79.6 66.0 72.2 EG 90.0 46.2 61.0 78.6 56.4 65.7 78.1 64.1 70.4 81.3 66.7 73.2 67.7 59.0 63.0 MFS 92.9 34.2 50.0 61.1 29.0 39.3 76.2 42.1 54.2 84.2 42.1 56.1 80.0 21.1 33.3
REG 92.3 35.3 51.1 77.8 41.2 53.9 70.0 41.2 51.9 82.4 41.2 54.9 83.3 29.4 43.5
SS 90.5 59.4 71.7 77.8 65.6 71.2 88.9 75.0 81.4 81.5 68.8 74.6 87.5 65.6 75.0 AW 80.0 21.1 33.3 75.0 15.8 26.1 85.7 31.6 46.2 66.7 21.1 32.0 85.7 31.6 46.2
RRR 0.0 0.0 0.0 0.0 0.0 0.0 0.0 0.0 0.0 0.0 0.0 0.0 0.0 0.0 0.0
[image:4.595.64.533.67.347.2]average 86.7 56.5 66.5 79.6 57.8 65.5 81.3 61.1 68.7 80.0 58.1 66.2 80.5 57.4 65.3
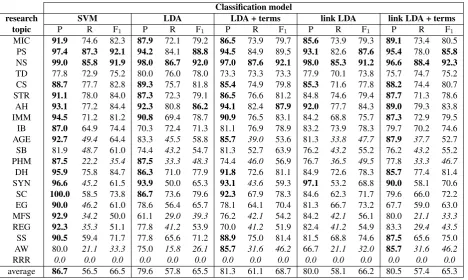
Table 4: Results per classification model and research topic (%). Scores greater than 85% or less than 50% are printed in bold or italics, respectively. Research topics are sorted in order of decreasing positive instances (see Table 3).
[image:4.595.67.529.70.347.2]training set to produce predictions for the grant descrip-tions in the test set. Each classification model was trained for each research topic. Then, each test grant description was presented to each of these models and produced five estimates for each research topic. Finally, the BBSRC dis-closed the gold-standard assignments of test grant descrip-tions to research topics.
Table 4 presents evaluation results per classification model and research topic. The best performing models areSVM andLDA + terms. In some cases, the remaining 3 mod-els achieve comparable or better results. For example,link LDA + terms achieved the maximum F-score for theNS topic. For some research topics, e.g.AW,MFS andRRR, all five models achieved very low results. The reason is sparsity of positive instances for these topics, as shown in table 3. ForRRR the results are zero because none of the classifiers identified true positives.
Automatic assignments are useful for decision making only if they are very precise. Thus, we investigate ways of com-bining the predictions of the five classification models, to increase precision. Cross-verifying predictions of grant de-scriptions to research topics, lowers the possibility of ac-cepting a prediction. However, accepted predictions are ex-pected to be more accurate than any of the five models. We consider the following methods:
5 agreements: we accept a positive prediction if all five classification models agree.
4 positives: we accept a positive prediction if at least four models agree.
3 positives: we accept a positive prediction if at least three models agree.
2 positives: we accept a positive prediction if at least two
models agree.
1 positive: we accept a positive prediction if produced by one or more models.
In all methods, we accept a negative prediction if all five models agree. These methods do not produce any predic-tion for some grant descrippredic-tions, e.g. if the five models do not agree when using5 agreements.
Table 5 shows evaluation scores of the five ensemble meth-ods for each of the 21 research topics. It can be observed that the stricter the aggregate algorithm is, the higher preci-sion and the lower recall it achieves. However, there is not a particular aggregate model that achieves the best balance in this trade-off between precision and recall, i.e. the highest F-score, for all research topics.
Classification ensemble model
research 5 agreements 4 positives 3 positives 2 positives 1 positive topic P R F1 P R F1 P R F1 P R F1 P R F1 MIC 99.2 81.0 89.2 94.4 84.4 89.1 91.8 85.7 88.6 87.0 86.8 86.9 77.3 87.4 82.0
PS 100.0 90.8 95.2 97.9 91.6 94.7 95.7 92.1 93.9 94.2 92.5 93.3 89.1 92.8 90.9
NS 100.0 93.1 96.4 99.5 93.6 96.4 98.5 93.8 96.1 97.6 94.0 95.8 93.8 94.2 94.0
TD 93.1 83.6 88.1 86.5 86.0 86.2 81.4 87.4 84.3 74.3 88.2 80.6 63.8 89.1 74.3 CS 96.8 82.1 88.8 94.9 85.1 89.8 88.5 86.1 87.3 87.9 87.1 87.5 76.5 87.7 81.7 STR 98.3 88.5 93.1 92.7 90.3 91.5 89.7 91.2 90.4 84.1 92.1 87.9 80.2 92.8 86.0
AH 97.7 89.0 93.1 96.5 89.6 92.9 94.6 90.8 92.6 91.7 91.2 91.5 83.9 91.7 87.6
IMM 99.0 81.9 89.6 93.3 84.1 88.5 92.4 85.2 88.6 88.7 86.5 87.6 80.5 87.7 83.9 IB 94.0 85.1 89.4 87.5 88.4 88.0 84.8 89.6 87.2 79.9 91.3 85.2 67.2 91.8 77.6 AGE 100.0 35.0 51.9 100.0 46.9 63.9 88.6 54.4 67.4 88.6 60.0 71.6 76.1 66.2 70.8 SB 100.0 50.0 66.7 93.6 52.7 67.4 85.7 53.6 65.9 71.7 59.4 65.0 64.9 64.9 64.9 PHM 100.0 19.4 32.4 100.0 35.9 52.8 91.3 45.7 60.9 85.3 53.7 65.9 64.4 60.3 62.3 DH 97.1 82.9 89.5 93.3 85.7 89.4 92.2 87.0 89.5 86.4 87.9 87.2 80.9 88.7 84.6 SYN 100.0 54.3 70.4 100.0 59.0 74.2 96.8 65.2 77.9 94.9 69.8 80.4 86.8 74.2 80.0 SC 100.0 74.3 85.3 96.9 77.5 86.1 92.1 79.6 85.4 84.4 80.9 82.6 77.2 83.0 80.0 EG 93.8 65.2 76.9 94.7 69.2 80.0 88.5 74.2 80.7 75.0 77.1 76.1 63.3 79.5 70.5 MFS 100.0 16.7 28.6 100.0 34.8 51.6 92.9 46.4 61.9 94.4 53.1 68.0 59.0 60.5 59.7 RE 100.0 33.3 50.0 100.0 39.1 56.3 87.5 50.0 63.6 77.8 50.0 60.9 66.7 58.8 62.5 SS 94.4 77.3 85.0 95.3 80.0 87.0 87.5 80.8 84.0 81.5 81.5 81.5 75.0 84.4 79.4 AW 75.0 21.4 33.3 80.0 26.7 40.0 80.0 26.7 40.0 80.0 26.7 40.0 80.0 42.1 55.2 RRR 0.0 0.0 0.0 0.0 0.0 0.0 0.0 0.0 0.0 0.0 0.0 0.0 0.0 0.0 0.0
[image:5.595.60.533.66.348.2]average 98.1 79.4 87.8 94.6 82.1 87.9 91.2 83.6 87.2 87.0 84.8 85.9 78.4 86.0 82.0
Table 5: Results per classification ensemble model and research topic (%). Scores greater than 85% or less than 50% are printed in bold or italics, respectively. Research topics are sorted in order of decreasing positive instances (see Table 3).
Classification ensemble model
topic 5agr eements
4positi ves
3positi ves
2positi ves
1positi ve
MIC 17.0 11.8 8.9 5.1 0.0
PS 7.4 5.1 3.6 2.1 0.0
NS 3.3 2.3 1.8 1.0 0.0
TD 11.6 9.0 6.8 4.4 0.0
CS 7.7 5.5 3.9 2.8 0.0
STR 8.1 6.0 4.4 2.2 0.0
AH 5.1 4.4 2.9 2.0 0.0
IMM 5.8 4.3 3.5 2.2 0.0
IB 7.5 5.7 4.6 2.5 0.0
AGE 3.5 2.9 2.1 1.5 0.0
SB 3.1 2.8 2.5 1.4 0.0
PHM 3.5 2.9 2.3 1.6 0.0
DH 2.2 1.5 1.1 0.6 0.0
SYN 2.2 2.0 1.4 0.9 0.0
SC 2.0 1.6 1.2 0.8 0.0
EG 2.2 2.0 1.5 0.9 0.0
MFS 2.3 2.0 1.6 1.4 0.0
RE 1.5 1.4 0.9 0.8 0.0
SS 1.2 1.0 0.8 0.6 0.0
AW 0.4 0.3 0.3 0.3 0.0
RRR 0.0 0.0 0.0 0.0 0.0
average 4.6 3.6 2.7 1.7 0.0
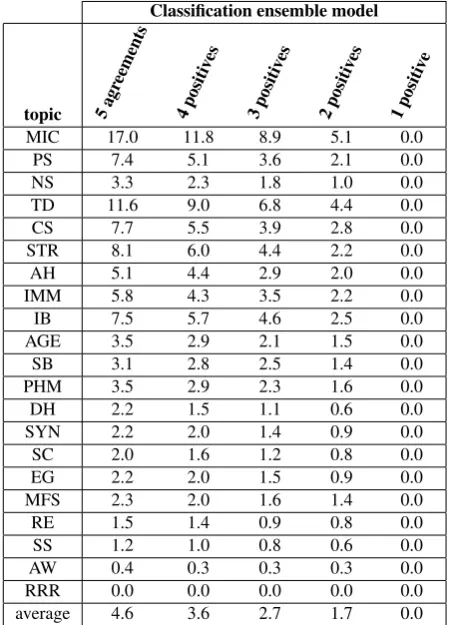
Table 6: Percentage of omitted instances per classification ensemble model and research topic (%). Research topics are sorted in order of decreasing positive instances (see Ta-ble 3).
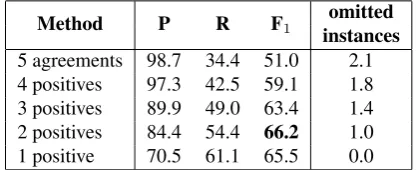
not for all. To investigate this further, we computed sep-arate average scores for research topics where the aggre-gate methods perform well or not so well. In particular, as shown in table 8 we computed average scores for re-search topics for which the5 agreementsmethod achieved an F-score higher than 75%, i.e.AH,CS,DH,EG,IB,IMM, MIC,NS,PS,SB,SC,SS,STRandTD. Average scores for the remaining research topics are illustrated in table 8. We observe that the best performing aggregate method for the high-performance research topics is 5 agreements, while the best performing method for the low-performance re-search topics is2 positives. Due to the sparsity of positive training instances for the low-performance research top-ics (table 3) the classification models rarely produce pos-itive predictions. Thus, requiring a pospos-itive prediction from three, four or five models is a very strict criterion, affecting performance negatively.
Disagreements between manual assignments and automatic predictions were studied by subject matter experts. Analy-sis revealed that some manual assignments were wrong or incomplete, decreasing the error rate from 2.04% to 1.38%, when using the5 agreementscombination method and av-eraging over all research topics.
6.
Conclusion & Future Work
[image:5.595.57.283.396.709.2]Method P R F1
omitted instances 5 agreements 98.1 84.4 90.7 6.0 4 positives 94.4 86.5 90.2 4.5 3 positives 91.2 87.5 89.3 3.4 2 positives 86.9 88.4 87.6 2.0
[image:6.595.65.274.68.154.2]1 positive 78.4 89.1 83.4 0.0
Table 7: Results per prediction combination method for the research topics AH, CS, DH, EG, IB, IMM, MIC,NS, PS,SB, SC, SS, STR, TD (%).
Method P R F1
omitted instances 5 agreements 98.7 34.4 51.0 2.1 4 positives 97.3 42.5 59.1 1.8 3 positives 89.9 49.0 63.4 1.4 2 positives 84.4 54.4 66.2 1.0
1 positive 70.5 61.1 65.5 0.0
Table 8: Results per prediction combination method for the research topics AGE, AW, MFS, PHM, REG, RRR, SB, SYN (%).
accepting a prediction only when five classification models agree achieved high precision for research topics for which adequate positive instances are available. BBSRC experts used the results to improve manual assignments.
In the future, we will pursue further precision increase, es-pecially for research topics associated with very few pos-itive instances. We plant to consider methods for adapt-ing Support Vector Machines to highly imbalanced datasets (Akbani et al., 2004; Batuwita and Palade, 2013; Wang and Japkowicz, 2010; Tang et al., 2009). The relevant literature suggests various methods for smoothing the ef-fect of the small number of positives, including oversam-pling and undersamoversam-pling (Akbani et al., 2004; Batuwita and Palade, 2013; Wang and Japkowicz, 2010; Tang et al., 2009; Chawla, 2005; Wang et al., 2014; Ganganwar, 2012). It is worth applying these methods to the particular problem at hand, in an attempt to improve classification performance for topic labels of very high sparsity of positive training in-stances.
Acknowledgments
The authors would like to thank Dr. Kate Chisholm, BB-SRC, for the analysis of data to evaluate the effectiveness of the auto-classification approach, and also Mr. Paul Chit-son,BBSRC, for his technical support throughout the pilot and the integration of the classification software into the BBSRC’s data processing system. This work has been par-tially supported by the Medical Research Council (Support-ing Evidence-based Public Health Interventions us(Support-ing Text Mining [Grant MR/L01078X/1]).
7.
Bibliographical References
Agarwal, D. and Chen, B.-C. (2010). flda: Matrix factor-ization through latent dirichlet allocation. In Proceed-ings of the Third ACM International Conference on Web
Search and Data Mining, WSDM ’10, pages 91–100, New York, NY, USA. ACM.
Akbani, R., Kwek, S., and Japkowicz, N. (2004). Apply-ing support vector machines to imbalanced datasets. In Jean-Franc¸ois Boulicaut, et al., editors,ECML, volume 3201 ofLecture Notes in Computer Science, pages 39– 50. Springer.
Aswani, K., Cronin, A., Liu, X., and Zhao, H. (2015). Topic modeling of ssh logs using latent dirichlet alloca-tion for the applicaalloca-tion in cyber security. InSystems and Information Engineering Design Symposium (SIEDS), pages 75–79, Charlottesville, VA. IEEE.
Batuwita, R. and Palade, V., (2013). Class Imbalance Learning Methods for Support Vector Machines, chap-ter 5, pages 83–100. Wiley-Blackwell, 1 edition. Blei, D. M., Ng, A. Y., and Jordan, M. I. (2003). Latent
dirichlet allocation. Journal of Machine Learning Re-search, 3:993–1022.
Chawla, N. V., (2005). Data Mining for Imbalanced Datasets: An Overview, chapter 40, pages 853–867. Springer series in solid-state sciences. Springer, Heidel-berg, 1 edition.
Erosheva, E., Fienberg, S., and Lafferty, J. (2004). Mixed-membership models of scientific publications. Proceed-ings of the National Academy of Sciences, 101(suppl. 1):5220–5227.
Fan, R. E., Chang, K. W., Hsieh, C. J., Wang, X. R., and Lin, C. J. (2008). LIBLINEAR: A library for large linear classification. Journal of Machine Learning Research, 9:1871–1874.
Frantzi, K. T., Ananiadou, S., and Mima, H. (2000). Auto-matic recognition of multi-word terms: the C-value/NC-value method. International Journal on Digital Li-braries, 3(2):115–130.
Ganganwar, V. (2012). An overview of classification al-gorithms for imbalanced datasets. International Jour-nal of Emerging Technology and Advanced Engineering, 2(4):42–47.
Griffiths, T. L. and Steyvers, M. (2004). Finding scien-tific topics. Proceedings of the National Academy of Sci-ences, 101(Suppl. 1):5228–5235.
Griffiths, T. L., Steyvers, M., Blei, D. M., and Tenenbaum, J. B. (2005). Integrating topics and syntax. In L.K. Saul, et al., editors,Advances in Neural Information Process-ing Systems 17, pages 537–544. MIT Press.
Hu, D. and Saul, L. K. (2009). A probabilistic topic model for unsupervised learning of musical key-profiles. In Keiji Hirata, et al., editors, ISMIR, pages 441–446. In-ternational Society for Music Information Retrieval. Lacoste-Julien, S., Sha, F., and Jordan, M. I. (2009).
Dis-clda: Discriminative learning for dimensionality reduc-tion and classificareduc-tion. In D. Koller, et al., editors, Ad-vances in Neural Information Processing Systems 21, pages 897–904. Curran Associates, Inc.
[image:6.595.65.274.210.295.2]Mcauliffe, J. D. and Blei, D. M. (2008). Supervised topic models. In J.C. Platt, et al., editors, Advances in Neu-ral Information Processing Systems 20, pages 121–128. Curran Associates, Inc.
Tang, Y., Zhang, Y.-Q., Chawla, N. V., and Krasser, S. (2009). SVMs Modeling for Highly Imbalanced Clas-sification.IEEE Transactions on Systems, Man, and Cy-bernetics, Part B, 39(1):281–288.
Torkkola, K. (2003). Discriminative features for text doc-ument classification. Pattern Analysis & Applications, 6(4):301–308.
Valle, D., Baiser, B., Woodall, C. W., and Chazdon, R. (2014). Decomposing biodiversity data using the latent dirichlet allocation model, a probabilistic multivariate statistical method.Ecology Letters, 17(12):1591–1601. Wang, B. X. and Japkowicz, N. (2010). Boosting support
vector machines for imbalanced data sets. Knowledge and Information Systems, 25(1):1–20.
Wang, C., Blei, D., and Li, F. F. (2009). Simultaneous image classification and annotation. Computer Vision and Pattern Recognition, IEEE Computer Society Con-ference on, 0:1903–1910.