45
QRS Complex Detection and ST Segmentation of ECG
Signal Using Wavelet Transform
1Afseen Naaz, 2Mrs Shikha Singh
Research Scholar,C.V.R.U, Bilaspur1, Asst.Prof., C.V.R.U., Bilaspur2
[email protected], [email protected]2
Abstract- This paper deals with the extraction of QRS complex using wavelet decomposition. Original noisy signal of
ECG is first of all pre-processed to remove the power-line and base line wandering line. Wavelet decomposition is used for detecting the QRS complex from the ECG signal. ST segmentation is also performed to see whether the ECG pattern belong to the Heart attack patients or not.
Keywords—ECG, DWT, QRS, WAVELET
1. INTRODUCTION
[image:1.612.94.305.383.504.2]Electrocardiogram (ECG) is the tool which record the heart’s electrical signal or function. It is used to find out the functioning and capability of the heart. ECG is basically the pattern of some electrical signal which varies as per the functioning of the heart and if recorded can be used to analyse the condition of the heart.
Figure 1 Typical ECG signal and its various Peaks.
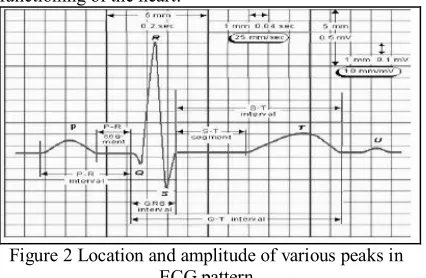
In any ECG pattern, some of the peaks are very important. These peaks are known as the P,Q, R, S and T peak. The respective location and amplitude of these peaks carry very crucial information about the functioning of the heart.
Figure 2 Location and amplitude of various peaks in ECG pattern
During the single cardiac cycle, P wave, QRS complex and the T wave varies differently as per the heart condition. QRS in ECG signal is used for identifying the heart rate regularity and arrhythmias [1].
Among all the peaks, R peak is difficult to detect in the ECG because of its variation with time. Power line interference and base line wandering also affect the R-peak most[2]. Due to its changing nature, QRS complex is difficult to detect in ECG signal and it is also affected by the power line noise and base line wandering noise. The characteristics of P and T wave is very similar to QRS complex so the presence of P and T wave greatly hindered the detection of the QRS complex[3,4]. P,Q,R,S and T wave carry important features of ECG signal[5]. Extraction of feature from these waves helps to identify different kind of CVD.
2. BACKGROUND
In order to detect the diseases related with the heart, ECG signal need to analyzed carefully. Analysis of the ECG signal is accomplished by extracting the feature (P,Q,R,S and T wave and its duration)of the ECG signal. In the past, different techniques have been applied for this very purpose.
Non-linear filtering is on of the common approach for detecting the QRS complex [5]. This is very simple scheme for detecting the QRS detection.
ECG feature extraction and denoising using wavelet transform have been presented by various researcher[6],[7],[8][9]. Their method was based on the decomposition of the ECG pattern using wavelet and then extract the QRS complex.Another wavelet transform based method for QRS detection is presented in[10]. Feature extracted by this method is used to classify arrhythmia.
[image:1.612.94.307.569.708.2]46
Original ECG
Signal
ECG Signal after
baseline
Wander removal
different stage for feature extraction i.e. pre-processing the ECG signal, Feature extraction from the ECG signal, classification of the feature.
ECG feature extraction using multi resolution wavelet
transform is proposed by the
mahmoodabadi[12].Daubechies wavelet was used in his approach. He drew a conclusion that the shape of the scaling function of the wavelet if is similar to the shape of the ECG signal then better detection rate from the ECG signal is obtained. ECG feature extraction approach using mathematical morphology was presented in [13]. Compression based EXG signal feature extraction was present by Saxsena[14]. He drew a conclusion that feature extraction from the compressed ECG signal is noise less and gives better result.
Emran [15] presented a ECG feature extraction approach which is the combination of the DWT, erosion and dialation.
Wavelet peak and vally detection along with the adaptive thresholding approach is presented in[16]. This approach is enhancement of the work presented in [1] and able to achieve better result than the [1].
3. METHODOLOGY
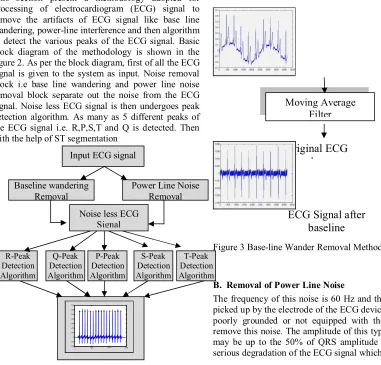
[image:2.612.101.482.359.724.2]This section present a methodology adopted for processing of electrocardiogram (ECG) signal to remove the artifacts of ECG signal like base line wandering, power-line interference and then algorithm to detect the various peaks of the ECG signal. Basic block diagram of the methodology is shown in the figure 2. As per the block diagram, first of all the ECG signal is given to the system as input. Noise removal block i.e base line wandering and power line noise removal block separate out the noise from the ECG signal. Noise less ECG signal is then undergoes peak detection algorithm. As many as 5 different peaks of the ECG signal i.e. R,P,S,T and Q is detected. Then with the help of ST segmentation
Figure 2 Block diagram of ECG signal peak detection
algorithm, a decision is made whether this ECG pattern belong to the heart attack category or not.
A. Removal of Base-line Wander
The frequency of human respiratory signal is in between 0.15 Hz to 0.5 Hz[17]. These frequency is known as the base line wander frequency. These frequency when mixed with the ECG pattern then it create distortion in ECG signal. Due to these frequency, it become difficult to produce accurate ECG pattern detection. There are so many method which is used to separate out the baseline wander noise some of them are FIR filter. IIR filter with appropriate cut off frequency. Wavelet decomposition can also be used to remove base line wander. Moving average approach is also used for removing the base line wander. In this paper, moving average operation is performed in MATLAB to get rid of base-line wander from the ECG signal.
Figure 3 Base-line Wander Removal Method
B. Removal of Power Line Noise
The frequency of this noise is 60 Hz and this noise is picked up by the electrode of the ECG device which is poorly grounded or not equipped with the filter to remove this noise. The amplitude of this type of noise may be up to the 50% of QRS amplitude and cause serious degradation of the ECG signal which makes its Baseline wandering
Removal
Noise less ECG Signal
R-Peak Detection Algorithm
Q-Peak Detection Algorithm
T-Peak Detection Algorithm S-Peak
Detection Algorithm P-Peak
Detection Algorithm
0 500 1000 1500 -200
-100 0 100 200 300 400 500 600 700
Decision Making and ST Segmentation
Power Line Noise Removal
Moving Average Filter
47 analysis difficult. This noise makes the ECG signal
look thick as shown in the figure4. This type of noise can be removed by applying Notch filter of 60Hz frequency.
Figure 4 ECG signal Corrupted with Power Line Noise
Once the ECG signal is free from noise then the next step is to locate the P, Q , R, S, T peak in ECG signal using wavelet transform. The algorithm steps for extracting these peaks from the ECG signal is as follows-
Step 1: Take the noise free ECG signal as input and
[image:3.612.316.547.77.232.2]append 100 zeros at both side of the ECG signal. This step kill any possibility of window crossing the boundaries of the ECG signal while processing.
Figure 5 Pattern of ECG signal after appending zeros on both side of ECG signal
Step 2: Perform wavelet decomposition operation.
Wavelet decomposition operation performs the down-sampling of the ECG signal. Down-down-sampling the ECG signal means taking a signal at lower frequency than the original one. Down-sampling operation basically reduced the detailed component of the ECG signal while preserved the QRS complex.
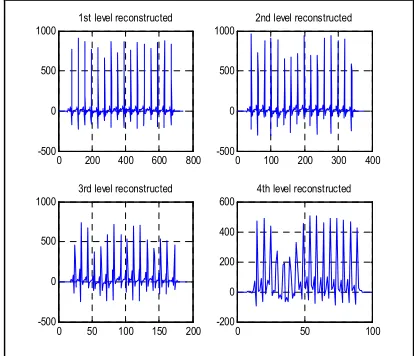
Figure 6 ECG signal after 1st level (Upper left), 2nd
level(Upper right),3rd level(lower left)and 4th
level(lower right) wavelet decomposition
From figure 6 it is clear that the first level decomposed ECG signal is very similar to the original ECG signal but has exactly half samples than the original one. Similarly 2nd level decomposition has exactly half
samples that the first level ECG signal. Since number of sample gets reduced in this example therefore it is called down-sample signal.
From the figure 6 it is clear that the 2nd level
decomposition is noise free ECG and good for QRS detection. By experimentation it is found that the location of the first R peak in the 3rd level
decomposition is at 40th sample which is located in the
260th sample in original signal.
Step 3: Locate all the values of y1 of second level
decomposition which are larger than the 60% of the maximum of y1. These are the values of the probable R-peaks. Store the location of these values in the variable.
Step 4: Separate out the R-peak location which are
very close to each other and retain all R-peaks which are 10 sample apart.
In ECG signal, R-peak is not a single impulse peak but some time consist of many close peaks. Step 4 is performed to avoid false R-peak location.
Step 5: Store all the R-peak location of down-sampled
signal found in step 4 to variable P2.
Step 6: Now find R-peak in original signal by
multiplying the P2 with 4 to get the actual scale with the help of window Rloc-20 to Rloc+20.
Step 7: Store all the R-peak in Ramp and Location of
[image:3.612.92.315.142.222.2]48 Figure 7 R-peak found in Original ECG signal
Step 8: Select a window of Rloc-100 to Rloc-50 and
find the maximum within this window. These Maxima are P-peaks.
Step 9: Select a window of Rloc-100 to Rloc-10 and
find the minima within this window. These minima are Q-peaks.
Step 10: Select a window of Rloc+5 to Rloc+50 and
find the minima within this window. These minima are S-peaks.
Step 11: Select a window of Rloc+25 to Rloc +100
and find the maxima within this window. These are T-peaks.
Once all the peaks are detected then these peaks can be plotted easily.
Step 12: Once all the peaks are computed then compute zero crossing onset and offset points for S and T peaks.
Step 13: The difference between S offset point and T On set point is known as the St segment.
4. EXPERIMENTAL RESULT
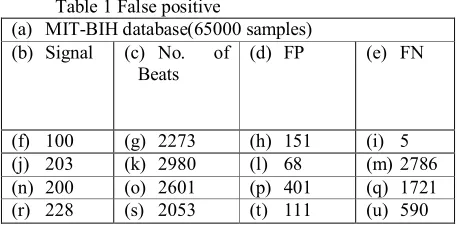
In order to test our method of ECG signal processing and detection of peaks, a database of ECG signal has been taken from MIT-BIH database[18].
0 500 1000 1500
-200 -100 0 100 200 300 400 500 600
700 Actual Signal
Figure 8 Original ECG Signal
0 200 400 600 800 1000 1200 1400 1600
-600 -400 -200 0 200 400 600
[image:4.612.316.520.85.265.2]800 decomposed signal
Figure 9 Decomposed ECG Signal
Proposed method is implemented in MATLAB 2009B. Proposed algorithm is applied to different ECG signal obtained from MIT-BIH database and results obtained is shown in figure. From the result it is clear that proposed method of detecting various peaks in ECG signal has been successful in finding P, Q, R, S and T peaks from ECG signal. Various peaks of ECG signal are shown in figures given below.
0 200 400 600 800
-500 0 500
1000 1st level reconstructed
0 100 200 300 400
-500 0 500
1000 2nd level reconstructed
0 50 100 150 200
-500 0 500
1000 3rd level reconstructed
0 50 100
-200 0 200 400
[image:4.612.312.519.386.564.2]600 4th level reconstructed
49
0 50 100 150 200 250 300 350 400
-400 -200 0 200 400 600 800
[image:5.612.93.299.77.247.2]1000 base line corrected and smoothed signal
Figure 11 Baseline Corrected and Smooth signal
0 50 100 150 200 250 300 350 400 -400
-200 0 200 400 600 800 1000
Figure 12 R-peak in Down-sampled Signal(*)
0 500 1000 1500
[image:5.612.89.532.87.651.2]-200 -100 0 100 200 300 400 500 600 700
Figure 13 R-peak in Original ECG Signal(*)
0 500 1000 1500
-200 -100 0 100 200 300 400 500 600 700
Figure 14 Q-peak in Original ECG Signal(o)
0 500 1000 1500
-200 -100 0 100 200 300 400 500 600 700
Figure 15 S-peak in Original Signal (+)
0 500 1000 1500
-200 -100 0 100 200 300 400 500 600 700
50 Table 1 False positive
(a) MIT-BIH database(65000 samples)
(b) Signal (c) No. of
Beats (d) FP (e) FN
(f) 100 (g) 2273 (h) 151 (i) 5
(j) 203 (k) 2980 (l) 68 (m)2786
(n) 200 (o) 2601 (p) 401 (q) 1721
(r) 228 (s) 2053 (t) 111 (u) 590
5. CONCLUSION
ECG signal carries very important information about the abnormalities in heart and other organ of human body. It is therefore very necessary to analyze the ECG signal correctly which helps the doctors to take the decision promptly. Therefore there is need to devise some algorithm which can analyze the ECG signal correctly and hence reduce the human interaction in analyzing the ECG data. This also helpful to remote areas where expert doctors are unavailable and with the help of computer, a program can take the decision by the analysis of ECG signal.
Our sole objective of this project was to develop a
method for efficient analysis of ECG signal and
detecting various peaks of ECG signal correctly. In this work, first of all we have taken an ECG signal from MIT BIH database and remove most prominent artifacts like base line wander and power-line interference. Artifacts free ECG signal is then undergone through the proposed peak detection algorithm for detecting the various peaks from the ECG data. The results obtained are shown from figure 8 to figure 16. It is evident that the proposed method is able to detect various peaks of ECG signal i.e. P, Q, R, S and T efficiently and correctly.
REFERENCES
[1]Electrocardiograms, by M.Armstrong,
Electrocardiograms. Bristol, U.K.Wright, 1985 [2] http://www.ijest.info/docs/IJEST10-02-07-145.pdf,
pp.15-30 June 2011. Detection of QRS complexes of ECG recording based on Wavelet Transform using Matlab
[3] Wavelet Transform-Based QRS Complex Detector Shubha Kadambe,* Member, IEEE, Robin Murray, and G. Faye Boudreaux-Bartels
[4] A comparison of the noise sensitivity of nine QRS detection algorithms, IEEE Trans. Biomed. Eng., vol. 37, pp. 85–98, Jan. 1990
[5] J. Pan andW. J. Tompkins, “A real-time QRS detection algorithm,” IEEE Trans. Biomed. Eng., vol. BME-32, no. 3, pp. 230–236, Mar.1985. [6] C. Li, C. Zheng, and C. F. Tai, “Detection of ECG
characteristic points using wavelet transforms,” IEEE Trans. Biomed. Eng., vol. 42, no. 1, pp. 21–28, Jan. 1995.
[7] J. P. Martinez, S. Olmos, and P. Laguna, “Evaluation of a wavelet-based ECG waveform detector on the QT database,” Comput. Cardiol., vol. 27, pp. 81–84, Sep. 2000.
[8] P. M. Agante and J. P.Marques de Sa, “ECG noise filtering using wavelets with soft-thresholding methods,” Comput. Cardiol., vol. 26, pp. 535– 538, Sep. 1999.
[9] J. S. Sahambi, S. N. Tandon, and R. K. P. Bhatt,
“Using wavelet transforms for ECG
characterization: An on-line digital signal processing system,” IEEE Eng. Med. Biol. Mag., vol. 16, no. 1, pp. 77–83, Jan./Feb. 1997. [10] Elif Derya Übeyli “Feature Extraction for
Analysis of ECG Signals”, International Conference on IEEE EMBS Vancouver, British Columbia, Canada, August, 2008
[11]. Qibin Zhao, and Liqing Zhan, 2005 “ECG Feature Extraction and Classification Using Wavelet Transform and Support Vector Machines,” International Conference on Neural Networks and Brain, ICNN&B ’05, vol. 2, pp. 1089-1092,.
[12]. S. Z. Mahmoodabadi, A. Ahmadian, and M. D. Abolhasani, 2005 “ECG Feature Extraction using Daubechies Wavelets,” Proceedings of the fifth IASTED International conference on Visualization, Imaging and Image Processing, pp. 343-348,.
[13]. P. Tadejko, and W. Rakowski, 2007 “Mathematical Morphology Based ECG Feature Extraction for the Purpose of Heartbeat Classification,” 6th International Conference on
Computer Information Systems and Industrial Management Applications, CISIM '07, pp. 322-327,.
[14]. S. C. Saxena, A. Sharma, and S. C. Chaudhary, 1997 “Data compression and feature extraction of ECG signals,” International Journal of Systems Science, vol. 28, no. 5, pp. 483-498,. [15]. Emran M. Tamil, Nor Hafeezah Kamarudin,
Rosli Salleh, M. Yamani Idna Idris, Noorzaily M.Noor, and Azmi Mohd Tamil, “Heartbeat
Electrocardiogram (ECG) Signal Feature
Extraction Using Discrete Wavelet Transforms (DWT).”
[16]. Miad Faezipour, Student, Adnan Saeed, Suma Chandrika Bulusu,Mehrdad Nourani, Hlaing Minn, and Lakshman Tamil IEEE, september 2010 “A Patient-Adaptive Profiling Schemefor ECG Beat Classification” transactions on information technology in biomedicine, vol. 14, no. 5, pp. 1153-1165.
[17] V. S. Chouhan and S. S. Mehta, "Total Removal of Baseline Drift from ECG Signal, Computing: Theory and Applications-ICCTA '07, 0-7695-2770-1/07