Transactions of the 17th International Conference on
Structural Mechanics in Reactor Technology (SMiRT 17)
Prague, Czech Republic, August 17 –22, 2003
Paper # J05-6
Analytical Study of Piping Flow-induced Vibration. Example of Implementation.
Peter Vasilyev1), Leonid Fromzel1)
1) CKTI-Vibroseism Co. Ltd., St. Petersburg, Russian Federation
ABSTRACT
The paper presents methodology for analysis of piping vibration state. The acoustic resonance of medium (steam or water) is considered as most probable source of flow-induced vibration.
For analysis of piping vibration induced by steady-state processes in a transmitted medium the mathematical model and corresponding computer code NETPULS are developed for evaluation of an acoustic oscillation in a liquid or gaseous medium. Acoustic excitation can arise in the pipeline discontinuities such as tees, branches etc. and also can be caused by external sources connected to the pipeline. NETPULS is based on linearized mathematical model of quasi-stationary acoustic oscillation in the compressed medium. Mathematical model of this process takes into account influence of non-linear damping due to hydraulic friction and local hydraulic losses.
The amplitude-frequency and phase-frequency characteristics of the gas-dynamic forces acting upon the piping discontinuities (bends, tees, branches etc.) are defined. The output obtained by NETPULS can be used as input data for consequent calculation of mechanical vibrations of pipelines and evaluation of effectiveness of damping devices.
Implementation of the described approach is illustrated on a basis of practical measurements and numerical analysis of typical NPP steam line.
KEY WORDS: flow-induced vibration, pipeline, vibration analysis, vibration measurement, damper, NETPULS, dPIPE
INTRODUCTION
Vibration of High Energy pipelines very often is the cause of pipe and fitting cracking and other relevant problems. Vibration is usually divided into two character types: steady-state and dynamic transient vibration. This paper describes an approach for practical evaluation and elimination of steady-state vibration. The most probable and widely observed mechanism of piping steady-state vibrations is Flow-induced vibration. Two main reasons exist for that: 1) a lot of sources of vibration inside medium in comparison with external mechanical excitation transferred to attached pipeline from structures or equipment, and 2) structure damping for piping is usually higher than medium damping, so piping vibration could be extended far away from the source only due to medium oscillation. Among the sources of medium (acoustic) vibration are pump-induced pulsations, flow turbulence, cavitation, vortex shedding, etc. In consideration that fluid damping is typically very low, a large amplification is usually observed at resonance frequencies. Medium pressure pulsation affects piping by causing of unbalanced forces at locations where direction of flow or velocity is changed (elbows, tees, local orifices etc.).
These problems are well known [2, 4, and 7]. A number of documents requires or recommends to shift piping eigen frequencies far away from the frequencies of potential vibration sources. However, this approach (on the design stage) is rather difficult to implement due to a great number of natural eigen frequencies for the typical high energy pipeline. From the other hand, in practice relatively small number of pipelines is experienced serious vibration. So, a typical Customer usually prefers to deal with vibration elimination when the problem arises, not in advance because this approach is more cost-effective. A typical flowchart for procedure of vibration elimination is shown in Fig. 1.
Project documentation
Onsite Inspection Results
FEM Pipeline Model
Eigen Mode Analysis
Excitation Model Vibration
Measurements Results
Initial Vibration Calculation
Is Comparison OK?
Measures to eliminate Vibration
Vibration Calculation
Recommendation
Installation
Vibration Measurements
Report
NO YES
NETPULS SOFTWARE
As it could be seen from Fig. 1 results of vibration analysis is essentially depend on the Excitation Model. That is why a specialized software code NETPULS was developed to cover this issue.
The main objective of this code is evaluation of the acoustic oscillations in the liquid or gaseous medium in piping that experienced vibration induced by the steady-state processes in the transmitted medium. Acoustic oscillations can arise in pipeline discontinuities such as tees, throttles etc. and also can be caused by external sources connected to a pipeline. NETPULS is based on the linearized mathematical model of quasi-stationary acoustic oscillations in a compressed medium with accounting of non-linear damping effects due to hydraulic friction and local hydraulic losses. Software algorithm implements the finite-difference method in Galerkin formulation expressed in the complex arithmetic. Linear one-dimensional and dimensionless elements are used for the medium modeling.
A piping system consisting of a number of pipe loops and branches with different cross-sections and several harmonic and non-harmonic oscillation sources can be treated. The current version of NETPULS is valid for saturated, dry and wet steam and water, and can be updated for another mediums, if necessary. NETPULS has options for natural acoustic frequencies and modes calculations and for determination of the pressure and velocity amplitude and phase distribution along all piping branches for the case of forced acoustic vibration. The amplitude-frequency and phase-frequency characteristics of the gas-dynamic forces acting upon the piping discontinuities (elbows, tees, throttles etc.) are also defined. The output obtained by NETPULS can be used as input data for consequent analyses of mechanical vibrations of pipelines.
INTERACTION BETWEEN TRANSFERRED MEDIUM AND PIPE
Pressure pulsations in a medium induce dynamic forces in elbows, tees, throttles and pipe reducers. Action of these pulsations may be represented as a set of concentrated forces oriented along piping axis. For each pipe fitting direction and magnitude of resulting force-vector depend on the piping layout. For curved piping segments (elbows or bends) pressure pulsations produce the resulting force-vector as a combination of two vectors from adjusted straight pipes. Since the origin of this vector is located in the center of the bend curvature, it produces two in-plane bending moments. However, in the actual consideration these moments are neglected. Correctness of such assumption is discussed below. For tee elements a resulting force-vector acts along side branch. Pressure pulsations in local hydraulic restrictions (throttle, reducer, etc.) cause forces acted along pipe axis.
As a result of NETPULS analysis a set of complex vibration forces acted on the pipeline from the medium for each given frequency is produced.
DISCUSSION OF NETPULS ASSUMPTIONS
The algorithm implemented in NETPULS is based on the following two assumptions:
1) Acoustic vibration of the piping medium may be decoupled from the piping mechanical vibration. The reason for this assumption is the ratio between medium and piping masses (it is assumed that mass of medium is much less than piping mass). For example shown below the ratio of these masses is 1/82.
2) Vibration bending moments at elbows are not essential.
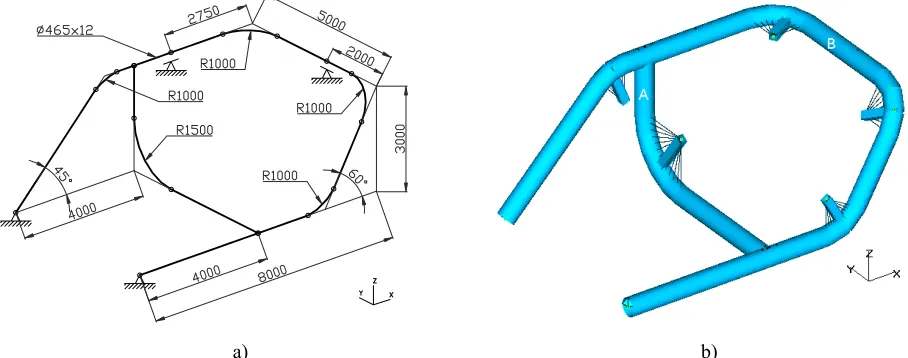
In order to investigate the influence of these assumptions a linear direct frequency response analysis was carried out with use of NASTRAN code. Piping FE model is shown in Fig. 2.
a) b)
In this example piping is modeled by straight and curved beam elements with cross-section ∅465x12. Boundary conditions for this model consist of two pinned terminal ends and two sliding supports. Damping ratio for piping was taken as 0.6% of critical damping. In future consideration this model will be referenced as “Pipe” model. Next
analytical model represents a model of medium. The superheated steam with pressure = 6.77 MPa, temperature = 280°C
and sound velocity = 496 m/s was modeled by rod elements. Damping ratio for steam was taken as 0.3% of critical damping. Two piping ends are opened. Pressure pulsation excites the steam at the near end (see Fig. 2b). This model will be referenced as “Steam” model. The low values of damping ratios were taken to obtain more obvious results. Three different variants of analyses have been performed in this study:
Variant #1 is a coupled model of piping and medium. Since of its completeness this variant will be treated as reference point. Variant incorporates “Steam” model inside “Pipe” model. Movement of medium along elbow curved axis is achieved with use of weightless rigid rod elements that link “steam” nodes and special node at the center of elbow, so the hydraulic force acts at this node. Then, this force is transferred to the “Pipe” model by weightless rigid beam element. In order to model steam behavior at tees a special lozenge configuration of “steam” elements have been used. This approach allows to satisfy medium flow equation. Hydraulic force is passed to the “Pipe” model along side branch direction.
Variant #2. A separate “Steam” model was considered on the first stage of analysis. Special nodes for interaction between models were constrained. Result of this analysis is complex reaction forces at these special nodes. On the second stage the “Pipe” model was analyzed using these reaction forces.
Variant #3. The first stage of analysis for this variant is the same as for previous one. Then, complex reaction forces in the special nodes were recalculated for points located along straight pipes. In this variant an additional bending moments were neglected. And finally, “Pipe” model was analyzed by applying these recalculated forces to straight pipes.
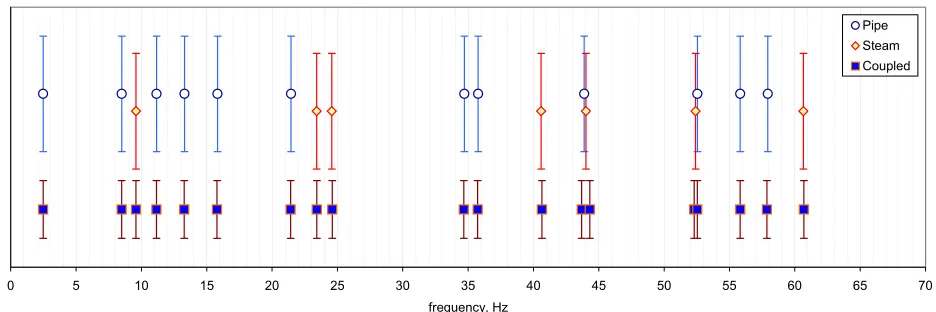
Fig. 3 shows distribution of eigen frequencies for above mentioned models.
0 5 10 15 20 25 30 35 40 45 50 55 60 65 70
frequency, Hz
Pipe Steam Coupled
Fig.3 Eigen frequencies for “Pipe”, “Steam” and “Coupled” models.
As it could be seen from this figure in the most cases “Pipe” and “Steam” models did not interact inside “Coupled” model. However, in case of close spaced frequencies (near 44 Hz) an effect of interaction could be observed – frequencies of the “coupled” model are tuned out in comparison with "Pipe" and "Steam" models.
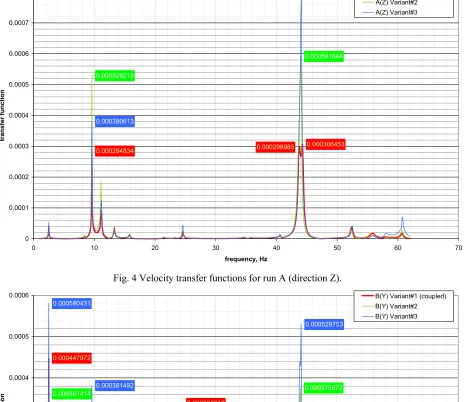
In order to compare three variants mentioned above a set of transfer functions was calculated. These transfer functions are ratios of “Pipe” velocity amplitude to pressure pulsation amplitude. These transfer functions were calculated for piping run A (direction Z) and run B (direction Y) as shown in Fig. 2b.
Fig. 4 and Fig. 5 show these transfer functions for three variants of analysis. There are many essential resonances, but there are no resonances for some number of eigen frequencies. The reason for this phenomenon is that unbalanced force in straight pipe (run) may appear only if forces at opposite ends have a different amplitude or phase. It is well known that resonance can be more severe when acoustical and structural frequencies are coincided. However little peaks near frequency 52.5 Hz show as this expectation is not ever meet. Most probably that deep resonance is caused only in case when distribution of flow-induced forces coincides with structural eigen mode.
Correctness of assumption #1 (“decoupling” of models) may be estimated by comparing of transfer functions for variants #1 and #2. Peak values for the main resonance frequencies may differ up two times. Most significant difference is near frequency 44 Hz, and this is in a good agreement with previous eigen frequency analysis. Another strange phenomenon is near frequency 9.5 Hz (run B, direction Y).
Correctness of assumption #2 (bending moments neglecting) may be estimated by comparing of transfer functions for variants #2 and #3. Peak values for main resonance frequencies may differ up 1.6 times.
uncertainty. For example, in the case of vortex shedding near the tee, pressure pulsation frequency will depend on medium parameters, the tee geometry and even on quality of processing [2, 7].
0.000298985 0.000306453
0.000284834
0.000591644
0.000529213
0.000380613
0.000799195
0 0.0001 0.0002 0.0003 0.0004 0.0005 0.0006 0.0007 0.0008
0 10 20 30 40 50 60 7
frequency, Hz
transfer function
0 A(Z) Variant#1 (coupled) A(Z) Variant#2 A(Z) Variant#3
Fig. 4 Velocity transfer functions for run A (direction Z).
0.000338316
0.000262273 0.000447972
0.000141257 0.000361414
0.000105453
0.000293838
0.000375872
0.000164692 0.000529753
0.000580431
0.000381492
0.000283951
0.000206981
0 0.0001 0.0002 0.0003 0.0004 0.0005 0.0006
0 10 20 30 40 50 60
frequency, Hz
transfer function
70 B(Y) Variant#1 (coupled) B(Y) Variant#2 B(Y) Variant#3
Fig. 5 Velocity transfer functions for run B (direction Y).
implementation of proposed procedure (see Fig. 1) makes possible to choose vibration source parameters so that model will adjusted to the real piping. In this case the influence of considered assumptions is not so essential.
EXAMPLE OF PRACTICAL IMPLEMENTATION
CKTI-Vibroseism company has participated in a number of projects for elimination of operational piping vibration for the following NPPs: Balakovo (Russia), Chernobyl (Ukraine) [6], Ignalina (Lithuania), Kalinin (Russia), Kola (Russia), Kozloduy (Bulgaria), Leningrad (Russia), Loviisa (Finland).
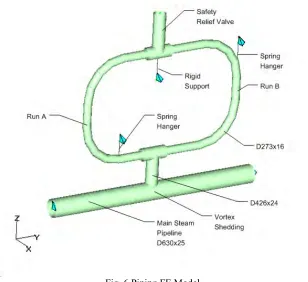
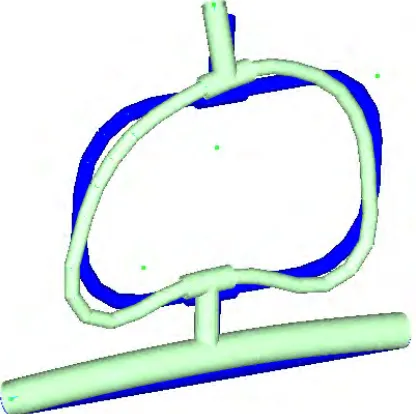
A practical implementation of described procedure will be illustrated for the typical VVER-1000 Steam Line located outside containment area. FE model of this system is shown in Fig. 6.
Fig. 6 Piping FE Model
Each of VVER-1000 units contains 12 such systems with a little bit different layout. Some of these systems experience excessive vibration, another systems have moderate level of vibration. Allowable level of operating vibration may be defined either on the basis of the OM-3 Code [1], or by functional requirements [6] or by customer requirement. For considered piping an essential level of vibration was measured on run A and run B in vertical direction. The results of measurements demonstrated the following values: for run A, Vpeak = 94.4 mm/s, Vrms = 54.4 mm/s, for run B, Vpeak = 69.1 mm/s, Vrms = 40.2 mm/s. Measured vibration frequency was near 39 Hz.
It was assumed that vibration source is vortex shedding in the tee on the main steam pipeline. Parameters of Vibration source were chosen according to Rayleigh distribution (Fig. 7).
0 100 200 300 400 500 600 700 800
0 5 10 15 20 25 30 35 40 45 50
frequency, Hz
pressure, Pa
-0.25 -0.2 -0.15 -0.1 -0.05 0 0.05 0.1 0.15 0.2 0.25
0 2 4 6 8 10 12 14 16 1
Coordinate, m
Modal Pressure
8 mode#1 (11.99 Hz) mode#2 (32.15 Hz) mode#3 (38.51 Hz)
The following steam parameters were used for “Steam” model: pressure = 6.40 MPa, temperature = 297°C, sound velocity = 523 m/sec. Natural frequency analysis for the “Steam” model have been done by NETPULS software code. The following natural frequencies were defined: 11.99, 32.15, 38.51, 64.41 Hz. Fig.8 shows three eigen modes for distribution of steam pressure along main piping loop. Vibration forces have been calculated in the frequency range from 1 to 50 Hz with frequency step 0.1 Hz.
A traditional FEM approach was used for “Pipe” model. Damping ratio for piping was taken equal to 5% of the critical damping. Analysis for this model has been done by NASTRAN. Natural frequencies of "Pipe" model are: 6.59, 9.54, 10.01, 13.07, 13.38, 21.26, 21.56, 22.25, 24.36, 35.23, 39.24, 46.01, 49.97 Hz. Eigen mode #11 is shown in Fig. 9.
K
1B
1K
2B
2Fig. 9 Eigen Mode #11 (39.24 Hz) Fig. 10 Analytical Model for Visco-elastic Damper
Vibration analysis according to Variant#3 has been carried out by NASTRAN code with use of “Direct Frequency Response Analysis” feature. In course of analysis the level of excitation was scaled to adjust a peak values of vibrovelocity to the measured values. Calculated results are: run A, Vpeak = 89.9 mm/s, run B, Vpeak = 85.9 mm/s. Then, after adjusting the model to the observed vibration conditions, a set of analyses has been performed to find the optimal way for vibration reducing. Two main possibilities were investigated:
1) Installation of Pipework Viscous dampers. In course of analyses the type and location of dampers were varied to achieve optimal results. 4-parameter Maxwell model of Viscous Damper was used for FE analysis (Fig. 10, [3]). Finally installation of two damper devices was recommended on the vertical runs A and B.
2) Installation of Throttle. Throttle may have different orifice diameter. The optimal place for location of throttle is a point with maximum modal velocity for “Steam” eigen mode #3. This point corresponds to zero value for modal pressure and may be chosen from Fig. 8. Thus the best place for the throttle was defined as a middle of a vertical run (A or B). Throttle model is a standard feature of NETPULS.
Based on performed analyses two most efficient variants for reducing of operational vibration may be recommended for this typical case (Table 1). Comparative results in terms of velocity spectra are shown in Fig. 11.
Table 1 Two variants for elimination of operating vibration on VVER-1000 Steam Line.
Peak Value of Vibrovelocity, mm/s Variant
Run A Run B
Initial State 89.9 85.9
Installation of two GERB dampers. 20.2 19.2
Installation of throttle device. 22.9 21.9
0 0 .0 1 0 .0 2 0 .0 3 0 .0 4 0 .0 5 0 .0 6 0 .0 7 0 .0 8 0 .0 9 0 .1
0 5 1 0 1 5 2 0 2 5 3 0 3 5 4 0 4 5 5 0
f r e q u e n c y , H z
velocity, m/s
in it ia l s t a t e d a m p e r s t h r o t tle
Fig. 11 Calculated Vibrovelocity Spectra at Run A.
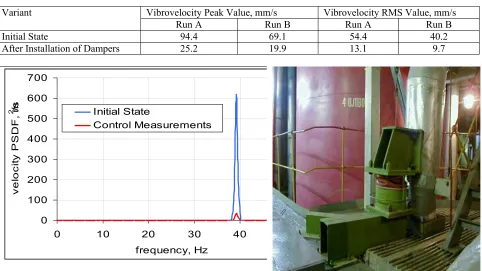
After installation of viscous dampers a control vibration measurements have been performed during Unit nominal Power. Comparison of vibration parameters before and after dampers installation is given in Table 2. Comparison of measured velocity spectra (in terms of Power Spectrum Density Function) is presented in Fig. 12.
Table 2. Comparison of measured vibration parameters before and after dampers installation.
Vibrovelocity Peak Value, mm/s Vibrovelocity RMS Value, mm/s
Variant
Run A Run B Run A Run B
Initial State 94.4 69.1 54.4 40.2
After Installation of Dampers 25.2 19.9 13.1 9.7
0 100 200 300 400 500 600 700
0 10 20 30 40
frequency, Hz
vel
o
ci
ty
P
S
D
F
,
m
2 /s Initial State
Control Measurements
Fig. 12 Measured Power Spectrum Density Functions at Run A. Fig. 13 Installation of GERB Viscous Damper (Run
B)
CONCLUSIONS
At the same time there are some options for further development. To avoid described shortcomings of NETPULS approaches the complex piping vibration analysis tool should be developed by incorporating NETPULS code with specialized piping software program dPIPE [8, 9]. Also an experimental model will help to verify developed software against experiment.
REFERENCES
1. Requirements for Pre-operational and Initial Start-up Vibration Testing of Nuclear Power Plant Piping Systems. ASME OMa S/G-1991 STANDARD Part 3.
2. H. R. Simons, A. Lifshits. Vibration Measurements for Determining Plant Component Reliability. Proceedings of the American Power Conference, 1985, v.47.
3. V. Kostarev, A. Berkovski, O. Kireev, P. Vasilyev. Application of mathematical model for high viscous damper to dynamic analysis of NPP piping. Proc. of 10th ECEE, 1994, Vienna, Austria.
4. D. Seligman, J. Guillou. Flow induced vibration in a PWR piping system. Transactions of the SMiRT 13, Porto Alegre, Brazil, August 13-18, 1995
5. V. Kostarev, A. Berkovski, A. Schukin. Upgrading of dynamic reliability and life extension of piping by means of high viscous damper technology. Transactions of PVP ASME Conference, Boston 1999
6. V. Fomin, V. Kostarev, K-H. Reinsch. Elimination of Chernobyl NPP Unit 3 Power Output Limitation Associated with High Main Steam Piping Flow Induced Vibration. Transactions of the SMiRT 16, Washington DC, August 2001
7. D. E. Olson. Pipe Vibration Testing and Analysis. Companion Guide to the ASME Boiler & Pressure Vessel Code. Chapter 37. ASME PRESS, New York, 2002
8. Computer Software Code for Piping Dynamic Analysis dPIPE, Verification Manual Report No. co06-96x.vvk-01, St. Petersburg, 1997