555-233-505
Comcode 108596388
Issue 1
April 2000
Enterprise Communication Server
Release 8.2
Printed in U.S.A.
Notice
Every effort was made to ensure that the information in this book was complete and accurate at the time of printing. However, information is subject to change.
Your Responsibility for Your System’s Security
Toll fraud is the unauthorized use of your telecommunications system by an unauthorized party, for example, persons other than your com-pany’s employees, agents, subcontractors, or persons working on your company’s behalf. Note that there may be a risk of toll fraud associated with your telecommunications system and, if toll fraud occurs, it can result in substantial additional charges for your telecommunications services.
You and your system manager are responsible for the security of your system, such as programming and configuring your equipment to pre-vent unauthorized use. The system manager is also responsible for reading all installation, instruction, and system administration docu-ments provided with this product in order to fully understand the fea-tures that can introduce risk of toll fraud and the steps that can be taken to reduce that risk. Lucent Technologies does not warrant that this product is immune from or will prevent unauthorized use of com-mon-carrier telecommunication services or facilities accessed through or connected to it. Lucent Technologies will not be responsible for any charges that result from such unauthorized use.
Lucent Technologies Fraud Intervention
If you suspect that you are being victimized by toll fraud and you need technical support or assistance, call Technical Service Center Toll Fraud Intervention Hotline at 1 800 643-2353.
Federal Communications Commission Statement
Part 15: Class A Statement. This equipment has been tested and
found to comply with the limits for a Class A digital device, pursuant to Part 15 of the FCC Rules. These limits are designed to provide rea-sonable protection against harmful interference when the equipment is operated in a commercial environment. This equipment generates, uses, and can radiate radio-frequency energy and, if not installed and used in accordance with the instructions, may cause harmful interfer-ence to radio communications. Operation of this equipment in a resi-dential area is likely to cause harmful interference, in which case the user will be required to correct the interference at his own expense.
Part 68: Network Registration Number. This equipment is registered
with the FCC in accordance with Part 68 of the FCC Rules. It is identi-fied by FCC registration number AS593M-13283-MF-E.
Part 68: Answer-Supervision Signaling. Allowing this equipment to
be operated in a manner that does not provide proper answer-supervi-sion signaling is in violation of Part 68 Rules. This equipment returns answer-supervision signals to the public switched network when:
• Answered by the called station • Answered by the attendant
• Routed to a recorded announcement that can be administered by the CPE user
This equipment returns answer-supervision signals on all DID calls forwarded back to the public switched telephone network. Permissible exceptions are:
• A call is unanswered • A busy tone is received • A reorder tone is received
Canadian Department of Communications (DOC) Interference Information
This digital apparatus does not exceed the Class A limits for radio noise emissions set out in the radio interference regulations of the Canadian Department of Communications.
Le Présent Appareil Nomérique n’émet pas de bruits radioélectriques dépassant les limites applicables aux appareils numériques de la class A préscrites dans le reglement sur le brouillage radioélectrique édicté par le ministére des Communications du Canada.
Trademarks
See the preface of this document.
Ordering Information
Call: Lucent Technologies Publications Center
Voice 1 800 457-1235 International Voice 317 322-6416 Fax 1 800 457-1764 International Fax 317 322-6699
Write: Lucent Technologies Publications Center 2855 N. Franklin Road
Indianapolis, IN 46219
Order: Document No. 555-233-505 Issue 1, April 2000
For additional documents, refer to the section in “About This Docu-ment” entitled “Related Resources.”
You can be placed on a standing order list for this and other documents you may need. Standing order will enable you to automatically receive updated versions of individual documents or document sets, billed to account information that you provide. For more information on stand-ing orders, or to be put on a list to receive future issues of this docu-ment, contact the Lucent Technologies Publications Center.
European Union Declaration of Conformity
The “CE” mark affixed to the DEFINITY® equipment described in this book indicates that the equipment conforms to the following Euro-pean Union (EU) Directives:
• Electromagnetic Compatibility (89/336/EEC) • Low Voltage (73/23/EEC)
• Telecommunications Terminal Equipment (TTE) i-CTR3 BRI and i-CTR4 PRI
For more information on standards compliance, contact your local dis-tributor.
Comments
To comment on this document, return the comment card at the front of the document.
Acknowledgment
Contents
iii
Contents
Contents iii
About This Document xiii
■ Purpose of Traffic Reports xiii
■ Who Should Read This Document xiv
■ How This Document Is Organized xiv
■ Trademarks and Service Marks xv
■ Conventions Used in This Document xvi
■ Related Resources xvii
■ How to Make Comments about This
Document xvii
1
How to Enter Commands andDisplay and Print Reports 1-1
■ Commands and the Command
Line Format 1-1
Monitor Commands 1-4
List Commands 1-4
Display Commands 1-4
Change Commands 1-5
Clear Commands 1-5
■ Displaying Reports 1-5
■ Screen Format 1-6
■ Command Structure 1-9
■ G3csi, G3si, and G3r Reports 1-10
2
System Printer and Report-Scheduler 2-1■ System Printer 2-1
System Printer Data Link Operation
and Maintenance 2-3
■ Report Scheduler 2-4
Print Intervals 2-4
Adding a Report to the Report Scheduler 2-5 Summary of Steps for Printing
Contents
iv
Listing Scheduled Reports 2-7
Command 2-8
Change Command 2-10
Remove Command 2-11
3
Traffic Data Analysis 3-1■ How This Chapter Is Organized 3-1
■ General Information about Reports 3-3
Report Screen Fields 3-3
■ Attendant Group Reports 3-4
■ Attendant Group Report 3-4
Command 3-4
Screen 3-4
■ Attendant Positions Report 3-11
Command 3-11
Screen 3-11
■ Attendant Performance Report 3-13
Command 3-13
Screen 3-13
Data Analysis Guidelines 3-15
Analyzing the Report Data 3-15
■ Automatic Circuit Assurance 3-25
■ ACA Parameters Report 3-26
Command 3-26
Screen 3-27
■ ACA Measurements Report 3-30
Command 3-30
Screen 3-30
■ ARS/AAR/UDP Route Pattern 3-33
Command 3-33
Screen 3-34
■ ARS/AAR/UDP Route Pattern Measurements Report 3-35
Command 3-35
Screen 3-36
Data Analysis Guidelines 3-40
Contents
v
■ Call Rate Measurements Reports 3-42
Command 3-42
Screen 3-43
■ Call Summary Measurements Report 3-45
Command 3-45
Screen 3-45
■ Call Coverage Measurements Reports 3-48
Terms 3-48
Feature Interactions 3-48
Data Analysis Guidelines 3-49
■ Coverage Path Measurements Selection 3-50
Command 3-50
Screen 3-51
■ Coverage Path Measurements Report 3-52
Command 3-52
Screen 3-53
■ Principal Coverage Measurements Selection 3-55
Command 3-55
Screen 3-56
■ Principal Coverage Measurements Report 3-57
Command 3-57
Screen 3-58
■ DS1 Link Performance Measurements 3-60 ■ DS1 Link Performance Measurements
Summary Report 3-62
Command 3-62
Screen 3-63
■ DS1 Link Performance Detailed Log Report 3-67
Command 3-67
Screen 3-68
■ DS1 Converter Reports 3-71
Command 3-72
Screen 3-73
■ Emergency Access Calls Report 3-77
Command 3-77
Contents
vi
■ Hunt Group Reports 3-79
■ Hunt Groups Report 3-79
Command 3-79
Screen 3-80
■ Hunt Group Members Report 3-82
Command 3-82
Screen 3-83
■ Hunt Group Measurements Report 3-85
Command 3-85
Screen 3-86
Data Analysis Guidelines 3-89
Analyzing the Data 3-89
Total Usage 3-91
■ Hunt Group Performance Report 3-93
Command 3-93
Screen 3-93
■ Hunt Group Status Report 3-95
Command 3-95
Screen 3-95
■ LAN Performance Reports 3-97
Commands 3-97
Screens 3-98
■ LAR Route Pattern Measurements Report 3-100
Command 3-100
Screen 3-101
■ Logins Report 3-103
Command 3-103
Screen 3-103
■ Modem Pool Groups Report 3-104
Command 3-104
Screen 3-105
■ Multimedia Reports 3-107
■ MMI Report 3-107
Command 3-107
Contents
vii
■ ESM Reports 3-110
Command 3-110
Screen 3-111
■ VC Reports 3-113
Command 3-113
Screen 3-113
■ Performance Summary Report 3-116
Command 3-116
Screen 3-116
■ Port Network Reports 3-119
■ Blockage Study Report 3-119
Command 3-121
Port Network Screen 3-121
Switch Node Screen 3-124
■ Port Network Load Balance Report 3-125
Command 3-126
■ Port Network Load Balance
Total Calls Report 3-127
Screen 3-127
■ Port Network Load Balance
Intercom Calls Report 3-130
Screen 3-130
■ Port Network Load Balance
Incoming Calls Report 3-131
Screen 3-131
■ Port Network Load Balance
Outgoing Calls Report 3-132
Screen 3-132
■ Port Network Load Balance
Tandem Calls Report 3-134
Screen 3-134
■ System Status Reports 3-136
Command 3-136
Screen 3-137
■ Tone Receiver Summary Report 3-140
Command 3-140
Contents
viii
■ Tone Receiver Detail Report 3-143
Command 3-144
Screen 3-144
■ Trace Route Report 3-147
Commands 3-147
Screen 3-147
■ Traffic Summary Report 3-149
Command 3-149
Screen 3-150
■ Trunk Group Reports 3-154
■ Trunk Group Summary Report 3-154
Command 3-155
Screen 3-155
■ Trunk Group Hourly Report 3-162
Command 3-162
Screen 3-163
■ Trunk Group Measurement Selection 3-165
Command 3-165
Screen 3-166
■ Trunk Group Performance Report 3-167
Command 3-167
Screen 3-167
■ Trunk Outage Measurements Report 3-170
Command 3-170
Screen 3-171
■ Trunk Group Status Report 3-174
Command 3-174
Screen 3-174
Data Analysis Guidelines 3-176
Analyzing the Data 3-177
■ Trunk Group Call-By-Call (CBC) 3-183
Background Information 3-183
■ Trunk Group Call-By-Call
Measurements Report 3-185
Command 3-185
Contents
ix
■ Trunk Lightly Used
Measurements Report 3-193
Command 3-193
Screen 3-193
■ Wideband Trunk Groups 3-195
■ Wideband Trunk Group
Summary Report 3-196
Command 3-196
Screen 3-196
■ Wideband Trunk Group
Hourly Report 3-201
Command 3-201
Screen 3-201
■ Wideband Trunk Group Measurement Selection 3-204
Command 3-204
Screen 3-205
Data Analysis Guidelines 3-205
Wideband Trunk Group Summary Report 3-206 Wideband Trunk Group Hourly Report 3-207
Performance Considerations 3-207
4
Processor Occupancy Reports 4-1■ Processor Occupancy Reports 4-1
■ The Summary Command 4-3
When to Use the Summary Command 4-3
■ Processor Occupancy Summary Report 4-4
Command 4-4
Screen 4-4
■ The Last-Hour Command 4-9
When to Use the Last-Hour Command 4-9 ■ Processor Occupancy Last-Hour
Measurements Report 4-9
Command 4-9
Screen 4-10
Using the Last-Hour Report to Resolve Problems 4-10
■ The Busiest-Interval Command 4-11
Contents
x
■ Processor Occupancy Busiest-Interval
Measurements Report 4-11
Command 4-11
Screen 4-11
Using the Busiest-Interval Report
to Resolve Problems 4-12
■ The Pktint Command 4-13
When to Use the Pktint Command 4-13
■ Processor Occupancy Pktint Report 4-13
Command 4-13
Screen 4-13
■ The Communications Links Command 4-15
When to Use the Communications
Links Command 4-15
■ Processor Occupancy Communications
Link Measurements Report 4-15
Command 4-15
Screen 4-16
■ Mapping Links to Applications 4-18
Command 4-18
Screen 4-18
Data Analysis Guidelines 4-20
Analyzing the Data 4-20
5
Security Violations Reports 5-1■ Security Violations Summary Report 5-1
Commands 5-1
Screen 5-2
■ Security Violations Detail Report 5-7
Commands 5-7
Screen 5-8
■ Security Violations Status Reports 5-10
Login Violations 5-10
Contents
xi
Screens 5-10
Security Violations Status—Authorization
Code Violations report 5-14
Security Violations Status—Station Security Code
Violations report 5-16
6
History Reports 6-1■ History Reports 6-1
Data Commands 6-2
■ History Report 6-3
Command 6-3
Screen 6-3
■ Access Security Gateway
Session History Report 6-6
Command 6-6
Screen 6-6
A
Blank Worksheets A-1GL
Glossary and Abbreviations GL-1Contents
About This Document
xiii Purpose of Traffic Reports
About This Document
This document provides a comprehensive description of the performance reports that are available with the DEFINITY Enterprise Communications Server (ECS).
Purpose of Traffic Reports
The traffic measurements and their associated reports are designed to monitor and collect traffic data (also called usage data) for trunk groups, hunt groups, the attendant group, and so on. The system accumulates and stores the traffic data. You can display (and/or print) the traffic data, as an organized report, by issuing the appropriate identifying command from the management terminal.
The system reports and the supporting information contained within this document permit you to:
■ Monitor and evaluate system performance
■ Monitor security violations data, which identifies illegal attempts to access
the system
■ Observe usage trends and recommend possible corrective actions, as
needed
■ Determine the source of performance degradations (for example,
processor overload)
■ Determine possible trunk problems (for example, blocking level too high)
About This Document
xiv Who Should Read This Document
Who Should Read This Document
This document is intended for:
■ System Administrators
■ Communications System Managers
■ Technicians who resolve certain usage-related customer complaints
■ Technicians who plan system expansions and upgrades
■ Personnel involved in traffic engineering
NOTE:
You do not need a thorough knowledge of traffic theory to use the information contained in this document. However, such knowledge is helpful if you want to perform in-depth analysis of the traffic data presented in the various reports.
How This Document Is Organized
This document consists of six chapters, an appendix, a list of abbreviations, and a glossary.
■ Chapter 1, ‘‘How to Enter Commands and Display and Print Reports’’ lists
each traffic command, describes the different types of commands, and describes how to enter a command to display and/or print a report.
■ Chapter 2, ‘‘System Printer and Report-Scheduler’’ describes the Report
Scheduler software and how to schedule and print reports on the system printer.
■ Chapter 3, ‘‘Traffic Data Analysis’’ provides detailed descriptions of the
traffic measurement reports, excluding processor occupancy and security violations reports.
■ Chapter 4, ‘‘Processor Occupancy Reports’’ describes the purpose of
these four reports, when to use each report, and how to interpret each report’s data. It also lists “Suggested Actions” that may be taken if a particular field should report data indicating an abnormal condition.
■ Chapter 5, ‘‘Security Violations Reports’’ describes the reports that contain
data on possible security violations.
■ Chapter 6, ‘‘History Reports’’ describes the History report that lists the
most recent administration and maintenance changes and the Access Security Gateway Session History report of all session establishment and rejection events.
■ Appendix A, ‘‘Blank Worksheets’’.
About This Document
xv Trademarks and Service Marks
— Routing Pattern Data Worksheet
—
Used for historical purposes to record the Routing Pattern daily measurements for the selected pattern number and days.— Hunt Group Data Worksheet
—
Used for historical purposes to record the Hunt Group daily measurements for the selected hunt group and days.— Trunk Group Data Worksheet
—
Used for historical purposes to record the Trunk Group daily measurements for the selected trunk group and days.— Wideband Trunk Group Worksheet
—
Used for historical purposes to record the Wideband Trunk Group daily measurements for the selected trunk groups and days.— Processor Occupancy Data Worksheets
—
Used for historical purposes to record the Processor Occupancy daily measurements for the selected days.— General Traffic, ACD, and CallVisor. ASAI/OCM Applications
—
Used to calculate the BHCC for complex traffic applications.
■ Appendix B, ‘‘References’’ provides an abbreviated listing and description
of system documents. Ordering information is also included.
■ Glossary and Abbreviations contains a list of abbreviations, frequently
used terms and their definitions.
■ Index.
Trademarks and Service Marks
The following are trademarks or registered trademarks of Lucent Technologies:
■ 5ESS
™,
4ESS™
■ AUDIX®■ Callvisor® ■ Callmaster® ■ CentreVu™
About This Document
xvi Conventions Used in This Document
The following are trademarks or registered trademarks of AT&T:
■ ACCUNET® ■ DATAPHONE® ■ MEGACOM® ■ MULTIQUEST® ■ TELESEER®
The following are trademarks or registered trademarks of other companies:
■ Ascend®(registered trademark of Ascend, Inc.)
■ Audichron® (registered trademark of the Audichron Company) ■ MS-DOS® (registered trademark of the Microsoft Corporation) ■ MicroChannel® (registered trademark of IBM Systems)
■ MULTIQUEST® (registered trademark of Telecommunications Service) ■ PagePac® (trademark of the Dracon Division of the Harris Corporation) ■ UNIX®
(
trademark of the Novell Corporation)Conventions Used in This Document
This manual uses the following conventions:
■ Anything that you type at the command prompt appears in the following
typeface:
list measurements blockage pn
■ Any required fields for commands appear enclosed by <>, for example: list measurements blockage pn
<yesterday-peak/today-peak/last-hour>
■ Any optional fields appear enclosed by [], for example: list measurements blockage pn
<yesterday-peak/today-peak/last-hour> [print/schedule]
About This Document
xvii Related Resources
Related Resources
For the names and document numbers of manuals that contain additional information, see Appendix B, ‘‘References’’ in this book.
How to Make Comments about This
Document
Reader comment cards are provided at the front of this document. While we have tried to make this document fit your needs, we are interested in your suggestions for improving it and urge you to complete and return a reader comment card.
If the reader comment cards have been removed from this document, please send your comments to:
Lucent Technologies
Product Documentation Development Group Room 22-2H15
About This Document
How to Enter Commands and Display and Print Reports
1-1 Commands and the Command Line Format
1
1
How to Enter Commands and
Display and Print Reports
Commands and the Command
Line Format
The DEFINITY Enterprise Communications Server (ECS) management terminal is the primary device for issuing commands to the system. Following a successful login procedure, the screen displays the prompt:
Command:
If you know it, enter the complete command. Alternately, you can use HELP to obtain the list of permissible commands.
How to Enter Commands and Display and Print Reports
1-2 Commands and the Command Line Format
1
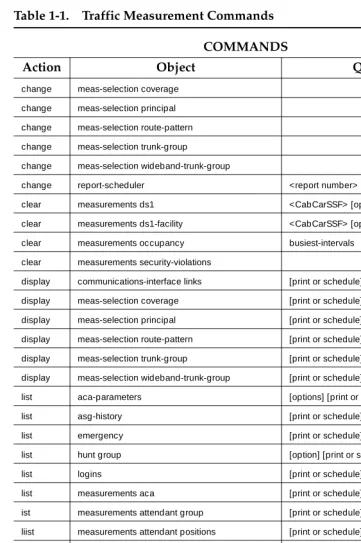
Table 1-1. Traffic Measurement Commands
COMMANDS
Action Object Qualifier
change meas-selection coverage change meas-selection principal change meas-selection route-pattern change meas-selection trunk-group change meas-selection wideband-trunk-group
change report-scheduler <report number> clear measurements ds1 <CabCarSSF> [options]
clear measurements ds1-facility <CabCarSSF> [options] [print or schedule] clear measurements occupancy busiest-intervals
clear measurements security-violations
display communications-interface links [print or schedule] display meas-selection coverage [print or schedule] display meas-selection principal [print or schedule] display meas-selection route-pattern [print or schedule] display meas-selection trunk-group [print or schedule] display meas-selection wideband-trunk-group [print or schedule] list aca-parameters [options] [print or schedule] list asg-history [print or schedule] list emergency [print or schedule] list hunt group [option] [print or schedule] list logins [print or schedule] list measurements aca [print or schedule] ist measurements attendant group [print or schedule] liist measurements attendant positions [print or schedule]
list measurements blockage pn <required field> [print or schedule] list measurements blockage sn [option] [print or schedule] list measurements call-rate <required field> [print or schedule] list measurements call-summary [print or schedule]
list measurements cbc-trunk-group <ISDN CBC tgn>last-hour[print or schedule] list measurements clan ethernet <CabCarSSF> [print or schedule] list measurements clan ppp <CabCarSSF> [print or schedule] list measurements communications-links <xx-yy>[print or schedule]
list measurements coverage-path <required field>[options] [print or schedule]
How to Enter Commands and Display and Print Reports
1-3 Commands and the Command Line Format
1
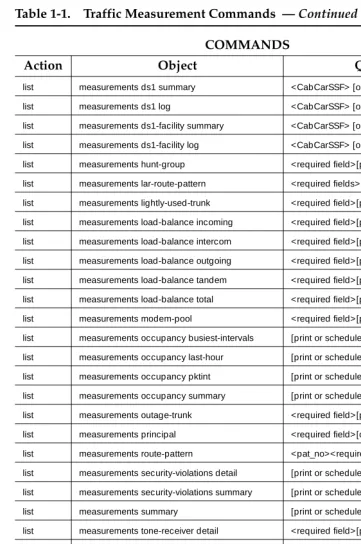
list measurements ds1 summary <CabCarSSF> [options] [print or schedule] list measurements ds1 log <CabCarSSF> [options] [print or schedule] list measurements ds1-facility summary <CabCarSSF> [options] [print or schedule] list measurements ds1-facility log <CabCarSSF> [options] [print or schedule] list measurements hunt-group <required field>[print or schedule] list measurements lar-route-pattern <required fields>[option] [print or schedule] list measurements lightly-used-trunk <required field>[print or schedule] list measurements load-balance incoming <required field>[print or schedule] list measurements load-balance intercom <required field>[print or schedule] list measurements load-balance outgoing <required field>[print or schedule] list measurements load-balance tandem <required field>[print or schedule] list measurements load-balance total <required field>[print or schedule] list measurements modem-pool <required field>[print or schedule] list measurements occupancy busiest-intervals [print or schedule]
list measurements occupancy last-hour [print or schedule] list measurements occupancy pktint [print or schedule] list measurements occupancy summary [print or schedule]
list measurements outage-trunk <required field>[print or schedule] list measurements principal <required field>[options] [print or schedule] list measurements route-pattern <pat_no><required field>[print or schedule] list measurements security-violations detail [print or schedule]
list measurements security-violations summary [print or schedule] list measurements summary [print or schedule]
list measurements tone-receiver detail <required field>[print or schedule] list measurements tone-receiver summary <required field>[print or schedule] list measurements trunk-group hourly <tgn> [print or schedule] list measurements trunk-group summary <required field>[print or schedule] list measurements wideband-trunk-group hourly <tgn>[print or schedule] list measurements wideband-trunk-group summary <required field>[print or schedule] list performance attendant <required field>[print or schedule] list performance hunt-group <required field>[print or schedule] list performance summary <required field>[print or schedule] list performance trunk-group <required field>[print or schedule]
Table 1-1. Traffic Measurement Commands — Continued
COMMANDS
Action Object Qualifier
How to Enter Commands and Display and Print Reports
1-4 Commands and the Command Line Format
1
Monitor Commands
Use the monitor command to display real-time status reports. Whenever a status report is displayed on the management terminal, it is automatically updated every thirty seconds. Press CANCEL to abort the monitor command.
NOTE:
When canceling out of some monitor commands, the management terminal interface is automatically logged off. This is not administrable.
If the status report consists of more than one page, use NEXT PAGE to display any subsequent pages and PREV PAGE to display previous pages.
If you enter the monitor command incorrectly, or if the qualifier is not applicable or cannot be measured, a descriptive error message appears on the message line. The message line is the bottom line on the screen. Usually the error messages provide enough detail to determine the problem. However, you may press HELP when needed.
List Commands
Use the list command to obtain historical information for a list of all (or a selected range of) attendants, trunk groups, hunt groups, and so on.
Display Commands
Use the display command to identify the parameters associated with a specific object/qualifier (for example, the parameters being measured).
list report-scheduler [print or schedule] monitor security-violations <required field>[print]
monitor system <conn>, <scr>, <view1>, <view2> monitor traffic hunt-groups <hgn> starting group number monitor traffic trunk-groups <tgn> starting group number monitor trunk <tgn>[member #]
remove report-scheduler <report number>
Table 1-1. Traffic Measurement Commands — Continued
COMMANDS
Action Object Qualifier
How to Enter Commands and Display and Print Reports
1-5 Displaying Reports
1
Change Commands
Use the change command to alter the group of parameters being measured.
Clear Commands
Use the clear command to remove the measurement data generated as the result of an alarm or a system irregularity.
Displaying Reports
The commands, listed in Table 1-1, and the resulting reports are described in detail in Chapters 2–6.
Each of the monitor and list commands, depicted in Table 1-1, results in producing (displaying) a different report on the management terminal screen. If the command line qualifier print is selected
—
the report is immediately printed on the slave printer associated with the management terminal. Whenever the command line qualifier schedule is initially executed, the system defaults the report for immediate printing (on the System Printer unless a day and time of day is scheduled) and generates a Job Id. The Job Id is required by the Report Scheduler feature for updating and deleting the schedule of reports. The Report Scheduler, which is described in Chapter 2, ‘‘System Printer andHow to Enter Commands and Display and Print Reports
1-6 Screen Format
1
Screen Format
The on screen format for reports is as shown in Figure 1-1.
Figure 1-1. Screen Format
list measurements occupancy summary Page 1
Switch Name: Date: 11:33 am TUE JUL 31, 1990
OCCUPANCY SUMMARY MEASUREMENTS
Peak Hour For Occupancy: 1400
Meas Hour 1000 900 800 700 600 500 400 300 200 100 Stat Occ 5 5 5 5 5 5 5 5 5 5 CP Occ 57 56 56 58 57 58 57 58 57 58 Sm Occ 16 15 15 15 15 15 15 16 15 15 Idle Occ 22 24 24 22 23 22 23 21 23 22 Total Calls 4410 5010 3823 1301 1287 1108 1267 1099 1049 701 Total Atmpt 5705 6499 4969 1691 1436 1294 1601 1312 1278 901 Intcom Atmpt 1439 1637 1644 421 359 324 483 329 319 267 Inc Atmpt 1461 1601 1620 361 301 298 384 205 226 206 Out Atmpt 1510 1383 626 384 223 268 361 301 281 246 Pnet Atmpt 1395 1878 1079 525 553 404 373 477 452 182
press CANCEL to quit -- press NEXT PAGE to continue
How to Enter Commands and Display and Print Reports
1-7 Screen Format
1
Error messages appear highlighted above the command line, as shown in Figure 1-2.
Figure 1-2. Error Message
list measurements occupancy summary Page 1
]"x" an invalid identifier; please press HELP[
Error Message
How to Enter Commands and Display and Print Reports
1-8 Screen Format
1
Commands that you type appear as shown in Figure 1-3.
Figure 1-3. Command Line
list measurements occupancy summary Page 1
Command Line
How to Enter Commands and Display and Print Reports
1-9 Command Structure
1
Command Structure
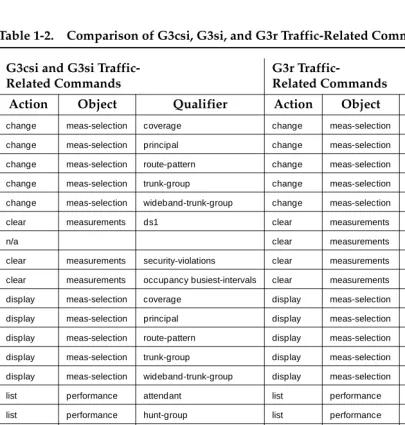
A common command structure is shared across the G3csi, G3si, and G3r machines. Table 1-2 lists the categories of commands on the specified machines. Not listed are the list measurements commands. For the list measurements commands, refer to Table 1-1.
Table 1-2. Comparison of G3csi, G3si, and G3r Traffic-Related Commands
G3csi and G3si Traffic-Related Commands
G3r
Traffic-Related Commands
Action Object Qualifier Action Object Qualifier
change meas-selection coverage change meas-selection coverage change meas-selection principal change meas-selection principal change meas-selection route-pattern change meas-selection route-pattern change meas-selection trunk-group change meas-selection trunk-group change meas-selection wideband-trunk-group change meas-selection wideband-trunk-group clear measurements ds1 clear measurements ds1
n/a clear measurements ds1-facility clear measurements security-violations clear measurements security-violations clear measurements occupancy busiest-intervals clear measurements occupancy busiest-intervals display meas-selection coverage display meas-selection coverage
display meas-selection principal display meas-selection principal display meas-selection route-pattern display meas-selection route-pattern display meas-selection trunk-group display meas-selection trunk-group display meas-selection wideband-trunk-group display meas-selection wideband-trunk-group list performance attendant list performance attendant
How to Enter Commands and Display and Print Reports
1-10 G3csi, G3si, and G3r Reports
1
G3csi, G3si, and G3r Reports
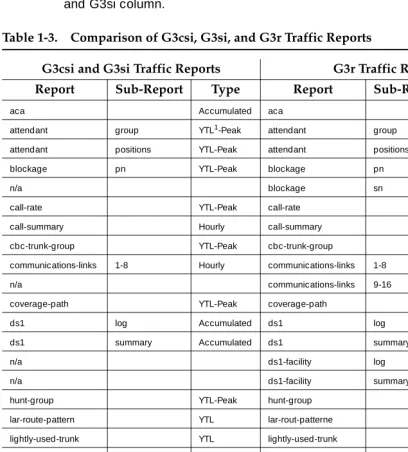
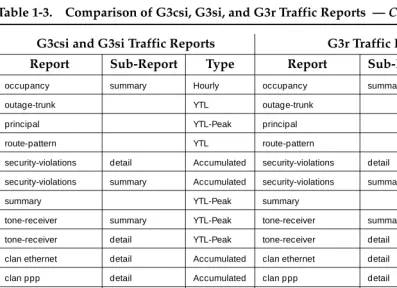
This book covers all the DEFINITY ECS G3csi, G3si, and G3r performance reports. However, some differences exist between the reports available on the different versions of the switch. Table 1-3 shows these differences. Where a report applies only to the G3r version of the switch, “n/a” appears in the G3csi and G3si column.
Table 1-3. Comparison of G3csi, G3si, and G3r Traffic Reports
G3csi and G3si Traffic Reports G3r Traffic Reports
Report Sub-Report Type Report Sub-Report Type
aca Accumulated aca Accumulated
attendant group YTL1-Peak attendant group YTL-Peak attendant positions YTL-Peak attendant positions YTL-Peak blockage pn YTL-Peak blockage pn YTL-Peak
n/a blockage sn YTL-Peak
call-rate YTL-Peak call-rate YTL-Peak call-summary Hourly call-summary Hourly cbc-trunk-group YTL-Peak cbc-trunk-group YTL-Peak communications-links 1-8 Hourly communications-links 1-8 Hourly n/a communications-links 9-16 Hourly coverage-path YTL-Peak coverage-path YTL-Peak ds1 log Accumulated ds1 log Accumulated ds1 summary Accumulated ds1 summary Accumulated
n/a ds1-facility log Accumulated
n/a ds1-facility summary Accumulated hunt-group YTL-Peak hunt-group YTL-Peak lar-route-pattern YTL lar-rout-patterne YTL lightly-used-trunk YTL lightly-used-trunk YTL load-balance total YTL-Peak load-balance total YTL-Peak load-balance intercom YTL-Peak load-balance intercom YTL-Peak load-balance incoming YTL-Peak load-balance incoming YTL-Peak load-balance outgoing YTL-Peak load-balance outgoing YTL-Peak load-balance tandem YTL-Peak load-balance tandem YTL-Peak modem-pool YTL-Peak modem-pool YTL-Peak occupancy busiest- intervals Accumulated occupancy busiest- intervals Accumulated occupancy last-hour Accumulated occupancy last-hour Accumulated
n/a occupancy pktint Hourly
How to Enter Commands and Display and Print Reports
1-11 G3csi, G3si, and G3r Reports
1
occupancy summary Hourly occupancy summary Hourly outage-trunk YTL outage-trunk YTL principal YTL-Peak principal YTL-Peak route-pattern YTL route-pattern YTL security-violations detail Accumulated security-violations detail Accumulated security-violations summary Accumulated security-violations summary Accumulated
summary YTL-Peak summary YTL-Peak
tone-receiver summary YTL-Peak tone-receiver summary YTL-Peak tone-receiver detail YTL-Peak tone-receiver detail YTL-Peak clan ethernet detail Accumulated clan ethernet detail Accumulated clan ppp detail Accumulated clan ppp detail Accumulated trunk-group hourly Hourly trunk-group hourly Hourly trunk-group summary YTL-Peak trunk-group summary YTL-Peak wideband-trunk-group hourly Hourly wideband-trunk-group hourly Hourly wideband-trunk-group summary YTL-Peak wideband-trunk-group summary YTL-Peak
1. YTL = yesterday, today, and last-hour report options available
Table 1-3. Comparison of G3csi, G3si, and G3r Traffic Reports — Continued
G3csi and G3si Traffic Reports G3r Traffic Reports
Report Sub-Report Type Report Sub-Report Type
How to Enter Commands and Display and Print Reports
1-12 G3csi, G3si, and G3r Reports
System Printer and Report-Scheduler
2-1 System Printer
2
2
System Printer and Report-Scheduler
System Printer
The system printer, rather than the slave printer attached directly to the
management terminal, is used to schedule reports to be printed. However, when desired and on demand, you may print individual reports using the management terminal printer.
The Report Scheduler feature uses the system printer as its output device. The hardware parameters for the system printer must have been previously
administered.
System Printer and Report-Scheduler
2-2 System Printer
2
Screen 2-1. Feature Related System Parameters
NOTE:
The system printer must use an Electronic Industries Association (EIA) RS-232 asynchronous serial interface. Depending upon the type/model of serial printer you use, you may have to administer certain hardware option switch settings as part of the installation procedure.
change system-parameters features Page 4 of 8 SPE A
FEATURE-RELATED SYSTEM PARAMETERS
SYSTEM PRINTER PARAMETERS
System Printer Extension: 45206 Lines Per Page: 60 EIA Device Bit Rate: 9600
SYSTEM-WIDE PARAMETERS
Switch Name: System Test 2
MALICIOUS CALL TRACE PARAMETERS
System Printer and Report-Scheduler
2-3 System Printer
2
System Printer Data Link Operation
and Maintenance
Operation and maintenance of the system printer data link is significantly different from the CDR and journal printer data links. For example, the CDR and journal printer data links are maintained in a constant link up state, while the system printer data link is only brought up once every 15 minutes provided there are reports to be printed, or when an immediate report is scheduled.
The system printer data link has three states that identify its operational condition. The states are: (1) link up, (2) link down, and (3) maintenance busy-out. Whenever the communication path (including software processes, hardware cabling, and printer) functions properly and data is exchanged successfully between them, the data link is defined as being in the link up state. The link down state refers to all times except whenever reports are printed and whenever maintenance personnel disable the link. The maintenance busy-out state is the result of executing the busyout sp-link command from the management terminal. While in the maintenance busy-out state, the switch software processes and link retry operations are disabled.
Table 2-1. System Printer Hardware Administration
Field Description
System Printer Extension:
Enter the extension number if connected to a switched port, or “eia” (see note below). There are two different types of switched port circuits. The TN754 circuit pack supports connections to 7400B-type data modules, while the TN726 circuit pack supports connections to the Asynchronous Data Unit (ADU)-type data module. Local requirements determine which data link option to select.
NOTE:
If your system is a G3si or G3csi, you may connect the printer to the EIA, unless the EIA is used for Call Detail Record (CDR) collection.
Lines Per Page: The number of lines on the computer form. The range is from 24 to 132. Generally, 60 will be the appropriate selection.
EIA Device Bit Rate
System Printer and Report-Scheduler
2-4 Report Scheduler
2
It is assumed all customers monitor the operating status of the system printer and, as necessary, refill the paper bin, relieve any paper jams, verify the printer is receiving power, and so on.
NOTE:
The Basic Call Management System (BCMS) login cannot execute the busyout sp-link command. This is normally only performed via the maintenance login. Therefore, as necessary, all non-maintenance
personnel should simply flip the printer power switch to the OFF position to refill the paper bin and remove jammed paper. Subsequently, the
system-printer can be restored on-line by turning the power switch ON.
If the system printer link generates either a warning alarm or a minor alarm, the problem should be referred to the proper maintenance personnel.
Report Scheduler
The Report Scheduler can be used with many switch features. Specifically, virtually all list, display, or test commands can be executed with the schedule qualifier. Therefore, the system administrator login, maintenance login, and other logins can schedule reports.
Whenever a command containing the schedule option is executed, it generates a Job Id. A maximum of 50 different Job Ids (50 different reports) can be
scheduled for printing. The Report Scheduler feature is used to specify the actual day(s) and time of day each report is printed. For a list of measurement
commands that can be scheduled, refer to Table 1-1.
Print Intervals
For purposes of printing reports, three print intervals are available:
■ Immediate
—
The report prints immediately.■ Scheduled
—
The report prints each week for the time and daysspecified. The date, time, and day(s) parameters for the report are set administratively. To change them, re-administration is required.
System Printer and Report-Scheduler
2-5 Report Scheduler
2
Adding a Report to the Report Scheduler
To add a report to the Report Scheduler, enter a list, test, or display command followed by the schedule option. Whenever a report is initially scheduled, the print interval of immediate is automatically assigned as the default. Therefore, if immediate is not desired, you must change the print interval to deferred or scheduled and you must add a day and print time to the Report Scheduler. Screen 2-2 depicts this screen with sample data. Table 2-2 describes the data fields for this screen.
Screen 2-2. Report Scheduler screen
—
Immediate Print IntervalTable 2-2. Report Scheduler Field Descriptions
Field Description
Job Id This is a display-only field. Whenever a command is executed with the qualifier schedule, the system responds by generating a unique Job Id number. The Job Id assigned by the system is the lowest number from 1 to 50 not already in use.
Job Status
This is a display-only field. It identifies the print status of the report. Since the job is not yet on the report scheduler, this field displays “none.”
Command This is a display-only field. It displays the ACTION, OBJECT, and QUALIFIER entered when the report was scheduled.
Continued on next page
list measurements attendant-group Page 1 REPORT SCHEDULER
Job Id: 1 Job Status: none Command: list measurements attendant-group
System Printer and Report-Scheduler
2-6 Report Scheduler
2
Screen 2-3. Report Scheduler screen
—
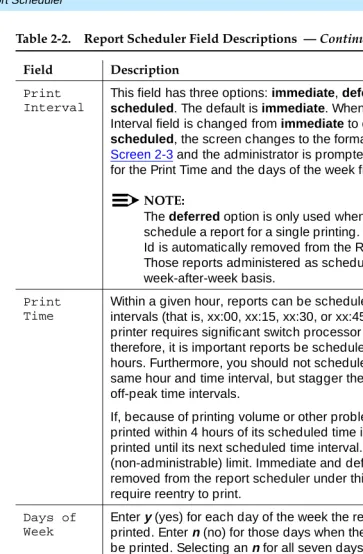
Scheduled Print Interval PrintInterval
This field has three options: immediate, deferred, and scheduled. The default is immediate. Whenever the Print Interval field is changed from immediate to deferred or scheduled, the screen changes to the format depicted in Screen 2-3 and the administrator is prompted to enter values for the Print Time and the days of the week fields.
NOTE:
The deferred option is only used when you want to schedule a report for a single printing. Thereafter, the Job Id is automatically removed from the Report Scheduler. Those reports administered as scheduled print on a week-after-week basis.
Print Time
Within a given hour, reports can be scheduled at 15-minute intervals (that is, xx:00, xx:15, xx:30, or xx:45). The system printer requires significant switch processor resources; therefore, it is important reports be scheduled for off-peak hours. Furthermore, you should not schedule all reports for the same hour and time interval, but stagger them across multiple off-peak time intervals.
If, because of printing volume or other problems, a report is not printed within 4 hours of its scheduled time interval, it is not printed until its next scheduled time interval. This is a 4-hour (non-administrable) limit. Immediate and deferred jobs are removed from the report scheduler under this scenario and require reentry to print.
Days of Week
Enter y (yes) for each day of the week the report is to be printed. Enter n (no) for those days when the report should not be printed. Selecting an n for all seven days of the week effectively disables a report from being printed.
Table 2-2. Report Scheduler Field Descriptions — Continued
Field Description
Continued on next page
list measurements attendant groups Page 1 REPORT SCHEDULER
Job Id: 1 Job Status: none Command: list report scheduler
Print Interval: scheduled Print Time: xx:xx
System Printer and Report-Scheduler
2-7 Report Scheduler
2
Other commands, such as those described in Chapter 3, ‘‘Traffic Data Analysis’’, are added to the Report Scheduler in a similar manner. Simply append the schedule qualifier to the command (for example, list aca-parameters schedule) and, when the first screen appears, change the Print Interval field from
immediate to scheduled and subsequently administer the Print Time and the days of the week fields.
Summary of Steps for Printing
Reports on the System-Printer
1. Execute a command with the schedule qualifier.
The Report Scheduler screen appears (for example, Screen 2-2 with the appropriate command). It indicates the print interval is immediate.
2. Choose one of these options:
a. Press ENTER to print the report (immediately) on the system printer. b. Type scheduled or deferred in the Print Interval field and press
ENTER.
NOTE:
If you are using a personal computer (PC) running a terminal emulation package, your keyboard may not have an ENTER key. You must map a function key to serve in this capacity. (See your terminal emulation software documentation for instructions on how to do this.)
When you change the print interval to scheduled or deferred, the Print Time and the days of the week fields are displayed (for example, Screen 2-3).
3. Type in the desired Print Time and press ENTER. The cursor is now on the days of the week field.
4. Type y for those days that you desire to print the report.
5. Press ENTER to execute the command. The command prompt appears.
Listing Scheduled Reports
System Printer and Report-Scheduler
2-8 Report Scheduler
2
Command
To display a list of all reports on the Report Scheduler:
1. Type list report-scheduler [print/schedule] and press RETURN.
Options: The print and schedule options are available for this command.
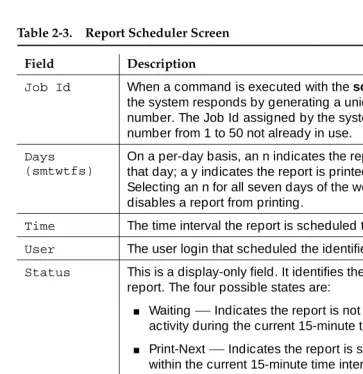
Screen 2-4 depicts the screen for the list report-scheduler command. Table 2-3 describes the data fields for this screen.
Screen 2-4. List Report Scheduler screen
NOTE:
In instances such as for Job Id 4, if an immediate report is scheduled, the Days field is completed with one y for the current day and n for all others.
list report-scheduler Page 1 of x Report Scheduler
Job Id Days (smtwtfs) Time User Status Type Command
4 nynnnnn 18:45 bcms printing immediate list measurements attendant-group
2 nynynyn 19:00 bcms waiting scheduled list measurements call-rate
7 nnnnnyn 19:15 bcms waiting deferred list bcms agent 5000
System Printer and Report-Scheduler
2-9 Report Scheduler
2
All fields are display-only. If, after reviewing this report, it is determined changes need to be made, use the change report-scheduler command to make the desired changes.
Table 2-3. Report Scheduler Screen
Field Description
Job Id When a command is executed with the schedule qualifier, the system responds by generating a unique Job Id number. The Job Id assigned by the system is the lowest number from 1 to 50 not already in use.
Days (smtwtfs)
On a per-day basis, an n indicates the report is not printed that day; a y indicates the report is printed that day. Selecting an n for all seven days of the week effectively disables a report from printing.
Time The time interval the report is scheduled to print.
User The user login that scheduled the identified report.
Status This is a display-only field. It identifies the print status of the report. The four possible states are:
■ Waiting
—
Indicates the report is not scheduled for anyactivity during the current 15-minute time interval.
■ Print-Next
—
Indicates the report is scheduled to printwithin the current 15-minute time interval.
■ Printing
—
Indicates the report is currently printing.■ Printed
—
Indicates the report has successfully printedduring the current 15-minute time interval.
Type The type of print interval scheduled for the report.
System Printer and Report-Scheduler
2-10 Report Scheduler
2
Change Command
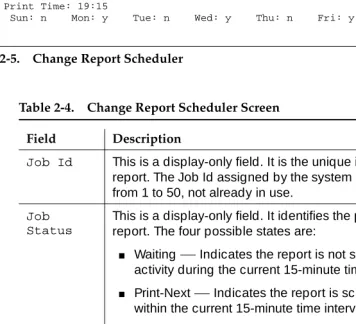
Use the change report-scheduler command to change the schedule of a report. To display this screen, use the change report-scheduler xx command, where xx corresponds to the Job Id. Screen 2-5 depicts the Change Report Scheduler screen. Table 2-4 describes the data fields for this screen.
Screen 2-5. Change Report Scheduler
Table 2-4. Change Report Scheduler Screen
Field Description
Job Id This is a display-only field. It is the unique identifier for the report. The Job Id assigned by the system is the lowest number from 1 to 50, not already in use.
Job Status
This is a display-only field. It identifies the print status of the report. The four possible states are:
■ Waiting
—
Indicates the report is not scheduled for anyactivity during the current 15-minute time interval.
■ Print-Next
—
Indicates the report is scheduled to printwithin the current 15-minute time interval.
■ Printing
—
Indicates the report is currently printing.■ Printed
—
Indicates the report has successfully printedduring the current 15-minute time interval.
NOTE:
The Print Time and the days of the week fields may be changed and effect a change of the Job Status.
Command This is a display-only field. It displays the ACTION, OBJECT, and QUALIFIER entered when the report was scheduled.
Continued on next page
change report-scheduler 23 Page 1 Report Scheduler
Job Id: 23 Job Status: printed Command: list bcms agent 4000 time start 08:00 stop 12:00 Print Interval: scheduled
Print Time: 19:15
System Printer and Report-Scheduler
2-11 Report Scheduler
2
Remove Command
The remove report-scheduler command is used to remove a report from the Report Scheduler. To display this screen, enter the remove report-scheduler xx command, where xx corresponds to the Job Id. Screen 2-6 depicts this screen. Table 2-5 describes the data fields for the screen.
Print Interval
The three possible options are immediate, scheduled, and deferred. If the print time of a report is changed so its scheduled time now falls inside the current 15-minute time interval (that is, the Job Status field changes from waiting to print-next), the report is not printed in the current interval. But, the report is printed during the next scheduled time interval. As a contrast, if a report scheduled for some time interval (other than the current 15-minute time interval) has its print interval changed from scheduled to immediate, the report is printed immediately.
Print Time
Within a given hour reports can be scheduled at 15-minute intervals (that is xx:00, xx:15, xx:30, xx:45). This field may be changed as desired. The system printer requires significant switch processor resources; therefore, it is important that the reports be scheduled for off-peak hours. Furthermore, you shout not schedule all reports for the same hour and time interval, but stagger them across multiple off-peak time intervals. If, because of printing volume or other problems, a report is not printed within 4 hours of its scheduled time interval, it is not printed until its next scheduled time interval. This is a 4-hour (non-administrable) limit.
Days of Week
On a per-day basis, an n indicates the report is not to be printed that day; a y indicates the report is to be printed that day. This field can be changed as desired. Selecting an n for all seven days of the week effectively disables a scheduled printing of a report.
Table 2-4. Change Report Scheduler Screen — Continued
Field Description
System Printer and Report-Scheduler
2-12 Report Scheduler
2
.
Screen 2-6. Remove Report Scheduler
NOTE:
All fields are display-only. Once the user verifies the identified report is the one to be removed, it is then necessary to press RETURN. Following this action, the system waits for the next command.
Table 2-5. Remove Report Scheduler Command Screen
Field Description
Job Id The unique identifier for the report. The Job Id assigned by the system is the lowest number from 1 to 50 not already in use.
Job Status This is a display-only field. It identifies the print status of the report. The four possible states are:
■ Waiting
—
Indicates the report is not scheduled for anyactivity during the current 15-minute time interval.
■ Print-Next
—
Indicates the report is scheduled to printwithin the current 15-minute time interval.
■ Printing
—
Indicates the report is currently printing.■ Printed
—
Indicates the report has successfully printedduring the current 15-minute time interval.
Command This is a display-only field. It displays the ACTION, OBJECT, and QUALIFIER entered when the report was scheduled.
Print Interval
The three possible options are immediate, scheduled, and deferred.
Print Time Within a given hour, reports can be scheduled at 15-minute intervals (for example, xx:00, xx:15, xx:30, xx:45).
Days of Week
On a per-day basis, an n indicates the report is not to be printed that day; a y indicates the report is to be printed that day. Selecting an n for all seven days of the week effectively disables a report from printing.
remove report-scheduler 23 Page 1 Report Scheduler
Job Id: 23 Job Status: printed Command: list bcms agent 7000 time start 08:00 stop 12:00 Print Interval: scheduled
Print Time: 19:15
Traffic Data Analysis
3-1 How This Chapter Is Organized
3
3
Traffic Data Analysis
How This Chapter Is Organized
This chapter describes all of the traffic measurement reports, excluding history, processor occupancy, and security reports. The reports are in alphabetical order. Each report description includes the following elements:
■ An explanation of the report
■ The full command used to call up the report (elements of the command
may be abbreviated as long as they are unique), including a description of any required fields and options
■ An illustration of a typical report screen
■ A table that defines all field labels in the report and, when appropriate, a
“Suggested Actions” list
The following reports are provided:
■ Attendant. Describes the traffic measurements and performance reports
for attendant groups and attendant positions and provides an analysis of the data provided in the reports.
■ Automatic Circuit Assurance. Describes the parameters and
measurements reports for the Automatic Circuit Assurance (ACA) feature.
■ ARS/AAR/UDP Route Pattern Measurements. Describes the
measurements selection screen and routing pattern measurements report for the Automatic Route Selection (ARS), Automatic Alternate Routing (AAR), and User Datagram Protocol (UDP) features and provides an analysis of the data provided in the measurements report.
■ Call Rate. Describes the Call Rate measurements and summary reports
available with DEFINITY systems.
Traffic Data Analysis
3-2 How This Chapter Is Organized
3
■ Call Coverage Measurements. Describes the Principal Coverage and
Coverage Path measurement reports available with DEFINITY systems.
■ DS1 Link Performance Measurements. Describes performance
measurements for DS1 links. The reports available include detailed log and summary reports.
■ DS1 Converter Link Performance Measurements. Describes
performance measurements for DS1 Converter links. The reports available include detailed log and summary reports.
■ Emergency Access Calls. Tracks emergency calls by extension, event,
type of call, and time of day. This report prints in the system journal printer with name, time and event code (attendant crisis alert).
■ Hunt Groups. Lists the hunt groups on your system. Describes the traffic
measurements, performance, and status reports for Automatic Call Distribution (ACD)/Uniform Call Distribution (UCD)/Direct Department Calling (DDC) Hunt Groups and provides the analysis of the data provided in the reports.
■ LAN Performance Measurements. Describes the performance
measurements report for traffic over ethernet or ppp LAN connections.
■ LAR Route Pattern Measurements. Describes the route pattern
measurements report for the Look Ahead Routing feature.
■ Logins. Describes the login ID information for each system user. ■ Modem Pool Groups. Describes the traffic measurements report for
modem pool groups.
■ Multimedia. Describes the traffic measurement reports used to determine
multimedia traffic resources.
■ Performance Summary. Describes the traffic measurements
Performance Summary report.
■ Port Network /Load Balance. Describes the Blockage Study report which
provides information on loading and blocking for each port network as well as between switch node pairs; and the Load Balance report which provides information on load and balance for each port network and indications of the source of the load.
■ System Status. Describes the System Status reports, which provide an
overall view of how the system is performing.
■ Tone Receiver. Describes the Tone Receiver Summary and Tone
Receiver Detailed Measurements reports which display traffic data for tone receivers.
Traffic Data Analysis
3-3 General Information about Reports
3
■ Trunk Groups. Describes the traffic, outage, lightly used and
measurements/selection reports, call-by-call (CBC), performance and status reports for Trunk Groups; it also provides the validation and analysis of the data provided in the reports.
■ Wideband Trunk Groups. Describes the Wideband Trunk Group
Summary and Hourly reports and the Wideband Trunk Group Selection screen.
General Information about Reports
Report Screen Fields
Switch Name
The Switch Name field appears at the top left of all the traffic data analysis screens, just below the command. The field value is a 20-character string administered by the customer that uniquely defines the switch being measured.
Time and Date
The time and date the report is requested displays at the top right.
When a question mark appears in the time fields, three possible explanations exist.
1. The attendant presses start immediately followed by pressing cancel.
2. Pressing start and letting calls time-out after ten seconds.
3. No staffing, but making calls.
Measurement Hour
The Measurement Hour field displays the starting time (using a 24-hour clock) of the hour during which the data was recorded.
Changing the Time
Traffic Data Analysis
3-4 Attendant Group Reports
3
Attendant Group Reports
The Attendant Group reports are used to assess the quality of service provided to customers calling through the Listed Directory Numbers, and to facilitate the management of the attendant group so it is neither under- nor over-staffed.
The Attendant Group Measurements consist of two reports: The Attendant Group report provides hourly traffic measurements for the Attendant Group as a whole. The Attendant Positions report gives peak individual Attendant Position
Measurements.
Both reports are available as PEAK reports for yesterday’s peak hour, today’s peak hour, and the last hour. A peak hour is the hour within a 24-hour period with the greatest usage (Time Talk plus Time Held) for the specified day.
Hourly data for the entire attendant group can be obtained by polling the Attendant Group report on an hourly basis.
Attendant Group Report
Command
To display the Attendant Group report:
1. Type list measurements attendant group [print/schedule] and press RETURN.
Options: The print and schedule options are available for this command.
Screen
Screen 3-1 shows a typical screen for the Attendant Group report. Table 3-1 describes the data fields presented in the Attendant Group report.
Screen 3-1. Attendant Group report
list measurements attendant group SPE A Switch Name: Cust_Switch_Name Date: 4:47 pm WED NOV 27, 19xx
ATTENDANT GROUP MEASUREMENTS
Grp Meas --- Calls --- --- Time ---- Time Speed Siz Hour Ans Abnd Qued H-Abd Held Avail Talk Held Abnd Ans(sec)
Traffic Data Analysis
3-5 Attendant Group Report
3
Table 3-1. Attendant Group Report
Field Description
Grp Siz Group Size. The number of attendant positions (consoles) administered for the groups.
Meas Hour Measurement Hour. The hours represented are indicated by the labels in the right-hand column (YEAS PEAK — the hours of yesterday’s peak activity, TODAY PEAK — today’s peak activity, and LAST HOUR — the last hour activity).
NOTE:
A pair of asterisks in the minute portion of the measurement hour indicates the switch time was changed during the measurements interval. All measurement data for this interval is set to zero.
Calls Ans Calls Answered. The number of calls answered by all active attendants during the measurement hour. With Total Usage and Calls Answered, you can determine the Average Work Time (AWT), which is the time it takes an attendant to handle a call (refer to ‘‘Data Analysis Guidelines’’ on page 3-15).
Calls placed to individual attendant extensions or that route to an attendant via a hunt group do not increment the Calls Ans counter.
Calls Aband
Calls Abandoned. The number of calls that ring an attendant group and drop (the caller hangs up) before an attendant answers. Where applicable, this total includes calls abandoned from the attendant queue before answered. A call abandoned after placed on hold is not included in this measurement, because it is already added to the calls answered measurement.
Suggested Action: Observe times during which the calls abandoned number may be higher than desirable, and then schedule additional attendants in the group as needed during the indicated times. Also, see “Percent Occupancy,” located under ‘‘Data Analysis Guidelines’’ on page 3-15.
Traffic Data Analysis
3-6 Attendant Group Report
3
Calls Qued
Calls Queued. The total number of calls placed in the attendant queue (delayed) because no attendants are available. Calls remain in the queue:
■ Until an attendant becomes available and the call is
connected.
■ Until the caller, while waiting in the queue, abandons the
call (hangs up) before an attendant is available. See “Suggested Action” in the description of the Calls Aband
field.
■ The call covers to another point in a coverage path. Calls
H-Abd
Calls Held-Abandoned. The number of calls that abandon while the caller is in hold mode. Held calls which time out and re-alert are included in the held-abandoned call count.
Suggested Action: If this number is determined to be excessive, you should investigate and attempt to identify the reasons.
Calls Held
Calls Held. The number of calls answered by the attendant group and subsequently placed on hold by the attendant group.
Time Avail
Time Available. The time during which the “pos avail” lamp is lit on all attendant consoles, and the attendants are not talking on calls but are available to handle new calls. Measured in Centum (Hundred) Call Seconds or CCS.
NOTE:
An attendant can have calls on hold and still be available.
For example, if two attendants are available for 15 minutes each during the measurement hour, the total available time would be 30 minutes or 18 CCS (0.5 hour X 36 CCS per hour).
Table 3-1. Attendant Group Report — Continued
Field Description
Traffic Data Analysis
3-7 Attendant Group Report
3
Time Avail (cont.)
Consoles may be administered either with their own unique extension number or without any extension number. For the “with extension number” case, traffic measurements for outgoing calls and incoming calls to the extension are allotted to the console’s extension number and not to the attendant group. For the “without” case, all traffic measurements are allotted to the attendant group. The time the console is on outgoing calls is not included in the attendant group’s Time Avail measurement.
Attendants are not available and do not accumulate time available when:
■ The position is in Night Service
■ The position was busied-out
■ The headset is unplugged
■ The attendant is servicing a call Suggested Actions:
1. If the Time Avail plus Time Talk fields total to a number less than 36 CCS X the number of attendants, then some of the attendant positions are not staffed for the measurement hour. If this is a problem, then it is appropriate to staff additional positions during the busy hour(s).
2. If the Time Avail plus Time Talk fields equal 36 CCS X the number of attendants, then any time available is idle time or time not spent on calls. A large number for the Time Avail field indicates a low occupancy. If this is a problem, then it is appropriate to reduce the number of attendant positions that are staffed. Staffed time is usually very close to the sum of the Time Avail and Time Talk fields.
Table 3-1. Attendant Group Report — Continued
Field Description
Traffic Data Analysis
3-8 Attendant Group Report
3
Time Talk Also referred to as Talk Time. The total time, during the measurement interval, attendant(s) are active or talking on a loop (measured in CCS).
Talk time is not started until the call is answered by the attendant. The duration of time between the call terminating at the attendant console and when the call is answered is not accumulated as either Avail Time or Talk Time.
Calls split by the attendant do not accumulate talk time from the point when the attendant presses the start button until the call is placed.
Calls routed to an attendant via a hunt group are treated as calls to the attendant extension and therefore do not accumulate talk time.
NOTE:
An attendant can have up to six calls on hold at any one time. However, each attendant can only be active on one loop at a time.
Suggested Action: If talk time is acceptable, but one or more of the other measurements are unacceptable, then all
parameters should be studied in order to identify what should be changed (the number of consoles, number of attendant positions staffed, attendants schedule, faulty trunks, and so on).
Table 3-1. Attendant Group Report — Continued
Field Description
Traffic Data Analysis
3-9 Attendant Group Report
3
Time Held Also referred to as Held Time. The total amount of time (measured in seconds) the attendants have calls on hold.
Time Abnd Also referred to as Time to Abandoned. The average amount of time calls spend in queue and/or ringing at the console before the callers hang up (measured in seconds).
NOTE:
Time to abandoned does not include calls that overflow the attendant group queue.
Suggested Action: If the Time to Abandoned number is smaller than the Speed of Answer number then you need more agents. As a contrast, if the Time to Abandoned number is larger than the Speed of Answer number, then the attendant group should process the calls faster. The attendant group should be engineered so “Time to Abandoned”
approximately equals “Avg Delay”.
NOTE:
If the average time to abandon is equal to or exceeds 9999 seconds, the value 9999 displays in the field.
Table 3-1. Attendant Group Report — Continued
Field Description
Continued on next page Time To Abandoned =
Total Number o f Calls Abandoned Total Delay For All Abandoned Calls (in seconds) _ ___________________________________________
Total Delay =
(Time To Abandoned) × (# o f Abandoned Calls) +
(Speedo f Answer)×(# o f CallsAnswered)
Avg Delay =
Calls Answered + Calls Aband Total Delay
Traffic Data Analysis
3-10 Attendant Group Report
3
Speed Ans (Sec)
Speed of Answer. The average elapsed time from when a call terminat