High Performance Computing Of Explicit Schemes For Electrofusion Joining P
rocess
Based On Message-Passing Paradigm
HIGH PERFORMANCE COMPUTING OF EXPLICIT SCHEMES FOR ELECTROFUSION JOINTING PROCESS BASED ON MESSAGE-PASSING
PARADIGM
(PENGKOMPUTERAN BERKEMAMPUAN TINGGI BAGI SKEMA-SKEMA TAK TERSIRAT UNTUK PROSES PEMATRIAN ELEKTROFUSION
BERDASARKAN PARADIGMA PERPINDAHAN DATA)
Halijah Binti Osman Norma Binti Alias Bahrom Bin Sanugi
HALIJAH BINTI OSMAN NORMA BINTI ALIAS BAHROM BIN SANUGI
RESEARCH VOTE NO: 75153
Universiti T
eknologi Ma
laysia
Jabatan Matematik
Jabatan Matematik
Fakulti Sa
in
s
Fakulti Sains
Universiti Teknologi Malaysia
2007
UNIVERSITI TEKNOLOGI MALAYSIA
BORANG PENGESAHAN LAPORAN AKHIR PENYELIDIKAN
TAJUK PROJEK : High performance computing of explicit schemes for electrofusion joining process based on message-passing paradigm
vot: 75153, Ketua projek: Halijah Osman
Saya HALIJAH OSMAN
(HURUF BESAR)
Mengaku membenarkan Laporan Akhir Penyelidikan ini disimpan di Perpustakaan Universiti Teknologi Malaysia dengan syarat-syarat kegunaan seperti berikut :
1. Laporan Akhir Penyelidikan ini adalah hakmilik Universiti Teknologi Malaysia.
2. Perpustakaan Universiti Teknologi Malaysia dibenarkan membuat salinan untuk
tujuan rujukan sahaja.
3. Perpustakaan dibenarkan membuat penjualan salinan Laporan Akhir Penyelidikan ini bagi kategori TIDAK TERHAD.
4. * Sila tandakan ( / )
SULIT (Mengandungi maklumat yang berdarjah keselamatan atau
Kepentingan Malaysia seperti yang termaktub di dalam
AKTA RAHSIA RASMI 1972).
TERHAD (Mengandungi maklumat TERHAD yang telah ditentukan oleh
Organisasi/badan di mana penyelidikan dijalankan).
TIDAK
TERHAD
TANDATANGAN KETUA PENYELIDIK
Nama & Cop Ketua Penyelidik
CATATAN : * Jika Laporan Akhir Penyelidikan ini SULIT atau TERHAD, sila lampirkan surat daripada pihak
PENGHARGAAN
ABSTRACT
The research focused on heterogeneous cluster workstations comprising of a number of CPUs in single and shared architecture platform. The problem statements under consideration involved one dimensional parabolic equations. The thermal process of electrofusion jointing was also discussed. Numerical schemes of explicit type such as AGE, Brian, and Charlie’s Methods were employed. The parallelization of these methods were based on the domain decomposition technique. Some parallel performance measurement for these methods were also addressed. Temperature profile of the one dimensional radial model of the electrofusion process were also given.
ABSTRAK
Penyelidikan ini memberi focus kepada sistem gugusan stesen-kerja heterogenus yang mengandungi sebilangan CPU dalam platfom ingatan teragih dan berkongsi. Penyataan masalah yang dipertimbangkan melibatkan persamaan parabolik satu dimensi. Proses therma bagi pematrian elektrofusion juga dibincangkan. Kaedah berangka jenis tak tersirat seperti AGE, Brian, dan Kaedah Charlie telah diaplikasikan. Penselarian algoritma untuk kaedah-kaedah tersebut dibuat berasaskan kaedah teknik penghuraian domain. Ukuran pencapaian selari dijalankan terhadap kaedah-kaedah ini. Taburan suhu model satu dimensi bagi proses elektrofusion juga diberikan.
CONTENTS
PAGE
Title i
Acknowledgement ii
Abstract iii
Abstrak iv
Contents v
List of Tables vii
List of Figures viii
List of Acronyms ix
Chapter 1 Introduction 1
1.1 Development of Parallel Architecture 1
1.1.1High Performance Computing 1
1.1.2Details on Development 2
1.1.3Heterogeneous Cluster Workstation 4
1.1.4Benchmarks 4
1.1.4.1 PVMPOV 5
1.1.4.2 Installing PVMPOV 5
1.1.4.3 Running PVMPOV and Benchmarking 7
1.1.5PVM 7
1.1.5.1 POV-Ray 8
1.2 Fusion Jointing 9
1.2.1Electrofusion Technique 9
1.2.2Electrofusion Fittings 10
1.2.3Jointing Process 11
Chapter 2 Literature Review 16
2.1 Parallel and Distributed Computing 16
2.2 Numerical Simulation of EFW 16
Chapter 3 Methodology 21
3.1 Parallel algorithms 21
3.1.1 AGE Method 21
3.1.2 Brian Methods 23
3.1.3 Charlie’s Method 25
3.1.4 Gauss-Seidel Method 27
3.2 Model Problems 28
3.3 Implementation on Message Passing Systems 29
3.4 Parallel Procedure 32
3.5 Parallel Execution Time and Communication Time 33
3.5.1 Threads Model 35
3.5.2 Complexity Measures 35
3.5.3 Timed Execution 36
3.6 Numerical Model 37
3.6.1 Fitting Model 37
3.6.2 Pipe Model 39
3.6.3 Fixed Gap Model 40
Chapter 4 Computational Results 41
4.1AGE AND BRIAN 41
4.2 Performance of Charlie’s Method 44
4.3 Fitting Result 46
4.4 Pipe Result 47
Chapter 5 Concluding Remarks and Suggestions 49
LIST OF TABLES
Table No. Title Page
1 List of host name, domain name, and IP address of the workstation
3
2 The time execution versus number of processors in running the standard programming PVMPOV
8
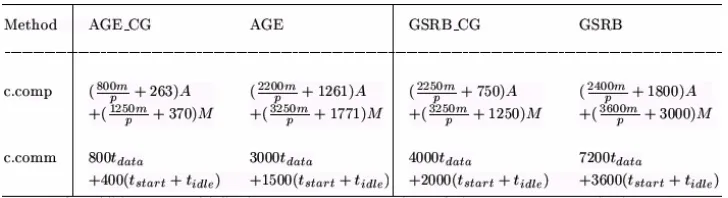
3 Computational complexity and communication cost for the parallel algorithms
32
4 Performance measurements of the sequential AGE_CG, AGE, GSRB_CG and GSRB
41
5 The gain of communication time, computational complexity
and tcomp/tcomm ratio versus number of processors
LIST OF FIGURES
Figure no. Title Page
1 Local area Network of a high performance computing based on heterogeneous cluster workstation
3
2 The output visualization of skyvase using PVMPOV 8
3 A high performance computing system 9
4 Electrofusion fittings (a) barel-form (b) patch-form 10 5 Monofilar winding in a barrel-form coupler 11
6 Schematic diagram of a coupler 11
7 Stages in the formation of an electrofusion joint 13 8 Subdomain is decomposited to processors p in block
ordering
24
9 Message passing operations between processors 31 10 Synchronization of n processes. WAIT blocks until all n
processes have reached barrier.
34
11 Cross section of pipe-fitting 37
12 Wire temperature 38
13 Heat Transfer Process 40
14 The parallel performances vs. number of processors 43
15-17 Efficiency vs. number of processors 44
18 Effectiveness vs. number of processors 45
19 Temporal performance vs. number of procesors 45
20 Sequential performance measurement 46
21 Temperature profile in fitting 47
LIST OF ACRONYMS
Acronym
EFW Electrofusion Welding
SIMD Single Instruction and Multiple Data
LAN Local Area Network
POV-Ray Persistence of Vision Raytracer PE Polyethylene
MRS Minimum Required Strength
MDPE Medium Density Polyethylene
ADI Alternating Direction Implicit
AGE Alternating Group Explicit
GSRB Gauss Seidel Red Black
Introduction
This chapter describes first the development of the parallel architecture followed by description on Electrofusion Welding (EFW)/Jointing.
1.1Development of Parallel Architecture
The tool to run the prototype is based on heterogeneous distributed parallel computer systems. The research focuses on the Parallel Virtual Machine as the message-passing paradigm for the internal communication among processors. The definition of distributed memory is referred to the multiple processors operate independently but each has own private memory, data is shared across a communications networked using message passing paradigm. Memory is scalable to number of processors by increasing the number of processors, size of memory and bandwidth. Under the Flynn’s taxonomy the distributed is classified as Single Instruction and Multiple Data Stream (SIMD) architecture. Where each instruction may operate on more than one data element, the intermediate host executed program logic and broadcasts the instruction to other processors.
1.1.1 High Performance Computing
High performance computing involves the use of distributed parallel computer systems based on a cluster of workstations. There are several advantages as given below.
1. Cheaper construction cost compared to shared memory multiprocessor architecture. 2. Large memory sizes are available to be used due to the combination of all physical
memory from the processors.
4. The large computational problems can be solved more cost effectively by using the aggregate power and memory of many computers.
The distributed parallel computer systems are available to solve any large-scale problems for graphic, sorting, visualization and scientific computing for education and researcher in science and engineering fields
1.1.2 Details on Development
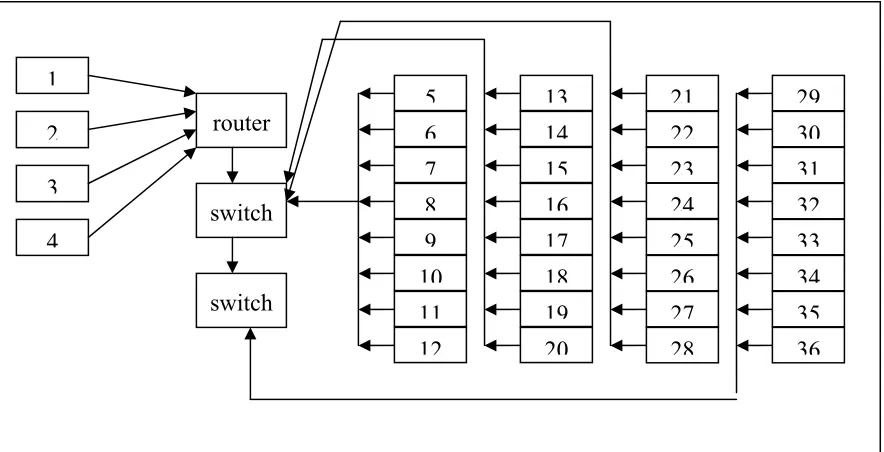
The development and performance of a high performance computing are based on 38 PCs Intel Pentium IV and Intel Pentium III with 20GB hard drive. The development involves in the configuration of a cluster of workstations, developing Local Area Network (LAN) and installing the message-passing architectures using Parallel Virtual Machine environment (PVM) (Geist, et. al, 1994). A high performance computing is developed by using the heterogeneous 36 PCs. The structure of the parallel computer systems is shown in Figure 1 and the specifications are as follows:
1. 4 Processors Intel Pentium IV with 1.66 GHz speed.
i. Two partitions hardisk Maxtor Diamond Max Plus 20GB ii. Two memory SDRAM 256 RAM
2. 32 Processors Intel Pentium III with 1 Ghz speed.
i. One partitions hardisk Maxtor Diamond Max Plus 20GB ii. One memory SDRAM 128 RAM
3. Four Fujitsu monitors 15" (CRT Color Monitor) 4. 3Com Etherlink 10/100 PCI
5. Compaq Deskpro SBC. 6. Power supply SVX Pro 16
The network of the parallel computer systems is based on LAN. Our work has been carried out by workstations interconnected via Ethernet running TCP/IP with Internal network Intel 10/100 NIC. Table 1 show the IP address and host name of the workstation. LAN consists of the following:
2. Cable UTP (unshielded Twisted Pair) Cat 5e. 3. D-Link DES-1024D 24-Port 10/100Mbps Switch 4. D-Link DI-804HV 4-Port Broadband VPN Router 5. 47Ux600mmx800mm E.Pack C/N
1
2
3
4
router 5
8 7 6 20 19 18 17 16 15 14 13 12 11 10 9 switch 29 28 27 26 25 24 23 22 21 30 31 32 33 36 34 35 switch
Figure 1: Local area Network of a high performance computing based on heterogeneous
cluster workstation
Table 1: List of host name, domain name, and IP address of the workstation.
Host name Domain name IP address
norma1 norma1.cc.utm.my 10.1.1.1
norma2 norma2.cc.utm.my 10.1.1.2
norma3 norma3.cc.utm.my 10.1.1.3
norma4 norma4.cc.utm.my 10.1.1.4
norma5 norma5.cc.utm.my 10.1.1.5
. . . . . . . . .
norma36 norma36.cc.utm.my 10.1.1.36
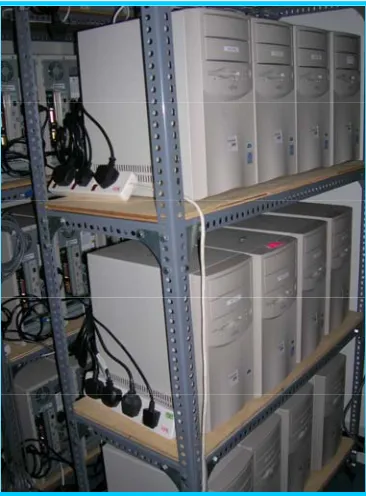
workstations as a whole. PVM can be implemented on different computer architecture, thus making it possible the integration of a heterogeneous cluster on workstations in a single virtual parallel computer. PVM has not been developed just for bringing together the workstations, but as a general programming tool on different message-passing architectures. Figure 3 shows the picture of a cluster on workstations in UTM.
1.1.3 Heterogeneous Cluster Workstation
A heterogeneous network (HN) can be abstracted as a connected graph HN (M, C), where M= {M1, M2,...,Mp} is set of heterogeneous workstations (p is the number of
workstations). The computation capacity of each workstation is determined by the power of its CPU, I/O and memory access speed. C is standard interconnection network for workstations, such as Fast Ethernet or an ATM network, where the communication links between any pair of the workstations have the same bandwidth.
Based on the above definition, if a network consists of a set of identical workstations, the system is homogeneous. Further, a heterogeneous network can be divided into two classes: a dedicated system where each workstation is dedicated to execute tasks of a parallel computation, and a non-dedicated system where each workstation executes its normal routines (also called owner workload), and only the idle CPU cycles are used to execute parallel tasks. In this paper we use a dedicated heterogeneous network of workstations.
1.1.4 Benchmarks
1.1.4.1 PVMPOV
PVMPOV is short for the PVM and POV-Ray. PVM is a message passing system that
enables a network of computers to be used as a single distributed memory parallel computer. This network is referred to as the Parallel Virtual Machine. POV-Ray is a
3-dimensional ray tracing engine. It takes information we supply and simulates the way light interacts with the objects we have defined to create stunning 3d pictures and animation which is called rendering process.
PVMPOV has the ability to distribute a rendering across multiple heterogeneous
systems. Parallel execution is only active if the user gives the “+N” option to PVMPOV. Otherwise, PVMPOV behaves the same as regular POV-Ray and runs a single task only on the local machine. Using the PVM model, there is one master and many slave tasks. The master has the responsibility of dividing the image up into small blocks, which are assigned to the slaves. When the slaves have finished rendering the blocks, they are sent back to the master, which combines them to form the final image. The master does not render anything by itself, although there is usually a slave running on the same machine as the master, since the master doesn't use very much CPU power. If one or more slaves fail, it is usually possible for PVMPOV to complete the rendering. PVMPOV starts the slaves at a reduced priority by default, to avoid annoying the users on the other machines. The slave tasks will also automatically time out if the master fails, to avoid having lots of lingering slave tasks if we kill the master.
1.1.4.2 Installing PVMPOV
The instructions for the 3.1x version of POVray follow:
1. Download the UNIX sources for Povray from http://www.povray.org . For this paper, we used version 3.1g of POV-ray. These consist of two files povuni_s.tgz and
povuni_d.tgz.
2. Download the PVMPOV patch file and store in home directory.
3. Create new directory for povray in home directory using the mkdir command. In our
4. Copy the povray files into the pvmpo3_1g_2 directory and untar them. This will
create a directory called /povray31.
5. From home directory untar the PVMPOV patch file. Change into the /pvmpov3_1g_2
directory.
6. Apply the patch by executing the ./inst-pvm script.
7. Change into the /pvmpov3_1g_2/povray31/source/zlib directory to compile the
compression library. First run ./configure script followed by command make test.
Now su to become the root user temporarily and type make install to install the
library. Type exit to become the normal user again.
8. Change into the /pvmpov3_1g_2/povray31/source/libpng directory to compile the png
library. Create the makefile by issuing the command: cp scripts/makefile.std makefile.
Then type make test. When complete, issue the su command again and type make
install. Type exit to become the normal user again.
9. Change into the /pvmpov3_1g_2/povray31/source/pvm directory and modify the
pvm.h file by changing the line "#if defined(SUN4SOL2) || defined(your_pvm_arch)"
with "#if defined(SUN4SOL2) || defined(LINUX)". On our cluster, we have to
comment out the “extern int setpriority..”. and “extern int getpriority..”. lines from
~/povray3/source/pvm/pvm.h file. We figured this out by after several failed compiles.
10.The PVM_ARCH variable must be defined by adding "export PVM_ARCH=LINUX"
in .bash_profile file.
11.Temporarily add the pvm library directory to your search path by entering "export
PATH=$PATH:$PVM_ROOT/lib" also in .bash_profile file.
12.Now start the compile by entering "aimk newunix" from the
/pvmpov3_1g-2/povray31/source/pvm directory. When complete the PVMPOV executable will be
in the /povray31/sources/pvm/LINUX directory. Copy this to main home directory.
Run "aimk newsvga" and "aimk newxwin" to generate the SVGA and X-windows
versions respectively. Now repeat this on the remaining machines.
1.1.4.3 Running PVMPOV and Benchmarking
1. Start pvm from one of your machines.
2. Add each of the other machines as before when we tested pvm. Type conf to confirm
that they are all running.
3. Now type quit at the pvm prompt to drop back to the command-line. Note that the
pvm daemon is still running.
4. With the cluster configured type the following to begin the raytracing:
./pvmpov +iskyvase.pov +h480 +w640 +FT +v1 -x -d +a0.300 -q9 -mv2.0 -b1000 -nw32
-nh32 -nt4 -L/root/pvmpov3_1g_2/povray31/include
This is the benchmark option command-line with the exception of the -nw and -nh switches, which are specific to pvmpov and define the size of image each of the slaves will be working on. The -nt4 switch is specific to the machine configuration. It starts four tasks, one for each CPU.
The messages on the screen should show that slaves were successfully started. The cluster is now rendering the image. When complete, PVMPOV will display the slave statistics as well as the total render time.
1.1.5 PVM
PVM is communication or message passing software which allows a heterogeneous collection of workstations or supercomputer to function as a single high-performance parallel machine. PVM is come prepackaged with most LINUX or Win32 install package on web page. There are three ways to start PVM:
1. PVM console-start, PVM or just attaches to running PVM.
1.1.5.1.1 POV-Ray
POV-Ray is short for the Persistence of Vision Raytracer, a tool for producing high-quality computer graphics. POV-Ray is copyrighted freeware. POV-Ray for Unix is essentially a version of the POV-Ray rendering engine prepared for running on a Unix or Unix-like operating system such as GNU/Linux. Ray-tracing is a rendering technique that calculates an image of a scene by simulating the way rays of light travel in the real world. Ray-tracing programs like POV-Ray start with their simulated camera and trace rays backwards out into the scene. The user specifies the location of the camera, light sources, and objects as well as the surface texture properties of objects, their interiors if transparent and any atmospheric media such as fog, haze, or fire.
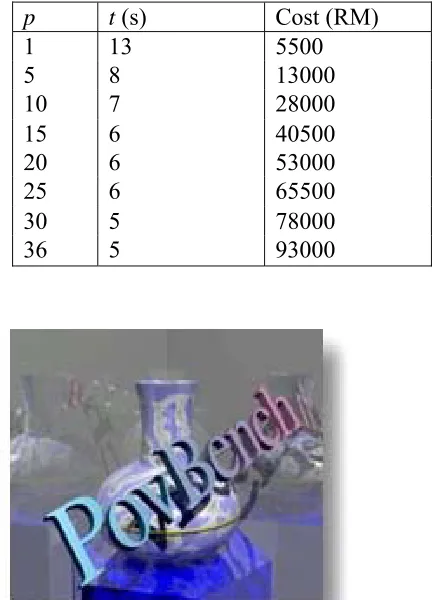
Table 2:The time execution versus number of processors
in running the standard programming PVMPOV
p t (s) Cost(RM)
1 13 5500
5 8 13000
10 7 28000
15 6 40500
20 6 53000
25 6 65500
30 5 78000
36 5 93000
Figure 3: A high performance computing system
1.2. Fusion Jointing
There are two basic systems of jointing polyethylene (PE) pipe underground and they are fusion methods and mechanical jointing. PE in various forms has been utilized by the gas and water industries in Europe as a pipeline material since 1956, due primarily to its high ductility, durability and weldability. One of the major attractions of polyethylene as a piping material is that it can be fusion welded. Fusion welds are made by bringing two molten surfaces together so that as they cool and recrystallize a welded joint forms at their interface. There are four types of fusion methods: Butt fusion, Socket fusion, Saddle fusion, and Electrofusion. The one that we are interested in is the Electrofusion technique.
1.2.1 Electrofusion Technique
run through the coil in order to heat it, using the Joule effect. This causes the material to melt slowly. The joint is complete once the area has cooled.
The heating element, which may or may not be coated, is made from metallic material ranging from pure copper and brass to manganese-nickel alloy. Normally the coating is the same material as used to manufacture the fitting. Bowman (1997) noted that EF fittings operating at an alternating voltage below or equal to 80V are usually used for buried gas and water pipes system while those operating at 220V are used in above-ground applications. These ratings are for larger dimension fittings. For fittings up to 180 mm nominal diameter the alternating voltage is 40V rms.
1.2.2 Electrofusion Fittings
EF fittings are commonly manufactured from polymeric materials, usually PE80 and PE100 compounds based on polyethylenes with a density no less than 930 kg/m$^3$. The minimum required strength (MRS) that could sustain pipe hoop stresses are 8\, MPa and 10\, Mpa respectively. The MRS value is important in designing pipe systems as it ensures that a typical design life of 50 years is achieved (Bowman, 1997; Rosala, 1995). Rosala (1995) gives the relationship of MRS value and maximum allowable hoop stress
as σ = MRS/C where C is the overall service coefficient.
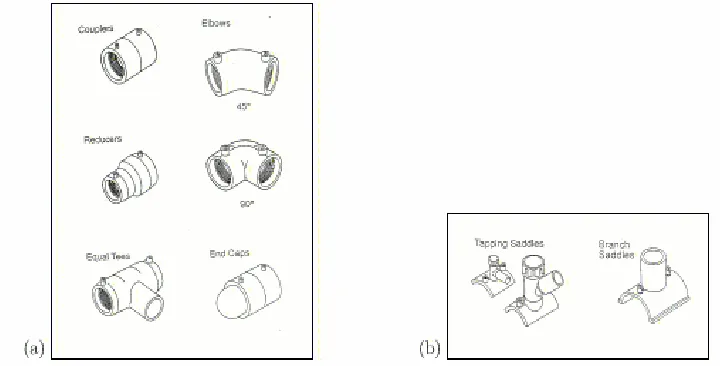
There are two types of EFW fittings: the patch-form, or saddle fitting, and the barrel-form. Various examples of these fittings are shown in Figure 4.
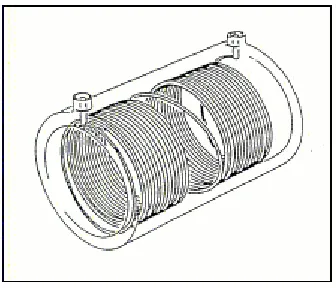
Although there are several different wire-embedding technologies, about 99.99% of EFW pipe fittings use an implanted or moulded-in resistance heating wire (Bowman, 1997). The subject of the present study is the barrel-form fitting in which the shape is axially symmetric and the heating coil is usually wound in a monofilar manner as shown in Figure 5. Specifically we are interested in a coupler that is thermoplastic and of polyethylene type. Usually the coupler has a constant bore along its length, larger than that of the pipe. This is referred to as a clearance design in Figure 6.
Figure 5: Monofilar winding in a barrel-form coupler (Rosala, 1995)
Figure 6: Schematic diagram of a coupler (Bowman, 1997)
1.2.3 Jointing Process
Fusion jointing of PE pipe systems using EF fittings is rapidly gaining preference over the older butt and socket fusion techniques. The reasons include
2. narrow trench technology can be used,
3. joints are correctly positioned and assembled prior to fusion, and
4. reported joint failure are very low, at rate of 3 per 10000 joints (Bowman, et. al, 1992).
To significantly assist in the creation of a strong EF joint, various pipe preparation steps should be followed before the joining process starts (Bowman, 1991).
1. The outer wall of the pipe must be scraped (or cleaned) to obtain a good weld quality. This was confirmed from studies by Misaka et. al (1993) in which they suggested using acetone or an electric scraper to remove contaminants such as dirt and oxidised plastic. However Morris and Gill (1991) cautioned that brittle joint failures were more common for 180mm pipe in standard test pieces in which the clearance between the pipe and coupler exceeded 1.3mm. Furthermore, a large clearance affects the expansion during the heating phase leading to insufficient interface pressure needed for a good joint (Donoghue et.al, 1991).
2. The two pipe ends must be pushed against the pipe stops to ensure that molten plastic does not enter the pipe interiors.
3. The pipes and fitting should be securely clamped to eliminate relative material movements and to ensure that the melted polymer is contained at the fusion interface. This results in low stress factors in the welding plane, even with two resins of different origins (Usclat, 1985), hence facilitating a strong joint.
The EF jointing process can then be commenced and it is well described by Bowman (1991) in three main phases.
1. Initial heating: After completing the pipe preparation procedures an alternating
This phase consumes between 20% and 40% of the total fusion time (Bowman, 1991).
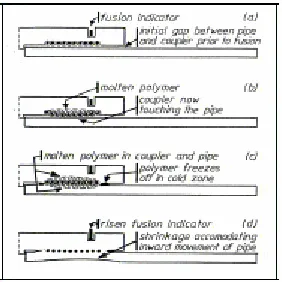
Figure 7: Stages in the formation of an electrofusion joint (Bowman, 1991)
2. Heat soak and fusion jointing: Thermal contact causes the heat energy from the
wire to be distributed to create a melt pool at the fusion interface. A carefully controlled and correctly identified energy input and the low thermal conductivity of PE help the coupler and pipe to contain the melt. On further heating, the contained melt pool increases to build up melt pressure. Cold zones located at either side of the fusion zones are crucial to the build up of molten polymer and melt pressure. They act as a barrier to block off any molten polymer that is trying to escape (Figure 7c). Eventually the fusion joint between the pipe and coupler is formed as a result of the combined action of the heat and pressure. The pressure developed at the fusion interface is recognized as a major contributing factor for generating a good bond along the EF joint (Fujikake et. al, 1997; Kanninen et.al, 1992; Donoghue et. al, 1991).
3. Cooling: This process begins when the current is turned off. The cold zones solidify
1.2.4 Simulation Model
Fusion simulation is one of the key techniques used in designing and producing electrofusion joints. This is because performing comprehensive experimental studies in some instances can be an expensive exercise. An alternative is to use a computer simulation of the electrofusion process to suggest suitable designs that may then be tried experimentally. Such a computer simulation need not necessarily include all the complexities of the electrofusion process providing it can be used to point the designer in the correct direction. For that, mathematics is used to model the thermal fusion process which is then solved analytically or numerically. Normally, problems of this type are highly nonlinear and no analytical solution is found so far. As such numerical technique is unavoidable.
In this report we shall assume circular symmetry which will facilitate the development of a one-dimensional radial model for the electrofusion process. Consider a one-dimensional section through a hollow thick-walled cylindrical body exhibiting axial symmetry. Admitting temperature dependent thermal properties λ (thermal conductivity), ρ (density) and c (specific heat) leads to the nonlinear radial heat diffusion equation
in which is the temperature at a fixed point x and time t for the fitting (f )
and pipe (p) respectively. The nonlinearity of this equation is made explicit by expanding
the derivatives on the right-hand side to obtain
To simplify matter, this report concerns with the linear case only. Thus the problem reduces to the following model equations
Heat transfer at the outer surface of the fitting and the inner surface of the pipe is by convection. An explicit finite difference solution based on control volume method is used to solve the equations.
Chapter 2
Literature Review
2.1 Parallel and Distributed Computing
The field of parallel and distributed computing, like many emerging disciplines, has both promoters and detractors. It seems nowadays accepted that parallel computing is the most promising venue for High Performance Computing. Many forms of parallelism exist today, from architectures designed around the idea of bringing together a relatively small number of very tightly-coupled processors, to where the coupling is relatively loose. However, the number of processors can scale up to thousands, getting us into massive parallelism. In general, the practical implementation of any of this parallel computer leads to relatively expensive machines that, presently, seldom exist at the Departmental level.
Recently, two technological breakthroughs have permitted the proposal of another approach to what a parallel computer could be. The availability of very fast processors in modern workstations, besides the widespread utilization of networks, has lead to the suggestion of designing a "virtual parallel computer" bringing together a number of these fast workstation by means of a Local Area Network (LAN), this is what we mean by Distributed Parallel Computer Systems. Heterogeneous in general means something consisting of dissimilar elements or parts.
2.2 Numerical Simulation of EFW
This section presents a review of published works on the numerical simulation of EFW process models.
Significant research work in EFW was only begun in the 1980s. Active participating countries include the United Kingdom, France, Japan and the United States. Attempts to numerically model the process probably started in the mid 1980s when Pitman (1985), from the BP Chemical Ltd., presented his work at the Plastics Pipes VI conference (University of York, UK). This appears to be the first published numerical simulation work concerning the EFW process model. Temperature constitutes an essential welding parameter and much of the published work simply dealt with this heat transfer process.
Pitman (1985) constructed a one-dimensional cartesian heat transfer model of a coupler by looking at the system from an axial point of view and simplifying geometrical domain to comprise a long rectangular layer of fitting, a heated layer, an interface and a pipe. The model took into account temperature dependent material properties and the EFW process was based on three assumptions:
1. a one-dimensional analysis is assumed since the area covered by the heater is very much greater than the thickness of the fitting and the pipe,
2. the temporary presence of the air gap between the fitting and the pipe does not significantly affect the heat transfer process, and
3. the energy supplied by the heater is distributed evenly through a layer of width equal to the diameter of the wire.
His transport equation accounting for heating is of the form
for the heating layer and H = 0 within the polymer, with different thermal properties
in the temperature calculation which might be significant for small couplers.
Using the same geometrical approach as Pitman, and neglecting air gap between the pipe and coupler, Dufour and Meister (1989) from Gaz de France proposed an improved model by considering latent heat effects in the heat transfer equations. They utilized both FE and FD. Their nonlinear enthalpy model accounting for phase change
was solved by a special FE package Ali-baba, developed by Direction des Etudes et Recherches d'Electricit'e de France. Their linear 1D model
was solved using explicit finite difference (FD) methods. The comparison of the two methods with experiment showed that the experimental results were an average of the two methods. Again, although the methodology of Dufour and Meister is much better, they also ignored deformation and did not fully implement the correct cylindrical geometry.
Other early numerical studies that contributed to the understanding of EFW processes were undertaken by Saint-Royre et al (1989), Nussbaum et al (1991) and Nakano et al (1989). Saint-Royre et al also from Gaz de France investigated the general fusion welding problem and their experiment suggested that the bonding at the fusion interface was probably governed by macromolecular interdiffusion. They developed a numerical model of a medium density polyethylene (MDPE) resin based upon the theory of macromolecular interdiffusion and computed the minimum temperature for an optimum weld (joint quality) as a function of heating time. The diffusion parameters were determined by a graphical method. Nussbaum et al (1991) continued the research to cater for the weldability of different pairs of resin types.
internal pressure and bending. Their work indicated that the difference in stress concentrations of the two types of fittings is not substantial and that the heating element has little influence on estimating the maximum stress in EF Fittings. To verify the adequacy of the FE results they performed fatigue tests and concluded that EF fittings posseses long-term resistance against internal pressure and external loads, guaranteeing the long-term reliability of EF fitting systems.
Returning to procees modelling, O'Donoghue et al (1991) and Kanninen et al (1992) produced simulation analyses using a commercial general purpose FE package, Abaqus. The work formed part of an ongoing research project sponsored by the Gas Research Institute (USA) to enhance the EF joining technique for the U.S. gas industry. They claimed that their 1D axisymmetric model is valid based upon the assumption that the temperature distribution in the centre of the wire region is relatively independent of axial effects. Thus they worked on a 1D thermo-mechanical analysis including temperature dependent material properties, latent heat effects, and initial clearance. Nevertheless, by ignoring axial effects, they have not fully described the heat transfer process.
Nakashiba et al (1993) and Nishimura et al (1992, 1994) went closer to reality by establishing a two-dimensional nonlinear heat transfer model with phase change based upon the Castem FE code. They used a cylindrical coordinate system and studied the effects of applied voltage, heating time, wire pitch, and ambient temperature for large 150mm sockets based on a 50mm EF socket. However, they ignored the presence of the air gap in their analysis.
and was solved using an explicit FD method. Polymer deformation was computed based on linear thermal expansion. They demonstrated that a fast, adequate, and efficient thermo-mechanical code can be generated. Their approach of using a variable space grid is, however, not necessary.
Chapter 3
Methodology
3.1 Parallel Algorithms
In Alias,Sahimi and Abdullah (2002), the six strategies of parallel algorithms in solving heat equation are implemented. These strategies were found to be more effective using the cluster of workstations. In this paper, the research focuses on the Conjugate Gradient (CG) for Alternating Group Explicit Method (AGE) in solving one dimensional heat conductor equation.
Topics will include Alternating Group Explicit-Conjugate Gradient Method (AGE_CG) and its parallel strategies. AGE_CG has been created using the acceleration technique and the parallelization of AGE_CG is achieved by domain decomposition technique on non-overlapping subdomain. The computational analysis of the proposed strategies are presented by using explicit (2x2) block systems.
3.1.1 AGE Method
3.1.2 Brian Methods
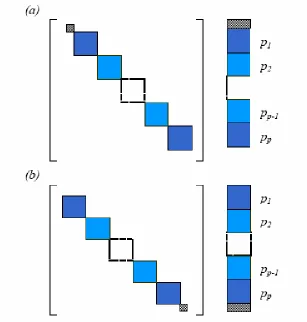
Figure 8: Subdomain is decomposited to processors p in block ordering
BRIAN and AGE is achieved by assigning the explicit block (2x2) in this way and proved that the computations involved are independent. The parallelism strategy is straight forward and the domain is distributed to non-overlapping subdomain. Based on the limited parallelism, this scheme can be effective in reducing computational complexity and data storage accesses in distributed parallel computer systems. The iterative procedure is continued until convergence is reached when the requirement of convergent criterion is met.
3.1.3 Charlie’s Method
Charlie's method is an explicit predictor-corrector type algorithm in which the predictor is a transient Euler forward approximation of the differential equation and the corrector is a convex-type operation. It was proposed by Dey and Dey (1983) to solve fluid flow problems. Consider the initial value problem
to be approximated by Euler's method
δ is the time step and is the grid function corresponding to Charlie's algorithm for solving equation (1) is a two-step procedure
where 0<γ <1. If γ =0, the original (explicit) method is recovered by the predictor. As an example of a partial differential equation consider the one-dimensional heat equation
with initial condition and boundary conditions
The solution of equation (4) by Charlie's method may be obtained by applying the usual explicit FD formula that utilizes a forward Euler step for the time derivative and a central difference replacement for the spatial derivative:
where is the grid function corresponding to is the time step,
h is the spatial mesh size, and , the corrector is not implemented and
the algorithm again defaults to the underlying explicit method. Osman and Wood (2001) have shown that the stability property of the method is better than the simple explicit scheme by improving the time step by a factor of 4 from to This is achieved when γ = 1/8. They also show that the range of r depends on γ as follows:
Parallel implementation
As Charlie's method is fully explicit, its attractive feature can be exploited for parallelization. The computational domain, consisting of both equations (5), is decomposed into a number of non-overlapping subdomains. A mapping strategy is then
used to equivalently assign the subdomains to p processors in explicit block
ordering independently.
3.1.4 Gauss-Seidel Method
Gauss-Seidel method is chosen as a control schemes. The Gauss-Seidel method is a technique used to solve a linear system of equations. The method is named after the German mathematicians Carl Friedrich Gauss and Philipp Ludwig von Seidel. The method is similar to the Jacobi method (and likewise diagonal dominance of the system is sufficient to ensure convergence, meaning the method will work).
We seek the solution to a set of linear equations, expressed in matrix terms as
The Gauss-Seidel iteration is
where D, −L, and −U represent the diagonal, lower triangular, and upper triangular parts
of the coefficient matrix A and k is the iteration count. This matrix expression is mainly
of academic interest, and is not used to program the method. Rather, an element-based approach is used:
Note that the computation of uses only those elements of that have
already been computed and only those elements of that have yet to be advanced to iteration k + 1. This means that no additional storage is required, and the computation can
Algorithm
Chose an initial guess φ0
for k := 1 step 1 until convergence do for i := 1 step until n do
σ = 0
for j := 1 step until i-1 do
end (j-loop)
for j := i+1 step until n do
end (j-loop)
end (i-loop)
check if convergence is reached end (k-loop)
3.3 Implementation on Message Passing Systems
Message passing is referred as:
1. Objects communicate by sending messages. 2. Messages convey some form of information.
3. An object requests another object to carry out an activity by sending it a message. 4. Most messages pass arguments back and forth.
5. Meilir Page-Jones defines three types of messages:
i. Informative - send information for the object to update itself. ii. Interrogative - ask an object to reveal some information about itself iii. Imperative - take some action on itself, or another object
6. Grady Booch defines four types of messages:
i. Synchronous - receiving object starts only when it receives a message from a sender, and it is ready.
ii. Balking - sending object gives up on the message if the receiving object is not ready to accept it.
iii. Timeout - sending object waits only for a certain time period for the receiving object to be ready to accept the message.
iv. Asynchronous - sender can send a message to a receiver regardless of whether the receiver is ready to receive it.
that is entirely responsible for interfacing with the physical communication network linking the actual processors together.
Message Passing Systems referred as:
1. Processors communicate by sending messages over bidirectional communication channels
2. Pattern of connections describes the topology of the system 3. Topology represented by undirected graph
4. nodes - processors
5. edges - channels between processors
6. Collection of channels is called the network 7. Processor's local program enables
i. local computation
ii. sending messages to and receiving messages from each of the neighbors Synchronous Systems referred as:
1. Processors execute in lock-step
2. The sequence of alternating configurations and events is partitioned into disjoint rounds
3. A round consists of a deliver event for every message in an outbuf variable until all outbuf variables are empty, and then one computation event for every processor
That is, a round consists of delivering all pending messages and then having every processor take an internal computation step to process all delivered messages:
1. An execution is admissible if it is infinite
As the AGE method is fully explicit, its feature can be fully utilized for parallelization. Firstly, Domain is distributed to Ω Ωp subdomains by the master processor. The
partitioning is based on domain decomposition technique. Secondly, the subdomains
p
Ω of AGE method are assigned into p processors in block. The communication
activities between the slave processors are needed for the computations in the next iterations. The parallelization of AGEB is achieved by assigning the explicit (2x2) block
systems. The parallelism strategy is straightforward with no overlapping subdomains. Based on the limited parallelism, this scheme can be effective in reducing computational complexity and data storage accesses in distributed parallel computer systems.
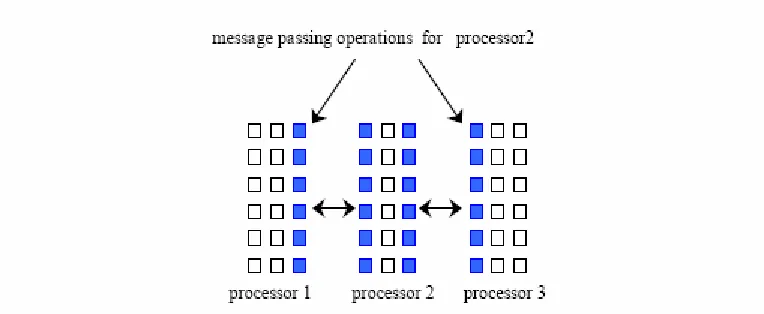
Figure 9: Message passing operations between processors
The parallel strategies are based on the non-overlapping subdomain. There are no data exchange between the neighboring processors at the iteration (k) but there are
inter-processor communications between the iteration (k) and the next iteration (k+1). A
typical parallel implementation of a parallel AGE_CG assigns several mesh points to each processor p such that each processor only communicates with its two nearest
neighbors; see figure above, where there are p=3 and grids m=54. The computations of
Table 3: Computational complexity and communication cost for the parallel
algorithms
3.4 Parallel Procedure
Implement as an SPMD model
1 The entire array is partitioned and distributed as subarrays to all tasks. Each task
owns a portion of the total array.
2 Determine data dependencies
i. Interior elements belonging to a task are independent of other tasks ii. Border elements are dependent upon a neighbor task's data, necessitating
communication.
3 Master process sends initial info to workers, checks for convergence and collects
results
4 Worker process calculates solution, communicating as necessary with neighbor
processes
5 Pseudo code solution: red highlights changes for parallelism.
find out if I am MASTER or WORKER
if I am MASTER initialize array
send each WORKER starting info and subarray
do until all WORKERS converge
broadcast to all WORKERS convergence signal end do
receive results from each WORKER
else if I am WORKER
receive from MASTER starting info and subarray
do until solution converged update time
send neighbors my border info
receive from neighbors their border info
update my portion of solution array
determine if my solution has converged send MASTER convergence data
receive from MASTER convergence signal end do
send MASTER results
endif
3.5 Parallel Execution Time and Communication Time
The following definitions are used to measure the parallel strategies, speedup 1 p p T S T = ,
efficiency p p
S C
P
= , effectiveness p p
p C F
T
= , and temporal performance , where
is the execution time on one processor, is the execution time on p processors and
the unit of is work done per microsecond. The important factors effecting the
performance in message-passing on distributed memory computer systems are communication patterns and computational per communication ratios. The important factors effecting the performance in message-passing paradigm on a distributed memory computer systems are communication patterns and computational/ communication ratios. The communication time will depend on many factors including network structure and
1
p p
L =T−
1
T Tp
network contention (Wolfgang, 1988). Parallel execution time, tpara is composed of two
parts, computation time (tcomp) and communication time (tcomm). tcomp is the time to
compute the arithmetic operations such as multiplication and addition operations of a sequential algorithms. Analysis of the tcomp assumes that all the processors are the same
and the operating at the same speed. tcomm will depend upon the size of message. If the
number of iterations b, and size of the message for communication m, the formula for
communication time is as follows,
tcomm =b( tstart + m tdata + tidle )
where tstart is the startup time (message latency). tdata is time to send a message with no
data. The term tdata is the transmission time to send one data word. tidle is the time for
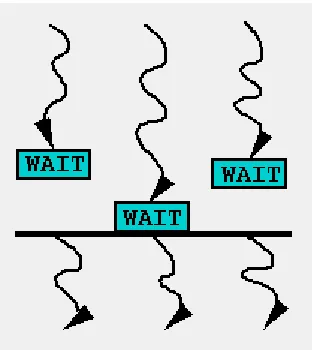
message latency, time to wait for all the processors to complete the process as shown in the figure below. It is also a means of quantifying the degree of load imbalance in the parallel algorithm. In order to estimate the coefficients tstart and tdata , a number of
experiments were conducted for different message sizes. Table 1 shows that the implementation of CG made the computational complexity and communication cost of AGE and GSRB are decreased.
Figure 10: Synchronization of n processes. WAIT blocks until all n processes have
3.5.1 Threads Model
1 In the threads model of parallel programming, a single process can have multiple,
concurrent execution paths.
2 Perhaps the most simple analogy that can be used to describe threads is the concept of
a single program that includes a number of subroutines:
i. The main program a.out is scheduled to run by the native operating system.
a.out loads and acquires all of the necessary system and user resources to run.
ii. a.out performs some serial work, and then creates a number of tasks (threads)
that can be scheduled and run by the operating system concurrently.
iii. Each thread has local data, but also, shares the entire resources of a.out. This
saves the overhead associated with replicating a program's resources for each thread. Each thread also benefits from a global memory view because it shares the memory space of a.out.
iv. A thread's work may best be described as a subroutine within the main program.
Any thread can execute any subroutine at the same time as other threads.
v. Threads communicate with each other through global memory (updating
address locations). This requires synchronization constructs to insure that more than one thread is not updating the same global address at any time.
vi. Threads can come and go, but a.out remains present to provide the necessary
3.5.2 Complexity Measures
1 Worst-Case and Expected-Case Performance
2 Assume each processor's state set includes a subset of terminated states:
3 each processor's transition function maps terminated states only to terminated states:
i. The system (algorithms) has terminated when all the processors are in terminated states and no messages are in transit.
4 The Message Complexity of an algorithm for both synchronous and asynchronous system is the maximum, over all admissible executions of the algorithm, of the total number of messages sent
5 The Time Complexity of an algorithm for a synchronous message passing system is the maximum number of rounds, in any admissible execution of the algorithm, until the algorithm has terminated
6 In asynchronous systems,
i. assume that the maximum message delay in any execution is one unit of time and then calculate the running time until termination
7 Timed execution concept
3.5.3 Timed Execution
1 A non negative real number is associated with each event - this is the time at which that event occurs
2 times start at 0
i. must be non decreasing
ii. strictly increasing for each individual processor
iii. must increase without bound if the execution is infinite
4 several events can happen at the same time as long as they do not occur at the sam processor
5 only finitely many events before a finite time
6 The delay of a message is the time that elapses between the computation event that sends the message and the computation event that processes that message
7 that is, the amount of time the message waits in the sender's outbuf, plus the amount of time the message waits in the recipient's inbuf
8 The Time Complexity of an asynchronous algorithm is the maximum time until termination among all timed admissible execution in which every message delay is at most one.
3.6 Numerical Model
This section describes the development of mathematical modeling and simulation of a one-dimensional thermal EFW model. We developed a sequence of models of increasing refinement. The final model is expected to roughly mimic the actual EFW process. An essential element for the model is that a hot wire acts as a heat source, driving the heat from the fitting, across the air gap, and eventually to the pipe. Temperature distribution in the pipe-fitting is governed by the transient heat conduction equation, in a radial coordinate system, which forms the basis of the heat transfer model. Figure 11 displays a radial cross-section of the pipe-fitting length.
3.6.1 Fitting Model
Heat transfer in the fitting is induced by an embedded hot wire. For a 1-D radial model, the wire is taken to be one of the nodes located sufficiently close to the inner fitting surface. The appropriate physical heat equation governing the heat transfer process in the fitting is
where is the maximum temperature of the wire and T_∞ is the
ambient temperature. Figure 12 shows the evolving of the wire temperature during a heating period of 220 s.
Figure 12: Wire temperature (Wood et. al, 1998)
Based on Figure 12 it is quite reasonable to describe and approximate the wire temperature as a function of time,
For the thermal boundary conditions, we have assumed the inner and outer fitting surface is losing heat to the ambient by convection given by
the physical equations reduce to
with wire temperature function
and boundary conditions
3.6.2 Pipe Model
Next, we add the pipe `problem' to the existing fitting model by assuming a perfect thermal contact (no thermal resistance) at the pipe-fitting interface. The heat equation in the pipe is the same as in the fitting (with different thermal diffusivity). Thus,
Thermal modelling at the interface accounting for perfect contact is
while the inner pipe surface loses heat to the ambient through convection given by
where Boundary conditions respectively becomes
3.6.3 Fixed Gap Model
The next stage of the modelling is to include a fixed gap between the pipe and fitting. We have considered two types of thermal model across the gap: convection alone, and convection plus radiation heat transfer expression. Conduction in the gap is not considered since the thermal conductivity of air is very low, making the flow of heat very slow. The governing equations in the pipe and fitting stay the same, as do the boundary condition at the inner pipe surface and outer fitting surface. Figure 13 illustrates the heat transfer process in the pipe-gap-fitting during the heating up period.
Figure 13: Heat Transfer Process
Chapter 4
Computational Results
4.1 AGE and Brian Methods
The experiments were run on the homogeneous cluster of 20 Intel Pentium IV PCs, each with storage of 20GB and speed of 1.6 MHz.
Numerical experiments on a heat conduction problem in equation (1) confirmed the viability of the sequential algorithm of AGE_CG method. While the convergence and accuracy of the results are comparable to the existing methods (i.e. AGE, GSRB_CG and GSRB), see Table 4. Due to the implementation of CG, the number of iterations of AGE_CG and GSRB_CG are less AGE and GSRB. The sequential AGE_CG is better in convergence than GSRB_CG. The results also show that the time execution for AGE_CG and GSRB_CG was about 39% and 35% shorter than AGE and GSRB. Furthermore, AGE_CG is the best in terms of convergence and accuracy. The adaptation CG method into the sequential AGE, make the convergence of AGE_CG increasing to 80% and the computational complexity decreasing to 64.77%.
This section presents the numerical properties of the parallel solver on the homogeneous architecture of 20 PCs with Linux operating, Intel Pentium IV processors, 20GB HDD, connected with internal network Intel 10/100 NIC and using message-passing libraries, PVM. The following definitions are used to measure the parallel algorithms, speedup Sp=T1/Tp efficiency Cp=Sp/p effectiveness Fp= Sp/Cp and temporal
performance Lp=1/Tp. Where T1 is the execution time on one processor, Tp is the
execution time on p processors. Parallel algorithm of Gauss Seidel Red Black is chosen
as the control scheme. The graph of the speedup, efficiency and effectiveness versus number of the processors were plotted in Figures 14 below. The parallel algorithm with the highest performance executed in the least time and is therefore the best algorithm.
0 3 6 9 12 15 18
1 3 5 7 9 11 13 15 17 19 num.of processors
speedup
0.2 0.4 0.6 0.8 1.0
1 3 5 7 9 11 13 15 17 19 num.of processors
0.0 0.1 0.1 0.2 0.2 0.3 0.3 0.4 0.4 0.5
1 3 5 7 9 11 13 15 17 19
num.of processors
effectiveness
AGE_CG AGE GSRB_CG GSRB
Figure 14: The parallel performances vs. number of processors
Table 5: The gain of communication time, computational complexity and tcomp/tcomm ratio
versus number of processors
As expected, the execution time decreases with the increasing p. AGE_CG strategy is
GSRB_CG and GSRB for all numbers of processors. It is indicated that the superiority of the AGE_CG method lies in its temporal performance.
4.2 Performance of Charlie’s Method
The results of parallel performance are shown in figure 15-19. Referring to figure 15, the execution time of Charlie's method decreases faster than GSRB when the number of processors increases. The speedup, effectiveness, and temporal performance graphs indicate that the parallelism of Charlie's method is highly encouraging compared to GRSB as shown in figures 16,17 and 18.
Figure 18: Effectiveness vs number of processors
Figure 19: Temporal performance vs number of processors
Further, Charlie's scheme is more efficient compared to GSRB as illustrated in figure 20. The graph of the scheme decreases slowly when the number of processors increases. This is because Charlie's scheme uses minimum communication, idle and startup time. These phenomena come from the fact that the scheme utilizes minimum number of iterations to fulfill the convergence criterion requirement.
Charlie's scheme demonstrates favourable outcomes with respect to sequential performance measurements as well. Figure 1 presents the performance based on the number of iterations, the root mean square error (rmse), the maximum rmse, the absolute maximum relative error and the execution time.
Figure 20: Sequential performance measurement
The rate of convergence and the accuracy of the scheme are much superior than that of GSRB and Jacobi. For large scale problems such as in case 1, the relative percentage of accuracy, rate of convergence and execution time are respectively 50%, 75% and 61% better than GSRB.
4.3 Fitting Result
With uniform grids and a wire depth of 1mm (from the inner fitting), the simulated temperature profile in the fitting during the heating period (of 220s) is displayed in Figure 21. The peak in the profile represents the wire temperature. A stable time step k is
Figure 21: Temperature profile in fitting 4.4 Pipe Result
Figure 22: Temperature profile in pipe-fitting
A stable time step is obtained through the same heuristic argument as before, where k is
Chapter 5
Concluding Remarks and Suggestions
Compared to AGE_CG, AGE, GSRB_RB and GSRB methods, sending a larger value of messages and the frequency of communications are reflected the communication time. Therefore, the cost communication and computational complexity are effected the speedup ratio, efficiency and effectiveness of the parallel algorithms. Table 2 shows that the gain in communication time and tcomp/tcomm ratio of AGE method is lower than GSRB
methods. The gains in ratio are implied that the computational complexity of the algorithms which clearly shows that the AGE_CG method has less memory accesses than AGE method with the limited communication time.
The result on a cluster of workstations shows that AGE_CG method is the most superior and effective method among the three algorithms. Parallel CG method is inherently explicit, the domain decomposition strategy is efficiently utilized and straightforward to implement on a cluster of workstations. In the context communication activities and work balance on a distributed parallel computer systems, we reach the conclusion that AGE_CG and GSRB_CG methods are alternative to AGE and GSRB.
With regard to Charlie’s method, our experiment shows that with suitable choice of filtering parameter γ Charlie's method has the potential to be a favourite scheme for solving parabolic problems. We have demonstrated that the method is very attractive to solving large scale linear heat transfer problems because of its simplicity and high performance achievements. Further research is underway to compare the performance with other well known classes iterative methods of IADE, AGE and EDG .
REFERENCES
Alias, Sahimi., Abdullah, A. 2002.Proceedings of the 7th Asian Technology Conference in Mathematics 7:390-97
Al Geist, A. Beguelin, J. Dongarra, W. Jiang, R. Manchek,V. Sunderam, PVM : Parallel Virtual Machine, A Users’ Guide and Tutorial for Networked Parallel Computing. MIT Press, Cambridge, Mass, 1994
D.J. Evans, M.S. Sahimi. 1989, The alternating Group Explicit Iterative method (AGE) to Solve Parabolic and Hyperbolic Partial Differential Equation. In Annual Review of Numerical Fluid Mechanics and Heat Transfer,Vol.2,pp.283-389, Hemisphere
Publication Corp. New York.
Wolfgang, S.P. 1994. The Logical Design of Parallel Operating Systems. New Jersey: PTR Prentice Hall.
Abdullah, A.R. 1991a. The Four Point Explicit Decoupled Group (EDG) Method: A Fast Poisson Solver. Inter. Journal Computer mathematics.
38 61--70.
Alias, N., Sahimi, M.S. Abdullah, A.R. 2002. Parallel Algorithms On Some Numerical Techniques Using PVM Platform On A Cluster Of workstations. Proc. of The 7 Asian Technology Conference in Mathematics. 7: 390--97.
Sahimi, M.S. Alias, N. 2001. Beberapa Strategi Selari Kaedah Tak Tersirat Penghuraian Berselang-Seli Ke Atas Mesin Maya Selari. Pros. Simposium Kebangsaan Sains
Matematik ke-9. : 284--288.
Alias, N., Sahimi, M.S. Abdulllah, A.~R. 2002. The Parallel Implementation of IADE and AGE Algorithms Using Parallel Virtual Machine On A Distributed Parallel Systems. Proc. of The Conference On Information Technology Research Application.7 390--97.
Evans, D.J. Sahimi, M.S. 1989. The alternating Group Explicit (AGE) Iterative method for Solving Parabolic Equations II: 3 Space Dimensional Problems. International Journal Computer Mathematic 26: 117--142.
J.~Bowman (1997). A review of the electrofusion joining process for polyethylene pipe systems, \emph{Polym. Eng. Sci.}, 37,674-691.
J.~Bowman, T.~Medhurst and R.~Portas (1992). Procedures for quantifying the strength of electrofusion joints, \Proc. Plastics Pipes VIII, Koningshof, The Netherlands, B2/5.1-12.
J.Bowman (1991). Fusion joining of cross-linked polyethylene pipe, in Advances in joining plastics and composites, TWI paper 13, Bradford, UK.
D.Morris and B.W.~Gill (1992). Fusion jointing of PE pipes - a water industry perspective, Proceedings of Plastics Pipes VIII, Koningshof, Netherlands. B2/1-8. P.E.O'Donoghue, M.F.Kanninen, S.T.Green and S.C.Grigory (1991). Results of a thermomechanical analysis model for electrofusion joining of PE gas pipes, Proceedings of the 12th Plastic Fuel Gas Pipe Symposium, Boston, USA. 341-342.
DUsclat (1985). Characteristics of a good joint with electrofusion fittings, Proceedings of Plastics Pipes VI, University of York, UK. 31 A 1-8.
M.Fujikake, M.Fukumura and K.Kitao (1997). Analysis of the electrofusion joining process in polyethylene gas piping systems, Computers & Structures, 64, 939-948.
M. F.Kanninen, G.S.Buczala, C.J.Kuhlman, S.T.Green, S.C.Grigory, P.E.O'Donoghue and M. A.McCarthy (1992). A theoretical and experimental evaluation of the long term integrity of an
electrofusion joint, \Proceedings of Plastics Pipes VIII, Koningshof, Netherlands, B2/3.1-10.
G.L.Pitman (1985). Electrofusion welding prediction and computer-aided design of fittings, Proceedings of Plastics Pipes VI, University of York, UK. 29.1-7.
D.Dufour and E. Meister (1989). Polyethylene electrofusion technique: Prediction model of welding quality, \Proc. Int. Gas Resources Conf., Japan, 232-242.
D.Saint-Royre, D.Gueugnaut and D.Reveret (1989). Test methodology for the determination of optimum fusion welding conditions of polyethylene, J. Applied Polymer Science, 38,147-162.
M.Nussbaum, D.Dufour and D.Gueugnaut (1991). Electrofusion of polyethylene: how and why, Proceedings of the 12th Plastic Fuel Gas Pipe Symposium, Boston, USA. 324-330.
T.Nakano, K.Kitao, Y.Yamda, S.Imura and S.Akiyama (1989). Strength evaluation of electrofusion joints in polyethylene gas piping system, Proceedings of the 11th Plastic Fuel Gas Pipe Symposium, 112-126.
H.~Nishimura, F.~Inoue and T.~Ishikawa (1992). Fusion simulation of electrofusin joints, Proceedings of the International Gas Resources Conference, Japan. 495-502.
H.~Nishimura, F.~Inoue, A.~Nakashiba and T. Ishikawa (1994). Design of electrofusion joints and evaluation of fusion strength using fusion simulation technology, Polym. Eng. Sci., 34, 1529-1534.
A.S.~Wood, G.F.~Rosala, A.J.~Day, I. Torsun and N.~Dib (1994). Variable grid model for thermoelastic deformation, in Advanced Computational Methods in Heat Transfer III ( ed. L.C.~Wrobel, C.A.~Brebbia and A.J.~Nowak), CMP, Southampton, UK. 481-488.
Dey, S.K. and Dey, C. (1983). An explicit predictor-corrector solver with applications to Burgers's equation, in NASA Technical Memo 84402, NASA-Ames Research Centre, Moffett Field, CA.