A Constraint and Rule In
an Enhancement of Binary
Particle Swarm Optimization To
Select Informative
Genes For Cancer Classification
Mohd Saberi Mohamad1,*, Sigeru Omatu2, Safaai Deris1, and Michifumi Yoshioka2
1Artificial Intelligence and Bioinformatics Research Group, Faculty of Computer Science and
Information Systems, Universiti Teknologi Malaysia, Skudai, 81310 Johor, Malaysia.
{saberi*, safaai}@utm.my
2Department of Computer Science and Intelligent Systems, Graduate School of Engineering, Osaka
Prefecture University, Sakai, Osaka 599-8531, Japan
{omatu, yoshioka} @cs.osakafu-u.ac.jp
*Corresponding author
Abstract
Gene expression data have been analyzing by many researchers by using a range of computational intelligence methods. From the gene expression data, selecting a small subset of informative genes can do cancer classification. Nev-ertheless, many of the computational methods face difficulties in selecting small subset since the small number of samples needs to be compared to the huge number of genes (high-dimension), irrelevant genes and noisy genes. Hence, to choose the small subset of informative genes that is significant for the cancer classification, an enhanced binary particle swarm optimization is proposed. Here, the constraint of the elements of particle velocity vectors is introduced and a rule for updating particle’s position is proposed. Experiments were per-formed on five different gene expression data. As a result, in terms of classifica-tion accuracy and the number of selected genes, the performance of the intro-duced method is superior compared to the conventional version of binary parti-cle swarm optimization (BPSO). The other significant finding is lower running times compared to BPSO for this proposed method.
1
Introduction
Advances in microarray technology allow scientists to measure the expression levels of thousands of genes simultaneously in biological organisms and have made it possi-ble to create databases of cancerous tissues. It finally produces gene expression data that contain useful information of genomic, diagnostic, and prognostic for researchers [3]. Thus, there is a need to select informative genes that contribute to a cancerous state [5]. However, the gene selection process poses a major challenge because of the following characteristics of the data: the huge number of genes compared to the small number of samples (high-dimensional data), irrelevant genes, and noisy data. To overcome this challenge, a gene selection method is used to select a subset of infor-mative genes that maximizes classifier’s ability to classify samples more accurately [6]. In computational intelligence domains, gene selection is called feature selection.
Recently, several gene selection methods based on particle swarm optimization (PSO) have been proposed to select informative genes from gene expression data [4],[7]-[10]. PSO is a new evolutionary technique proposed by Kennedy and Eberhart [1]. Shen et al. have proposed a hybrid of PSO and tabu search approaches for gene selection [7]. However, the results obtained by using the hybrid method are less meaningful since the application of tabu approaches in PSO is unable to search a near-optimal solution in search spaces. Next, Li et al. have introduced a hybrid of PSO and genetic algorithms (GA) for the same purpose [4]. Unfortunately, the accu-racy result is still not high and many genes are selected for cancer classification since there are no direct probability relations between GA and PSO.
Next, Chuang et al. proposed an improved binary PSO [8]. 100% classification ac-curacy in many data sets had been yielded by using the proposed method, but it util-ized a large number of selected genes (large gene subset) to obtain the high accuracy. This method used a large number of genes because the global best particle was reset to the zero position when its fitness values did not change after three consecutive iterations. Chuang et al. [9],[10] introduced a combination of tabu search and PSO for gene selection [9], and currently they proposed a hybrid of BPSO and a combat GA for the same purpose [10]. However, both proposed approaches still need a high num-ber of selected to result high classification accuracy. A significant weakness was found resulting from the combination of PSO and tabu search or a combat GA which did not share probability significance in their processes. Generally, the PSO-based methods are intractable to efficiently produce a small (near-optimal) subset of infor-mative genes for high classification accuracy [4],[7]-[10]. This is mainly because the total number of genes in gene expression data is too large (high-dimensional data).
This paper is organized as follows. In Section 2 and Section 3, we briefly describe the conventional version of binary PSO and CPSO, respectively. Section 4 presents data sets used and experimental results. Section 5 summarizes this paper by providing its main conclusions and addresses future developments.
2
The Conventional Version of Binary PSO (BPSO)
BPSO is initialized with a population of particles. At each iteration, all particles move in a problem space to find the optimal solution. A particle represents a potential solution in an n-dimensional space. Each particle has position and velocity vectors for directing its movement. The position vector and velocity vector of the ith particle in the n-dimension can be represented as Xi=(xi1,x
i
2,...,x
i
n) and
V
i
=
(
v
i1
,
v
i
2
,...,
v
i n
)
,re-spectively, where
x
idÎ
{0,1};
i=1,2,..m (m is the total number of particles); andd=1,2,..n (n is the dimension of data) [2].
v
id represent an element of particle velocity vectors. It is a real number for the d-th dimension of the particle i, where the maxi-mumv
id, Vmax=(1/ 3)´n.In gene selection, the vector of particle positions is represented by a binary bit string of length n, where n is the total number of genes. Each position vector
(
X
i)
denotes a gene subset. If the value of the bit is 1, it means that the corresponding gene is selected. Otherwise, the value of 0 means that the corresponding gene is not se-lected. Each particle in the t-th iteration updates its own position and velocity accord-ing to the followaccord-ing equations:
v
id(
t
+
1)
=
w
(
t
)
´
v
i d(
t
)
+
c
1
r
1d
(
t
)
´
(
pbest
id
(
t
)
-
x
i d(
t
))
+
c
2
r
2d
(
t
)
´
(
gbest
d(
t
)
-
x
i d(
t
))
(1)
Sig
(
v
id(
t
+
1))
=
1
1
+
e
-vid(t+1) (2)if Sig v t( ( 1))id r t3d( ), then d( 1) 1;
i
x t else d( 1) 0
i
x t (3)
where
c
1 andc
2 are the acceleration constants in the interval [0,2].r
1d(
t
),
r
2d(
t
),
r
3d(
t
) ~
U
(0,1)
are random values in the range [0,1] that sampled from auniform distribution. Pbesti(t)=(pbesti1(t),pbest
i
2(t),...,pbest
i
n(t)) and
Gbest
(
t
)
=
(
gbest
1(
t
),
gbest
2(
t
),...,
gbest
n(
t
))
represent the best previous position ofthe ith particle and the global best position of the swarm (all particles), respectively.
where
Sig
(
v
id(
t
+
1))
Î
[0,1].
w
(
t
)
is an inertia weight and initialized with 1.4. It isupdated as follows:
w(t+1)=(w(t)-0.4)´(MAXITER-Iter(t))
(MAXITER+0.4) (4)
where MAXITER is the maximum iteration (generation) and
Iter
(
t
)
is the current iteration.3
An enhancement of Binary PSO (CPSO)
Almost all previous works of gene expression data researches have selected a subset of genes to obtain excellent cancer classification. Therefore, in this article, we pro-pose CPSO for selecting a near-optimal (small) subset of genes. It is propro-posed to overcome the limitations of BPSO and previous PSO-based methods [4],[7]-[10]. CPSO in our work differs from BPSO and the PSO-based methods on two parts: 1) we propose the constraint of elements of particle velocity vectors; 2) we introduce a rule for updating
x t
id(
1)
, whereas BPSO and the PSO-based methods have used the original rule (Eq. 3) and no constraint of elements of particle velocity vectors. The constraint and rule are introduced in order to:1.increase the probability of
x
id(
t
+
1)
=
0
(
P
(
x
id
(
t
+
1)
=
0))
.2.reduce the probability of d
( 1) 1
ix t
( ( ( 1) 1))
di
P x t
.The increased and decreased probability values cause a small number of genes are selected and grouped into a gene subset. d
( 1) 1
i
x t
means that the corresponding gene is selected. Otherwise, d( 1) 0
i
x t
represents that the corresponding gene is not selected.The constraint of elements of particle velocity vectors and the rule are proposed as follows:
Sig
(
v
id(
t
+
1))
=
1
1
+
e
-vid(t+1)subject to
v
i
d
(
t
+
1)
³
0
(5)
if
Sig
(
v
id(
t
+
1))
>
r
3
d
(
t
),
thenxid
Theorem 1. The constraint of elements of particle velocity vectors and the rule
in-crease
P
(
x
id(
t
)
=
0)
because the minimum value forP
(
x
id
(
t
)
=
0)
is 0.5 whenv
id(
t
)
=
0
(min
P
(
x
i
d
(
t
)
=
0)
³
0.5).
Mean while, they decrease the maximum valuefor
P
(
x
id(
t
)
=
1)
to 0.5(max
P
(
x
id
(
t
)
=
1)
£
0.5).
Therefore, ifv
id
(
t
)
>
0,
thenP
(
x
id(
t
)
=
0)
>>
0.5
andP
(
x
id
(
t
)
=
1)
<<
0.5.
Proof.
(
Þ
)
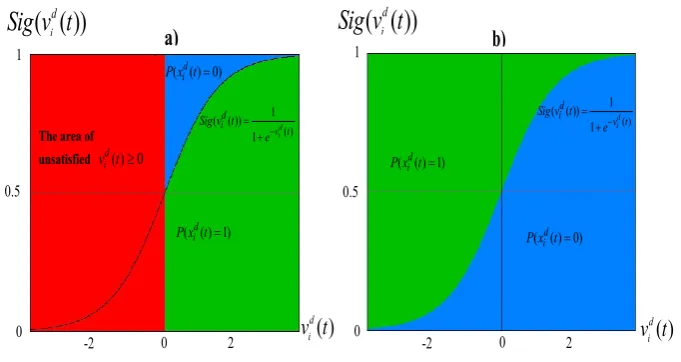
Figure 1 shows that a) The constraint of elements of particle velocityvectors and the rule in CPSO increase
P
(
x
id(
t
)
=
0);
b) Equations (1-3) in BPSOyield
P
(
x
id(
t
)
=
0)
=
P
(
x
id
(
t
)
=
1)
=
0.5.
For example, the calculations forP
(
x
id(
t
)
=
0)
andP
(
x
id
(
t
)
=
1)
in Fig. 2(a) are shown as follows:if
v
id(
t
)
=
1,
thenP
(
x
id
(
t
)
=
0)
=
0.73
andP
(
x
id
(
t
)
=
1)
=
1
-
P
(
x
id
(
t
)
=
0)
=
0.27.
if
v
id(
t
)
=
2,
thenP
(
x
id
(
t
)
=
0)
=
0.88
andP
(
x
id
(
t
)
=
1)
=
1
-
P
(
x
id
(
t
)
=
0)
=
0.12.
The fitness value of a particle (a gene subset) is calculated as follows:
fitness
(
X
i)
=
w
1´
A
(
X
i)
+
(
w
2(
n
-
R
(
X
i)) /
n
)
(7)
in which
A
(
X
i)
Î
éë ùû
0,1
is leave-one-out-cross-validation (LOOCV) classificationaccuracy that uses the only genes in a gene subset
(
X
i).
This accuracy is provided by support vector machine classifiers (SVM).R
(
X
i)
is the number of selected genes in4
Experiments
4.1 Data Sets and Experimental Setup
The gene expression data sets used in this study are summarized in Table 1. They included binary-classes and multi-classes data sets. Experimental results that pro-duced by CPSO are compared with an experimental method (BPSO) for objective comparisons. Additionally, the latest PSO-based methods from previous related works are also considered for comparison with CPSO [4],[7]-[10]. Firstly, we applied the gain ratio technique for pre-processing in order to pre-select 500-top-ranked genes. These genes are then used by CPSO and BPSO. Next, SVM is used to measure LOOCV accuracy on gene subsets that produced by CPSO and BPSO. For LOOCV, one sample in the training set is withheld and the remaining samples are used for building a classifier to classify the class of the withheld sample. By cycling through all the samples, we can get cumulative accuracy rates for classification accuracy of methods. In this research, LOOCV is used for measuring classification accuracy due to the small number of samples in gene expression data. Several experiments are in-dependently conducted 10 times on each data set using CPSO and BPSO. Next, an average result of the 10 independent runs is obtained. High LOOCV accuracy, the small number of selected genes, and low running time are needed to obtain an excel-lent performance.
( ) 1 ( ( ))
1 di d i v t
Sig v t e 0 1 0.5 0
( ( ) 1)di
P x t
( ( ) 0)di
P x t
( )
d iv t
( ( ))
di
Sig v t
2 -2 b) 0 1 0.5 0
( ( ) 0)di
P x t
( )
d iv t
2 -2The area of unsatisfied v tid( ) 0
a)
( ( ))
di
Sig v t
( ( ) 1)id
P x t
( ) 1 ( ( ))
1 id d i v t
Sig v t e
Fig. 1. The areas of
P
(
x
id(
t
)
=
0)
andP
(
x
i
d
(
t
)
=
1)
based on sigmoid functions in a)CPSO; b) BPSO. The blue and green colors show the areas for
P
(
x
id(
t
)
=
0)
andP
(
x
id(
t
)
=
1)
respectively, and whereas the red color indicates the part of unsatisfiedvid(t)³0
( )
1 ( ( ))
1 di d
i v t
Sig v t e 0 1 0.5 0
( ( ) 1)di P x t
( ( ) 0)id P x t
( )
d i
v t
( ( ))
d iSig v t
2 -2
b)
0 1 0.5 0( ( ) 0)id P x t
( )
d iv t
2 -2The area of unsatisfied v tid( ) 0
a)
( ( ))
di
Sig v t
( ( ) 1)id P x t
( )
1 ( ( ))
1 id d
i v t
Sig v t e
( )
1 ( ( ))
1 di d
i v t
Sig v t e 0 1 0.5 0
( ( ) 1)di P x t
( ( ) 0)id P x t
( )
d i
v t
( ( ))
d iSig v t
2 -2
b)
0 1 0.5 0( ( ) 0)di P x t
( )
d iv t
2 -2The area of unsatisfied v tid( ) 0
a)
( ( ))
di
Sig v t
( ( ) 1)di P x t
( )
1 ( ( ))
1 di d
i v t
Sig v t e ( ) 1 ( ( ))
1 di d
i v t
Sig v t e 0 1 0.5 0
( ( ) 1)id P x t
( ( ) 0)di P x t
( )
d i
v t
( ( ))
d iSig v t
2 -2
b)
0 1 0.5 0( ( ) 0)id P x t
( )
d iv t
2 -2The area of unsatisfied d( ) 0
i
v t
a)
( ( ))
d iSig v t
( ( ) 1)id P x t
( )
1 ( ( ))
1 id d
i v t
Sig v t e
( )
1 ( ( ))
1 id d
i v t
Sig v t e 0 1 0.5 0
( ( ) 1)di P x t
( ( ) 0)id P x t
( )
d i
v t
( ( ))
d iSig v t
2 -2
b)
0 1 0.5 0( ( ) 0)id P x t
( )
d iv t
2 -2The area of unsatisfied d( ) 0
i
v t
a)
( ( ))
d iSig v t
( ( ) 1)di P x t
( )
1 ( ( ))
1 id d
i v t
Sig v t e
Table 1. The summary of gene expression data sets.
Data set No. classes No. samples No. genes Source
Leukemia 2 (ALL and AML) 72 (67 ALL and 25 AML) 7,129 http://www.broad.mit.edu/cgi-bin/cancer/datasets.cgi
Lung 2 and (MPM
ADCA)
181 (31 MPM
and 150
ADCA)
12,533 http://chestsurg.org/publications/2002-microarray.aspx.
MLL 3 MLL, and (ALL, AML)
72 (24 ALL, 20 MLL, and 28 AML)
12,582 http://www.broad.mit.edu/cgi-bin/cancer/datasets.cgi
SRBCT
4 (EWS,
RMS, NB, and BL)
82 (28 EWS, 25 RMS, 18 NB, and 11 BL)
2,308 http://research.nhgri.nih.gov/microarray/Supplement/
Colon 2 (Normal and tumor) 62 (22 normal and 40 tumor) 2,000 http://microarray.princeton.edu/oncology/affydata/index.h tml
Note:
MPM = malignant pleural mesothelioma. ADCA = adenocarcinoma.
ALL = acute lymphoblastic leukemia.
MLL = mixed-lineage leukemia. AML = acute myeloid leukemia. SRBCT = small round blue cell tumors.
4.2 Experimental Results
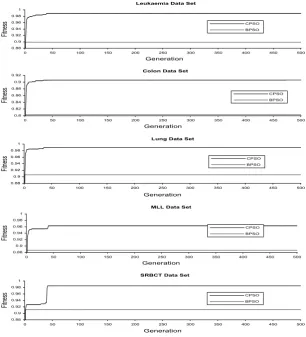
Figure 2 shows that the averages of fitness values of CPSO increase dramatically after a few generations on all the data sets. A high fitness value is obtained by a com-bination between a high classification rate and a small number (subset) of selected genes. The condition of the proposed constraint of elements of particle velocity vec-tors that should always be positive real numbers started in the initialization method, and the new rule for updating particle’s positions provoke the early convergence of CPSO. In contrast, the averages of fitness values of BPSO was no improvement until the last generation due to
P
(
x
id(
t
)
=
0)
=
P
(
x
i
d
(
t
)
=
1)
=
0.5.
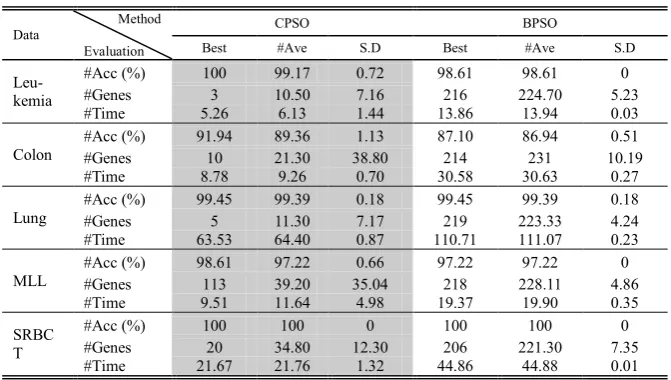
For an objective comparison, CPSO is compared with BPSO. According to the Ta-ble 3, overall, it is worthwhile to mention that the classification accuracy and the number of selected genes of CPSO are superior to BPSO in terms of the best, average, and standard deviation results on all the data sets. The classification accuracies of BPSO and CPSO were same on the lung and SRBCT data sets. However, the number of selected genes of BPSO was higher than CPSO to achieve the same accuracy.
CPSO also produces smaller numbers of genes and lower running times compared to BPSO on all the data sets. CPSO can reduce its running times because of the fol-lowing reasons:
CPSO selects the smaller number of genes compared to BPSO;
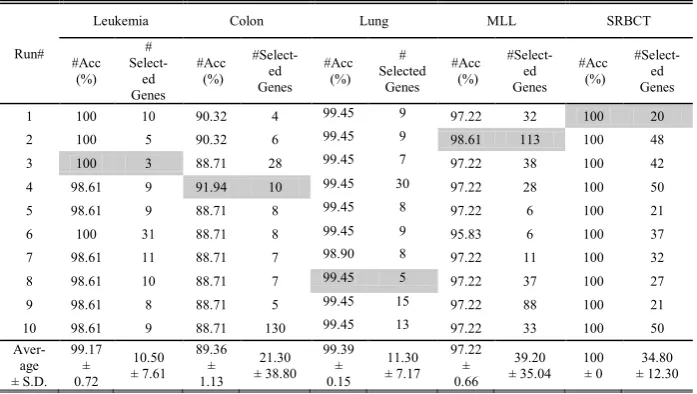
Table 2. Experimental results for each run using CPSO on the leukemia, colon, lung, MLL, and SRBCT data sets
Run#
Leukemia Colon Lung MLL SRBCT
#Acc (%)
#
Select-ed Genes
#Acc (%)
#Select-ed Genes
#Acc (%)
# Selected
Genes #Acc
(%)
#Select-ed Genes
#Acc (%)
#Select-ed Genes
1 100 10 90.32 4 99.45 9 97.22 32 100 20
2 100 5 90.32 6 99.45 9 98.61 113 100 48
3 100 3 88.71 28 99.45 7 97.22 38 100 42
4 98.61 9 91.94 10 99.45 30 97.22 28 100 50
5 98.61 9 88.71 8 99.45 8 97.22 6 100 21
6 100 31 88.71 8 99.45 9 95.83 6 100 37
7 98.61 11 88.71 7 98.90 8 97.22 11 100 32
8 98.61 10 88.71 7 99.45 5 97.22 37 100 27
9 98.61 8 88.71 5 99.45 15 97.22 88 100 21
10 98.61 9 88.71 130 99.45 13 97.22 33 100 50
Aver-age ± S.D.
99.17 ± 0.72
10.50 ± 7.61
89.36 ± 1.13
21.30 ± 38.80
99.39 ± 0.15
11.30 ± 7.17
97.22 ± 0.66
39.20
± 35.04 100 ± 0 ± 12.30 34.80
The computation of SVM is fast because it uses the small number of features (genes) that selected by CPSO for classification process.
We also compare our work with previous related works that used PSO-based methods in their proposed methods [4],[7]-[10]. It is shown in Table 4. For all the data sets, the averages of the number of selected genes of our work were smaller than the previous works. Our work also have resulted the higher averages of classification accuracies on the leukemia and SRBCT data sets compared to the previous works. However, experimental results produced by Shen et al. were better than our work on the colon data set [7]. This is due to the incorporation of tabu search (TS) as a local improvement procedure enables the algorithm HPSOTS to overleap local optima and show satisfactory performance in classifying cancer classes and reducing the number
Lung Data Set
0.88 0.9 0.92 0.94 0.96 0.98 1
0 50 100 150 200 250 300 350 400 450 500
Generation
Fitn
ess CPSO
BPSO
Colon Data Set
0.8 0.82 0.84 0.86 0.88 0.9 0.92
0 50 100 150 200 250 300 350 400 450 500
Generation
Fitn
ess CPSO
BPSO
SRBCT Data Set
0.88 0.9 0.92 0.94 0.96 0.98 1
0 50 100 150 200 250 300 350 400 450 500
Generation
Fitn
ess CPSO
BPSO
MLL Data Set
0.88 0.9 0.92 0.94 0.96 0.98 1
0 50 100 150 200 250 300 350 400 450 500
Generation
Fitn
ess CPSO
BPSO
Leukaemia Data Set
0.88 0.9 0.92 0.94 0.96 0.98 1
0 50 100 150 200 250 300 350 400 450 500
Generation
Fitn
ess CPSO
BPSO
Fig. 2. The relation between the average of fitness values (10 runs on average) and the num-ber of generations for CPSO and BPSO
of genes. Running time between CPSO and the previous works cannot be compared because it was not reported in their articles.
According to Fig. 2 and Tables 2-4, CPSO is reliable for gene selection since it has produced the near-optimal solution from gene expression data. This is due to the pro-posed constraint of elements of particle velocity vectors and the introduced rule in-crease the probability
x
id(
t
+
1)
=
0
(
P
(
x
i
d
(
t
+
1)
=
0))
. The increased probabilityvalue for
x
id(
t
+
1)
=
0
causes the selection of a small number of informative genesand finally produces a near-optimal subset (a small subset of informative genes with high classification accuracy) for cancer classification.
Table 3. Comparative experimental results of CPSO and BPSO
Data Method
Evaluation
CPSO BPSO
Best #Ave S.D Best #Ave S.D
Leu-kemia
#Acc (%) 100 99.17 0.72 98.61 98.61 0
#Genes 3 10.50 7.16 216 224.70 5.23
#Time 5.26 6.13 1.44 13.86 13.94 0.03
Colon
#Acc (%) 91.94 89.36 1.13 87.10 86.94 0.51
#Genes 10 21.30 38.80 214 231 10.19
#Time 8.78 9.26 0.70 30.58 30.63 0.27
Lung #Acc (%) #Genes 99.45 5 99.39 11.30 0.18 7.17 99.45 219 223.33 99.39 0.18 4.24
#Time 63.53 64.40 0.87 110.71 111.07 0.23
MLL
#Acc (%) 98.61 97.22 0.66 97.22 97.22 0
#Genes 113 39.20 35.04 218 228.11 4.86
#Time 9.51 11.64 4.98 19.37 19.90 0.35
SRBC T
#Acc (%) 100 100 0 100 100 0
#Genes 20 34.80 12.30 206 221.30 7.35
#Time 21.67 21.76 1.32 44.86 44.88 0.01
5
Conclusion
Overall, based on the experimental results, the performance of CPSO was superior to BPSO and previous PSO-based methods in terms of classification accuracy and the number of selected genes. CPSO was excellent because the probability
x
id(
t
+
1)
=
0
has been increased by the proposed constraint of elements of particle velocity vectors and the introduced rule. The constraint and rule have been proposed in order to yield a near-optimal subset of genes for better cancer classification. CPSO also obtains lower running times because it selects the small number of genes compared to BPSO. For future works, a modified representation of particle’s positions in PSO will be pro-posed to reduce the number of genes subsets in solution spaces.
Table 4. A Comparison Between Our Method (CPSO) and previous PSO-Based Methods
Data
Method
Evaluation
CPSO PSOTS
[7]
PSOGA
[4]
IBPSO
[8]
TS-BPSO
[9]
BPSO-CGA [10]
Leu-kemia
Average #Acc (%) (99.17) (98.61) (95.10) - - -
Best #Acc (%) 100 - - 100 100 100
Average #Genes (10.50) (7) (21) - - -
Best #Genes 3 - - 1034 2577 300
Colon
Average #Acc (%) (89.36) (93.55) (88.7) - - -
Best #Acc (%) 91.94 - - - - -
Average #Genes (21.30) (8) (16.8) - - -
Best #Genes 10 - - -
Lung
Average #Acc (%) (99.39) - - - - -
Best #Acc (%) 99.45 - - - - -
Average #Genes (11.30) - - - - -
Best #Genes 5 - - - - -
MLL
Average #Acc (%) (97.22) - - - - -
Best #Acc (%) 98.61 - - - - -
Average #Genes (39.20) - - - - -
Best #Genes 113 - - - - -
SRBC T
Average #Acc (%) (100) - - - - -
Best #Acc (%) 100 - - 100 100 100
Average #Genes (34.80) - - - - -
Best #Genes 20 - - 431 1084 880
Acknowledgement
We would like to thank Malaysian Ministry of Science, Technology and Innovation for supporting this research by an e-science research grant (Grant number: 06-01-06-SF1029). This research is also supported by a GUP research grant (Grant number: Q.J130000.2507.04H16) that was sponsored by Universiti Teknologi Malaysia.
References
1. J. Kennedy and R. Eberhart, Particle swarm optimization, Proceedings of the 1995 IEEE International Conference on Neural Networks 4 (1995), 1942-1948.
2. J. Kennedy and R. Eberhart, A discrete binary version of the particle swarm algorithm, Proceedings of the 1997 IEEE International Conference on Systems, Man, and Cybernetics 5 (1997), 4104-4108.
3. S. Knudsen, A Biologist’s Guide to Analysis of DNA Microarray Data, John Wiley & Sons, New York, 2002.
4. S. Li, X. Wu and M. Tan, Gene selection using hybrid particle swarm optimization and genetic algorithm, Soft Comput. 12 (2008), 1039-1048.
5. M. S. Mohamad, S. Omatu, S. Deris, M. F. Misman and M. Yoshioka, Selecting informa-tive genes from gene expression data by using hybrid methods for cancer classification, Int. J. Artif. Life & Rob. 13(2) (2009), 414-417.
6. M. S. Mohamad, S. Omatu, M. Yoshioka and S. Deris, A cyclic hybrid method to select a smaller subset of informative genes for cancer classification, Int. J. Innovative Comput., Inf. & Control 5(8) (2009), 2189-2202.
7. Q. Shen, W. M. Shi and W. Kong, Hybrid particle swarm optimization and tabu search ap-proach for selecting genes for tumor classification using gene expression data, Comput. Biol. & Chem. 32 (2008), 53-60.
8. L. Y. Chuang, H. W. Chang, C. J. Tu and C. H. Yang, Improved binary PSO for feature se-lection using gene expression data, Comput. Biol. & Chem. 32 (2009), 29-38.
9. L. Y. Chuang, C. H. Yang and C. H. Yang, Tabu search and binary particle swarm optimi-zation for feature selection using microarray data, J. Comput. Biol. 16(12) (2009), 1689-1703.