CHARLOTTE-MECKLENBURG STORM WATER SERVICES
Assessment of Polycyclic Aromatic Hydrocarbon Concentrations in
Stream Bed Sediments Adjacent to Coal-Tar Sealcoated Parking Lots
by Olivia Edwards
11/25/2012
Submitted to the Graduate Faculty of
North Carolina State University
In partial fulfillment of the
Requirements for the degree of
Master of Environmental Assessment
1
Table of Contents
Introduction ... 3
History of Research ... 3
Problem Statement ... 4
Goals and Objectives ... 5
Principal Study Question ... 5
Decision Units ... 5
Decision Rules ... 6
Decision Errors ... 6
Sample Collection ... 7
Sample Location ... 7
YWCA (#1) ... 9
Dilworth Edge Condominium (#2) ... 10
Caldwell Commons (#3) ... 11
Duncan Parnell (#4) ... 12
Sun Suites (#5)... 13
Goose Creek (Control site) ... 14
Sampling Methodology and Analysis ... 15
Validation/Assessment (QA/QC) ... 18
Quality Assurance ... 18
Quality Control ... 18
Laboratory ... 19
Results ... 20
Discussion... 24
Recommendations ... 25
Acknowledgements ... 26
2 List of Figures
Figure 1: Sampling Site Locations - Overview
Figure 2: Surface of Sealant Being Scraped with a Flathead Screwdriver Figure 3: Paint Thinner Being Added to the Sealant Sample
Figure 4: Three Possible Color Changes to Determine the Presence of Coal-tar Sealants Figure 5: YWCA Sampling Site Location Map
Figure 6: Dilworth Edge Condo Sampling Site Location Map Figure 7: Caldwell Commons Sampling Site Location Map Figure 8: Duncan Parnell Sampling Site Location Map Figure 9: Sun Suite Sampling Site Location Map Figure 10: Goose Creek Sampling Site Location
Figure 11: Sediment Sampling Technique and Equipment Figure 12: Compositing Sample in Stainless Steel Bowl Figure 13: Placing Composited Sample into Sample Container Figure 14: Collection of Equipment Blank Quality Control Sample
Figure 15: TPAH Concentrations (mg/kg) Above (UpSt) and Below (DnSt) Coal-tar-sealed Parking Lot Discharge Points at 5 Sample Sites.
Figure 16: TPAH Concentrations (mg/kg) Above (UpSt) and Below (DnSt) Coal-tar-sealed Parking Lot Discharge Points at 3 of the 5 Sample Sites. Also Included is the Average Upstream and Downstream TPAH Concentrations.
Figure 17: Individual Analyte Concentration at Dilworth Edge Downstream Sample Site.
List of Tables
Table 1: Summary of Sampling Site Details
Table 2: 10 PAH Parent Compounds and Their Detection Limits. Table 3: Summary of QC samples.
Table 4: Ten Parent PAH Compound Concentrations (µg/kg) in Upstream (UpSt) and Downstream (DnSt) Sediments at 5 Sampling Sites.
3
Introduction
History of Research
Parking lots and driveways are often sprayed or painted with a black, shiny coating that is called sealcoat. The intent of the sealcoat is to improve the pavement appearance and to increase the longevity of the pavement. The two primary sealcoat products that are used for this application are refined coal-tar-pitch emulsion and asphalt emulsion. Coal-tar pitch is the residue remaining after the distillation of crude coal tar which is a byproduct of the coking of coal, and is classified as a Group 1 human carcinogen containing approximately 200 polycyclic aromatic hydrocarbon (PAH) compounds (Scoggins et al., 2007). The majority of coal-tar-based sealcoat products contain 20-35% coal-tar pitch as the binder (Scoggins et al., 2007). The PAH concentrations in coal-tar-based sealcoat are typically 1000 times higher than those in asphalt-based sealcoat (Mahler et al., 2012). One study demonstrated the concentrations of total PAH in scrapings from a coal-tar sealed surface ranged from 9500 to 83000 mg/kg while the concentrations of total PAH in scrapings from an asphalt-based sealed surface ranged from 110 to 1000 mg/kg (Mahler et al., 2005). Once applied, sealcoat does not remain on the pavement surface indefinitely. Instead, tires and snowplows abrade the sealcoat surface into fine dust particles. These abraded dust particles are transported by stormwater runoff from parking lots to stormwater treatment structures or directly to surface waters. One study demonstrated that the concentration of PAHs measured in runoff from parking lots with coal-tar-based sealcoat was, on average, 65 times higher than the concentration in runoff from unsealed lots (Mahler et al., 2012). Because PAH compounds are hydrophobic, they readily absorb onto sediment particles making them primarily available in aquatic systems as particulate contaminants (Scoggins et al., 2007).
In 2000, a study conducted by the U.S. Geological Survey found an increase in PAH concentrations in sediment samples from urban lakes across the United States, while concentrations of other
contaminants like lead, polychlorinated biphenyls (PCBs), and DDT were decreasing. This assessment led researchers to explore potential sources that were contributing to the elevated PAH concentrations. At the forefront of this research effort, the City of Austin, TX, identified elevated PAH concentrations in the bed sediments of tributaries flowing in close proximity to coal-tar sealcoated surfaces. PAHs in the environment are typically a product of incomplete combustion of petroleum, oil, coal, and wood with urban sources that can include industrial emissions and wastes; home heating with fuel oil, wood, and coal; power plants; vehicles; and pavement sealcoat. A study conducted by Van Metre and Mahler (2010) used a chemical mass-balance model to determine source contributions of the elevated PAH concentrations in lake sediments. Results from this study concluded that coal-tar sealcoat is the largest PAH source, and, on average, contributes half of the total PAHs found in surface water sediments (Van Metre & Mahler, 2010).
The deleterious effects of PAHs on aquatic ecosystems have been very well documented. A decrease in both abundance and diversity has been observed in benthic macroinvertebrate communities exposed to high concentrations of PAHs (Bryer et al., 2010). It has also been reported that benthic
4
(Ambystoma maculatum) and newts (Notophthlamus viridescens) exposed to sediment spiked with coal-tar-based sealcoat displayed stunted growth, difficulty swimming or righting themselves, and liver problems (Bommarito et al., 2010a) (Bommarito et al., 2010b). These studies demonstrate that sediment contaminated by coal-tar-based sealcoat contain PAHs at environmentally relevant concentrations that result in adverse affects to amphibians and benthic communities (Mahler et al., 2012).
Previously, researchers have believed that the primary human exposure to PAHs have been through the consumption of foods that contain trace amounts of the contaminants from the smoking, cooking, grilling, roasting, or frying of food at high temperatures (McLure, 2012). New research shows that children from 3 to 5 years old that live by a coal-tar sealed parking lot or driveway are getting a larger dose of PAHs from house dust than from their food. The accumulation of PAHs in house dust can occur when the abraded coal-tar sealant from the parking lot or driveway is tracked into the home (Mahler et al., 2012). It has been reported that PAH concentrations in house dust in residences adjacent to parking lots with coal-tar-based sealant were 25 times higher than in residences adjacent to unsealed asphalt parking lots (Mahler et al., 2010). One study measured the concentration of volatile PAHs four feet above coal-tar sealed parking lots where, in some cases, concentrations exceeded health-protection guidelines recommended by a European Union science panel to protect against cancer (Van Metre, et al., 2012b). It has also been suggested that, nationwide, coal-tar sealed parking lots, driveways, and playgrounds are contributing more PAH contamination to the air than from automobile and truck exhaust (Van Metre, et al., 2012a).
The research that has been conducted thus far provides strong evidence that coal-tar-based sealcoat products have become a significant source of PAHs in the environment. As a result, some actions have been taken to either restrict or ban the use of coal-tar-based sealcoat in the United States. In 2006, the first ban was implemented by the City of Austin, TX. By January 2012, 15 municipalities and two
counties in four states (Minnesota, New York, Texas, and Wisconsin), the District of Columbia, and the State of Washington had passed some type of ban (Mahler et al., 2012). In lieu of an outright ban, some municipalities have developed regulations to restrict the use of coal-tar-based sealcoat. For example, in Boone, NC, a permitting process is required for anyone planning to apply pavement sealant. There is a minimal fee for non-coal tar-based sealants and a much higher fee for coal-tar sealants (Chance, 2011). In Sudbury, Massachusetts, regulation prohibits the use of coal-tar sealants on any new development that would require a general stormwater permit (Coal Tar Free America, 2011).
Problem Statement
5
contamination in stream bed sediments near sealcoated parking lots and then evaluate that data to make local regulatory policy decisions.
Goals and Objectives
Principal Study Question
The principal study question is: Are the concentrations of PAHs downstream from coal-tar based sealcoated parking lots significantly different from upstream locations, and are sediment PAH concentrations at a level above the Probable Effects Concentration (PEC) of 22.8 mg/kg (Scoggins, McClintock, Grosselink, & Bryer, 2007)? The data collected were used to determine whether PAHs from coal-tar-based sealed parking lots were contributing to the accumulation of total PAHs (TPAH) in
receiving waters within Charlotte, NC, and whether the PAH concentrations were at a level that could elicit detrimental impacts to aquatic organisms. The alternative action outcomes included: that the PAH concentrations were not significantly different between up and down stream locations, the
concentrations were below the PEC value, or that the collected data were inconclusive.
Decision Units
6
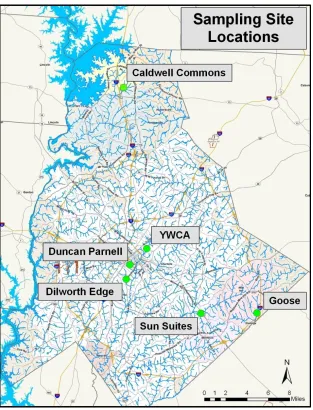
Figure 1: Sampling Site Locations - Overview
Decision Rules
To answer the principal study question, the upstream and downstream total PAH (TPAH) concentrations for each stream segment were compared. If a statistically significant increase in the PAH concentration from the upstream to the downstream sample was observed, then strong evidence existed that PAHs from coal-tar sealed parking lots were contributing to the TPAH concentrations in the receiving waters. If the PAH concentrations were greater than or equal to the PEC, it was concluded that the PAH
concentrations in the bed sediments were at levels that could result in detrimental impacts to the aquatic ecosystem.
Decision Errors
7
greater than or equal to the PEC when they truly were not. A Type II error would occur if it was determined that PAH concentrations from coal-tar-based sealed parking lots were not a contributor to the total PAH concentration in the receiving waters when they truly were. A Type II error would also occur if it was determined that PAH concentrations in the stream sediment were less than the PEC when they truly were.
The consequence of deciding that coal-tar-based sealed parking lots were contributing to the total PAH concentrations in receiving waters when they truly were not means that regulatory action would be taken to limit the use of coal-tar-based sealcoat in Charlotte, NC in an effort to eliminate sources of PAHs to the environment when coal-tar based sealcoat was not actually a contributing source. The same consequence would occur if it was decided that PAH concentrations in the stream sediments were greater than the PEC when they truly were not. The consequence of deciding that coal-tar-based sealed parking lots were not contributing to the total PAH concentrations in receiving waters when they truly were means that no action would be taken to regulate the use of coal-tar-based sealcoat in Charlotte, NC resulting in continued contributions of this PAH source to the total PAH concentrations in receiving water sediments. The same consequence would occur if it was decided that PAH concentrations in the stream sediments were less than the PEC when they truly were greater. It was concluded that both decision errors could have detrimental consequences; therefore, this sampling plan was designed to minimize total study error by utilizing QA/QC measures.
Sample Collection
Sample Location
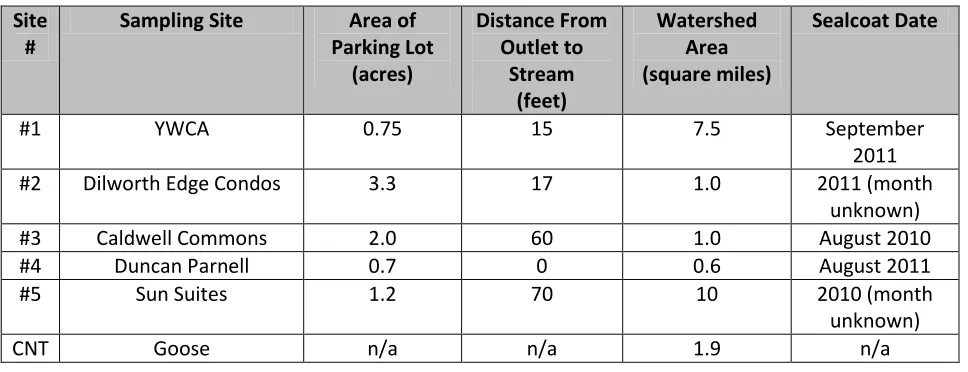
This sampling plan used a judgmental sampling strategy in which sample locations were selected to target stream segments that were adjacent to coal-tar sealed parking lots. Five stream segments in Charlotte, NC, Mecklenburg County were selected and the parking lot discharge point was identified (Figure 1). Parking lots were selected that met the following criteria: adjacent to a stream, a maximum of two stormwater outfalls discharging directly to the stream or through a vegetative buffer, sealed with coal-tar-based sealant, and the parking lot had been sealed within the last two years. Table 1
summarizes the details of each site. Table 1: Summary of Sampling Site Details
Site #
Sampling Site Area of Parking Lot (acres) Distance From Outlet to Stream (feet) Watershed Area (square miles) Sealcoat Date
#1 YWCA 0.75 15 7.5 September
2011
#2 Dilworth Edge Condos 3.3 17 1.0 2011 (month
unknown)
#3 Caldwell Commons 2.0 60 1.0 August 2010
#4 Duncan Parnell 0.7 0 0.6 August 2011
#5 Sun Suites 1.2 70 10 2010 (month
unknown)
8
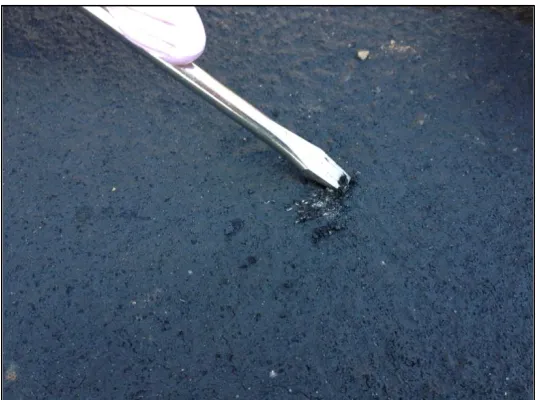
In order to confirm that a parking lot had been sealed with coal-tar-based sealant, a pea-sized amount of sealant was scraped from the lot surface using a flathead screwdriver (see Figure 2).
Figure 2: Surface of Sealant Being Scraped with a Flathead Screwdriver
Figure 3: Paint Thinner Being Added to the Sealant Sample
9
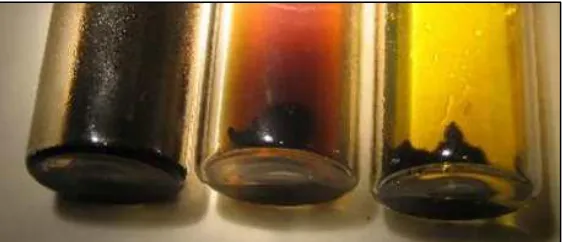
Figure 4: Three Possible Color Changes to Determine the Presence of Coal-tar Sealants
YWCA (#1)
The YWCA parking lot is located at 700 Parkwood Avenue. This parking lot is approximately 0.75 acres, and is commercial in nature. Little Sugar Creek flows adjacent to the parking lot. A single, concrete pipe outfall discharges stormwater from the three sections of parking lot to the stream. The pipe terminates into a rip-rap channel that is approximately 15 feet from the stream bank. This lot was sealcoated in September of 2011. The watershed drainage area to this sampling site along Little Sugar Creek is 7.5 mi2. Figure 5 shows a map of the YWCA sampling site with the upstream and downstream sample locations identified.
10
Dilworth Edge Condominium (#2)
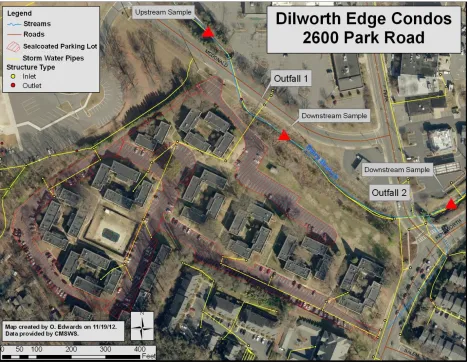
The Dilworth Edge Condominium parking lot is located at 2600 Park Road. The parking lot is
approximately 3.3 acres, and is residential in nature. Dairy Branch flows adjacent to the parking lot. Two concrete pipe outfalls discharge stormwater from the parking lot areas to the stream. The
uppermost pipe terminates into a vegetative buffer that is approximately 17 feet from the stream bank. The lower pipe conveys stormwater off of the parking lot, down Park Road, and discharges directly into the stream under the Park Road culvert. This lot was sealcoated in 2011, but the month was unknown. The watershed drainage area to this sampling site along Dairy Branch is 1.0 mi2. Figure 6 shows a map of the Dilworth Edge Condos sampling site with the upstream and downstream sample locations identified.
11
Caldwell Commons (#3)
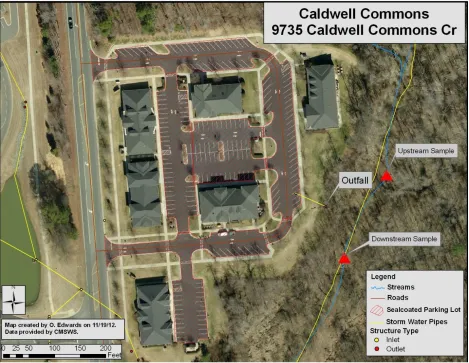
The Caldwell Commons parking lot is located at 9735 Caldwell Commons Circle. The parking lot is approximately 2.0 acres, and is commercial in nature. An unnamed tributary to McDowell Creek flows adjacent to the parking lot. One concrete pipe outfall conveys stormwater from the parking lot to the stream. The pipe terminates into a vegetative buffer that is approximately 60 feet from the stream bank. The receiving stream had very low flow, and was comprised primarily of groundwater flow as confirmed by the presence of copious amounts of iron-oxidizing bacteria. The lot was sealcoated in August 2010. The watershed drainage area to this sampling site along an unnamed tributary to McDowell Creek is 1.0 mi2. Figure 7 shows a map of the Caldwell Commons sampling site with the upstream and downstream sample locations identified.
12
Duncan Parnell (#4)
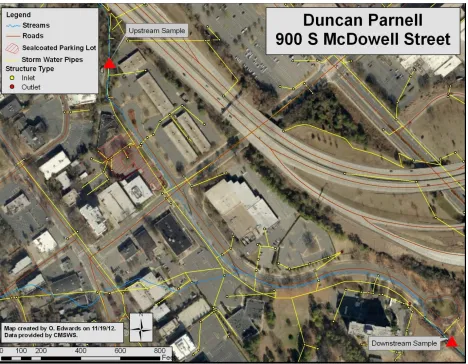
The Duncan Parnell parking lot is located at 900 S McDowell Street. The parking lot is approximately 0.7 acres, and is commercial in nature. An unnamed, piped tributary to Little Sugar Creek flows adjacent to the parking lot. A single concrete pipe outfall conveys stormwater from the parking lot to the stream. The pipe discharges directly into the stream where it is piped. The tributary is an open channel up and downstream of the parking lot, but is piped for approximately 2600 feet. The lot was sealcoated in August 2011. The watershed drainage area to this sampling site along an unnamed tributary to Little Sugar Creek is 0.6 mi2. Figure 8 shows a map of the Duncan Parnell sampling site with the upstream and downstream sample locations identified.
13
Sun Suites (#5)
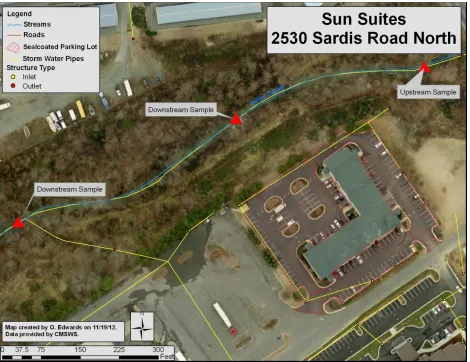
The Sun Suites parking lot is located at 2530 Sardis Road North. The parking lot is approximately 1.2 acres, and is commercial in nature. Irvins Creek flows adjacent to the parking lot. Two concrete pipe outfalls discharge stormwater from the parking lot areas to the stream. The uppermost pipe terminates into a vegetative buffer that is approximately 70 feet from the stream bank. The lower pipe conveys stormwater off of the parking lot into a small tributary that converges with the main stream channel at approximately 200 feet downstream. The lot was sealcoated in 2010, but the month was unknown. The watershed drainage area to this sampling site along Irvins Creek is 10 mi2. Figure 9 shows a map of the Sun Suites sampling site with the upstream and downstream sample locations identified.
14
Goose Creek (Control site)
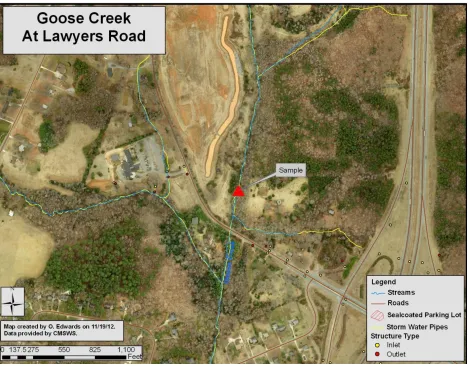
As a background sample site, a composited sediment sample was collected from Goose Creek at Lawyers Road. This watershed has minimal impervious area and development. The watershed drainage area to this sampling site along Goose Creek is 1.9 mi2. Figure 10 shows a map of the Goose Creek sampling site with the sample location identified.
Figure 10: Goose Creek Sampling Site Location
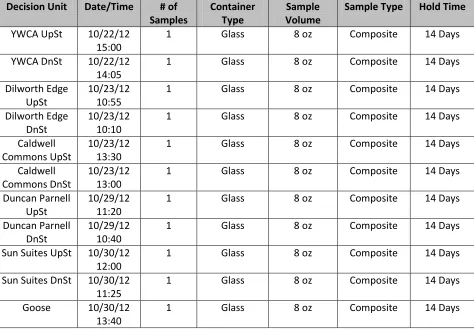
15 Table 2: Sampling Details by Decision Unit
Decision Unit Date/Time # of Samples
Container Type
Sample Volume
Sample Type Hold Time
YWCA UpSt 10/22/12 15:00
1 Glass 8 oz Composite 14 Days
YWCA DnSt 10/22/12 14:05
1 Glass 8 oz Composite 14 Days
Dilworth Edge UpSt
10/23/12 10:55
1 Glass 8 oz Composite 14 Days
Dilworth Edge DnSt
10/23/12 10:10
1 Glass 8 oz Composite 14 Days
Caldwell Commons UpSt
10/23/12 13:30
1 Glass 8 oz Composite 14 Days
Caldwell Commons DnSt
10/23/12 13:00
1 Glass 8 oz Composite 14 Days
Duncan Parnell UpSt
10/29/12 11:20
1 Glass 8 oz Composite 14 Days
Duncan Parnell DnSt
10/29/12 10:40
1 Glass 8 oz Composite 14 Days
Sun Suites UpSt 10/30/12 12:00
1 Glass 8 oz Composite 14 Days
Sun Suites DnSt 10/30/12 11:25
1 Glass 8 oz Composite 14 Days
Goose 10/30/12
13:40
1 Glass 8 oz Composite 14 Days
Sampling Methodology and Analysis
16
Figure 11: Sediment Sampling Technique and Equipment
These samples were composited in a decontaminated stainless steel mixing bowl. The composited sediment was placed in an 8-ounce glass sample container (see Figures 12 and 13).
17
Figure 13: Placing Composited Sample into Sample Container
For sites that had two outfalls, sediment was collected downstream of both outfalls and composited. The upstream sample was collected above both outfalls. All sampling activities were performed in a manner that was consistent with the USGS NAWQA Protocol for Collecting and Processing Stream Bed Sediment Samples (Shelton & Capel, 1994). A composited sample was collected upstream of the parking lot discharge point and downstream of the parking lot discharge point. Samples were stored at 4oC, submitted to the testing laboratory the day of collection, and analyzed by the laboratory within 14 days of collection. All sampling equipment was decontaminated after each composite sample was collected using LiquiNox followed by a DI water rinse.
Sediment samples were analyzed for the 10 parent PAH compounds using gas chromatographic/mass spectrophotometric (GC/MS) techniques in accordance with EPA method 8270D (U.S. Environmental Protection Agency, 2007). Table 2 lists the 10 parent PAH compounds that were analyzed as well as their detection limits. In addition to PAHs, samples were analyzed for total organic carbon (TOC) (EPA Method 5310B). The laboratory instrument calibration and frequency was documented to meet the requirements set forth in the EPA Test Methods for Evaluating Solid Waste, Physical/Chemical Methods publications knows as SW-846 as well as the manufacturer’s operating manuals.
Table 2: 10 PAH Parent Compounds and Their Detection Limits.
Polycyclic Aromatic Hydrocarbons
Detection Limit (µg/kg)
1-Methylnaphthalene 1.5
2-Methylnaphthalene 2.0
Acenaphthene 2.0
Benzo(a)anthracene 0.3
Benzo(a)pyrene 0.5
Benzo(b)fluoranthene 0.8
Benzo(k)fluoranthene 0.2
Dibenzo(a,h)anthracene 0.9
Indeno(1,2,3-cd)pyrene 0.8
18
Validation/Assessment (QA/QC)
Quality Assurance
Field and laboratory data were maintained in a single electronic database. Procedures to evaluate field data generated from this sample plan included the following: checking for transcription errors and review of field logbooks and field data sheets; review of instrument calibration records; adherence with standard operating procedures (SOPs) for sample collection, handling, and preservation; and proper completion of chain-of-custody (COC) forms. Validation of laboratory data was reviewed for the following criteria: presence and completeness of COC and sample receipt forms: correlation of field sample ID to laboratory sample ID; method deviations and QC anomalies; sample holding times; summaries of instrument calibrations; summaries of instrument blanks; method blank contamination; field duplicate values; and laboratory duplicate values. During the review of field and laboratory data no deficiencies were encountered (U.S. Environmental Protection Agency, 2002).
Quality Control
Three types of quality control (QC) samples were included as part of this sampling and analysis plan with the objective being to identify, quantify, and document bias and variability in the data that may have occurred during the collection, processing, shipping, handling, and analysis of samples (U.S. Geological Survey, 2006). Table 3 summarizes the types of QC samples that were collected, the number collected, frequency and how the samples were identified.
Table 3: Summary of QC samples.
Sample Type Collection Sample Number
Duplicate Collected from one downstream
composited sediment sample.
Assigned two separate, unique sample numbers to the field sample and to the duplicate sample.
Field Blank Collected one sample per day of sampling.
Filled 500 mL sample container with DI water at beginning of sampling event.
Assigned separate sample numbers to the field blanks.
Equipment Blank Collected one sample per day of sampling.
Following decontamination of the sampling equipment, collected sample by running DI water over the clean pieces of equipment filling a 500 mL sample container with the DI rinse water.
Assigned separate sample numbers to the equipment blanks.
19
equipment filling a 500 mL amber, glass bottle. Figure 14 illustrates how the equipment blank sample was collected.
Figure 14: Collection of Equipment Blank Quality Control Sample
In addition to the QC samples summarized in Table 3, laboratory QC methods included surrogate spike compounds, blank spikes, and lab duplicate samples for each batch analyses (Watts, Ballestero, Roseen, & Houle, 2010). Matrix spike and matrix spike duplicate analyses were not performed due to insufficient sample volume. Sediment samples were sent to a contract laboratory for extended PAH analyses by gas chromatograph/mass spectrometry Selective Ion Monitoring (GC/MS SIMs) to provide lower detection limits. Samples were prepared by solvent extraction (EPA Method 3570) and analyzed by GC/MS/SIMS (EPA Method 8270D) with internal standards. Any samples which exceeded the calibration range for the instrument were diluted and reanalyzed, and all solids were reported as dry weight concentrations. Laboratory quality control measures were included with each batch analyses. One field duplicate sediment sample was collected which had a relative percent deviation (RPD) of 44.5%. Four field blank samples were collected. Of these, a low concentration of benzo(a)anthracene was detected (0.014 µg/L) which exceeded the detection limit but was less than the reporting limit. Three equipment blank samples were collected. Two of these samples had low concentrations of benzo(a)anthracene and benzo(a)pyrene, 0.016 µg/L and 0.014 µg/L. Again, these concentrations exceeded the detection limit but were less than the reporting limit.
Laboratory
20
Samples for TOC analysis were subcontracted to Gulf Coast Analytical Labs located at 7979 GSRI Avenue, Baton Rouge, LA (NC Certification # 618).
Results
The sediment samples that were collected for this study were submitted to the analytical lab for analysis of 17 PAH parent compounds. The lab only quantified and reported results for 10 PAH parent
compounds although the 17 compounds were analyzed. Consequently, the TPAH concentrations presented in this study only include the quantified and reported compounds which make it difficult to perform a comparative assessment with TPAH data collected from other studies where the 17 PAH parent compounds were included.
TPAH concentrations were slightly higher at downstream than upstream sites in 3 of the 5 sample locations (see Table 4, Figure 15) which included the YWCA, Dilworth Edge, and Caldwell Commons sites. Two of the 5 sample sites had upstream TPAH concentrations that were greater than the downstream concentrations. These sample sites were the Duncan Parnell and Sun Suites locations. At both the Duncan Parnell and Sun Suites sites, the upstream sampling location was in close proximity to I-277 and I-74, respectively. Both of these highways are heavily traveled so the atmospheric deposition and runoff during rain events of PAHs from automobile and truck exhausts could be a plausible and significant contributor to the elevated PAH concentrations in the upstream sediments. Analytical results for the background sediment sample collected at Goose Creek showed no detection of any PAH parent compounds.
Table 4: Ten Parent PAH Compound Concentrations (µg/kg) in Upstream (UpSt) and Downstream (DnSt) Sediments at 5 Sampling Sites.
PAH Parent Compound
YWCA Dilworth Edge Caldwell Commons
Duncan Parnell Sun Suites
UpSt DnSt UpSt DnSt UpSt DnSt UpSt DnSt UpSt DnSt
1-Methylnaphthalene nd 4.1 nd 2.3 nd nd 27 40 nd nd
2-Methylnaphthalene nd 6.1 2.2 2.9 nd nd 32 40 nd nd
Acenaphthene 2.7 5.9 4.9 8.2 nd nd 400 130 nd nd
Benzo(a)anthracene 66 170 230 470 3.3 53 8400 3800 440 180
Benzo(a)pyrene 57 140 160 380 3 55 7400 2900 400 170
Benzo(b)fluoranthene 120 290 280 710 6.8 120 11000 5100 540 260
Benzo(k)fluoranthene 29 90 78 170 1.7 30 2700 1400 160 71
Dibenzo(a,h)anthracene 15 38 34 82 nd 12 800 300 73 31
Indeno(1,2,3-cd)pyrene 65 180 160 400 3.2 59 2700 1500 400 150
Naphthalene nd 5.3 2.2 8.3 nd nd 25 38 nd nd
21
Figure 15: TPAH Concentrations (mg/kg) Above (UpSt) and Below (DnSt) Coal-tar-sealed Parking Lot Discharge Points at 5 Sample Sites.
22
Figure 16: TPAH Concentrations (mg/kg) Above (UpSt) and Below (DnSt) Coal-tar-sealed Parking Lot Discharge Points at 3 of the 5 Sample Sites. Also Included is the Average Upstream and Downstream TPAH Concentrations.
23
Figure 17: Individual Analyte Concentration at Dilworth Edge Downstream Sample Site.
Total Organic Carbon (TOC) values were used to normalize the amount of contaminant per kg of organic carbon because TOC can be a good proxy for estimating organic contaminants associated with fine sediment. In this calculation, the mg of TOC per kg sediment dry weight was converted to kg of TOC per
kg sediment dry weight. This value is referred to as the Fraction Organic Carbon (foc). The PAH
concentration for each parent compound was divided by the corresponding foc value to give a
normalized PAH concentration in µg/kg of organic carbon (Division of Surface Water Standards and Technical Support Section, 2010). Then, these normalized concentrations were added together for each sampling site to provide a normalized TPAH value in µg/kg of organic carbon. See table 5 for a complete summary of this data. The Total Organic Carbon (TOC) values ranged from 575 mg/kg or 0.0575% at the YWCA upstream sample site to 13500 mg/kg or 1.35% at the Sun Suites downstream sample site. To note, a higher sand content in a sample will result in a lower TOC content (Kemble, Ingersoll, & Kunz,
2002). Normalized TPAH values ranged from 97.8 µg/kgoc at the Caldwell Commons upstream sampling
24
Table 5: Total Organic Carbon Results Summary, fraction organic carbon, and TPAH normalized with TOC.
Sampling Site TOC (mg/kg) foc Normalized TPAH
(µg/kgoc)
YWCA UpSt 575 0.0575 6168.7
YWCA DnSt 3470 0.347 2666.6
Dilworth Edge UpSt 2900 0.29 3280.3
Dilworth Edge DnSt 4450 0.445 5019.6
Caldwell Commons UpSt 1840 0.184 97.8
Caldwell Commons DnSt 2040 0.204 1612.7
Duncan Parnell UpSt 6240 0.624 53660.3
Duncan Parnell DnSt 8370 0.837 18217.4
Sun Suites UpSt 6250 0.625 3220.8
Sun Suites DnSt 13500 1.35 638.5
Discussion
Three out of the 5 sample sites did show an increase in TPAH concentrations from the upstream to the downstream sample locations. It can be concluded that at these specific locations, the coal-tar sealed parking lots did contribute to the load of PAHs in the stream sediments. Because this was such a small sample size and two of the sample sites showed a decrease in the TPAH concentrations downstream of the sealed parking lot, this study cannot confidently state that PAHs originating from coal-tar-sealed parking lots significantly contribute to the concentrations found in stream sediments at all sites. It can be stated that one stream did have a TPAH concentration that was greater than the Probable Effects Concentration. The PAH concentrations in the sediment at this stream reach were at levels where negative impacts to aquatic organisms would be expected. To confirm this, an assessment of the aquatic community would need to be performed, as well as continued chemical and biological monitoring.
The Caldwell Commons sample site had the lowest TPAH concentrations at the upstream and
downstream sample locations, 0.02 and 0.33 mg/kg, respectively. This watershed is more rural than the other sites with less impervious area and vehicular traffic. Because there was minimal upland sources contributing to the PAH load in the stream sediment at this site, it can be surmised that any increase in PAH concentrations below the parking lot outfall discharge point were a direct result of elevated PAHs from the coal-tar sealant and not from other common urban runoff sources, such as roads and
atmospheric deposition. Interestingly, although this site had the lowest concentrations, the downstream TPAH concentration was 16 times greater than the upstream concentration. This is substantial when compared to the other downstream sites that, on average, increased by 2.5 times the upstream concentrations.
25
Charlotte. Because of this, the number of potential sources of PAHs at this location is much greater than the other sites; and, therefore, PAH concentrations would be expected to be higher.
Normalizing the TPAH concentrations using the TOC values had no effect on the study outcome except for the YWCA sampling site. Using the actual TPAH concentrations, the downstream site had a higher concentration then the upstream site, 929.4 µg/kg and 354.7 µg/kg, respectively. However, a
comparison of the normalized TPAH concentrations at this sample location showed a decrease in concentration from the upstream to the downstream site, 6168.7µg/kgoc and 2666.6 µg/kgoc,
respectively. The percentage of TOC at the upstream site was much lower than the percentage at the downstream site. This result indicates that there was potentially more PAH load upstream than downstream. This observation could be better explained if a particle size distribution had been
assessed. If particle sizes were fractioned out, PAH analysis could be conducted on the various particle sizes. Then, an evaluation of PAH adherence to particle size could be performed thus explaining how TOC content impacts PAH concentrations.
Due to the extensive criteria for sample site selection, identifying suitable locations was arduous. Ideally, parking lots that had been sealed within the last six months would have been selected. In order to meet all of the criteria, this was not the case, and all of the parking lots that were sampled had been sealed over a year ago. One previous study determined that the highest concentrations of PAHs coming from a coal-tar sealed parking lot occur in the first three months following application showing a
decreasing trend in the subsequent months (Watts et al., 2010). This is relevant to this study because higher concentrations of PAHs transported during storm events in the first three months after the parking lot was sealed would likely result in higher concentrations of PAHs being deposited in the receiving stream sediments. Over time, these sediment-bound PAHs would be transported and deposited further downstream. As was previously discussed, downstream sediment samples in this study were collected over a 100 foot stream reach below the outfall discharge point. With the age of the sealant on the parking lots that were sampled, higher concentrations of PAHs from the parking lots have likely been transported well downstream of the sampling zone.
Recommendations
26
Acknowledgements
I would like to thank Dr. Waverly Thorsen and Linda Taylor for their guidance and support throughout this process. A special thank you to John McCulloch for encouraging me to pursue this topic following my investigation of that first fish kill. My sample collection could not have occurred without the help of my co-workers, Andrew Martin, Ryan Spidel, Alex Hattaway, and Dave Ferguson. Thanks are also due to Craig Miller and Jason Hunt who provided many helpful review comments on this paper. Finally, thank you to my husband, Chad Edwards, who has supported me and kept me sane throughout my pursuit of this degree.
References
Bommarito, T., Sparling, D. W., & Halbrook, R. S. (2010a). Toxicity of Coal-tar Pavement Sealants and Ultraviolet Radiation to Ambystoma maculatum. Ecotoxicology 19, 1147-1156.
Bommarito, T., Sparling, D. W., & Halbrook, R. S. (2010b). Toxicity of Coal-tar and Asphalt Sealants to Eastern Newts, Notophthalmus viridescens. Chemosphere 81, 187-193.
Bryer, P. J., Elliott, J. N., & Willingham, E. J. (2006). The Effects of Coal Tar Based Pavement Sealer on Amphibian Development and Metamorphois. Ecotoxicology 15, 241-247.
Bryer, P. J., Scoggins, M., & McClintock, N. L. (2010). Coal-tar Based Pavement Sealant Toxicity to Freshwater Macroinvertebrates. Environmental Pollution 158, 1932-1937.
Chance, E. (2011, February 16). Boone Limits Coal Tar Sealants-Fish and River Lovers Celebrate. Retrieved November 23, 2012, from Appalachian Voices:
http://appvoices.org/2011/02/16/boone-limits-coal-tar-sealants-fish-and-river-lovers-celebrate/ Coal Tar Free America. (2010, October 31). Field Test for Coal Tar Sealant Determination. Retrieved
October 9, 2012, from Coal Tar Free America:
http://coaltarfreeamerica.blogspot.com/2010/12/field-test-for-coal-tar-sealant.html Coal Tar Free America. (2011, April 2). Wicked Wetland Regs Limit Coal Tar Sealants. Retrieved
November 20, 2012, from Coal Tar Free America:
http://coaltarfreeamerica.blogspot.com/2011/04/wicked-wetland-regs-limit-coal-tar.html Division of Surface Water Standards and Technical Support Section. (2010). Guidance on Evaluating
Sediment Contaminant Results. Ohio Environmental Protection Agency Division of Surface Water.
27
Environment and Natural Resources. Columbia, MO: Columbia Environmental Research Center Biological Resources Division USGS.
Mahler, B. J., Van Metre, P. C., Bashara, T. J., Wilson, J. T., & Johns, D. A. (2005). Parking Lot Sealcoat: An Unrecognized Source of Urban Polycyclic Aromatic Hydrocarbons. Environmental Sciene & Technology/Vol. 39, No. 15, 5560-5566.
Mahler, B. J., Van Metre, P. C., Crane, J. L., Watts, A. W., Scoggins, M., & Williams, E. S. (2012). Coal-Tar-Based Pavement Sealcoat and PAHs: Implications for the Environment, Human Health, and Stormwater Management. Environmental Sciance & Technology 46, 3039-3045.
Mahler, B. J., Van Metre, P. C., Wilson, J. T., & Musgrove, M. (2010). Coal-Tar-Based Parking Lot Sealcoat: An Unrecognized Source of PAH to Settled House Dust. Environmental Science & Tehchnology. Vol. 44, No. 3, 894-900.
McLure, R. (2012, February 17). Studies: Health Risk From Toxic Pavement Sealant Greater than Previously Believed. Retrieved February 17, 2012, from Open Channel on NBC News:
http://openchannel.nbcnews.com/_news/2012/02/17/10428845-studies-health-risk-from-toxic-
pavement-sealant-greater-than-previously-believed?lite#__utma=238145375.1469468595.1343179844.1343179844.1353711620.2&__ut mb=238145375.3.10.1353711620&__utmc=238145375
Scoggins, M., McClintock, N. L., Grosselink, L., & Bryer, P. (2007). Occurence of Polycyclic Aromatic Hydrocarbons below Coal-Tar-Sealed Parking Lots and Effects on Stream Benthic
Macroinvertebrate Communities. Journal of the North American Benthological Society Volumer 26, 694-707.
Shelton, L. R., & Capel, P. D. (1994). Guidelines for Collecting and Processing Samples of Stream Bed Sediment for Analysis of Trace Elements and Organic Contaminants for the National Water-Quality Assessment Program. Sacramento, California: U.S. Geological Survey.
U.S. Environmental Protection Agency. (2002). Guidance on Environmental Data Verification and Data Validation EPA QA/G-8. Washington, DC: Office of Environmental Information.
U.S. Environmental Protection Agency. (2007). Method 8270D Semivolatile Organic Compounds by Gas Chromatography/Mass Spectrometry (GC/MS). U.S. Environmental Protection Agency.
U.S. Geological Survey. (2006). Collection of Water Samples, Version 2.0. U.S. Geological Survey. Van Metre, P. C., & Mahler, B. J. (2010). Contribution of PAHs from Coal-tar Pavement Sealcoat and
Other Sources to 40 U.S. Lakes. Science of the Total Environment 409, 334-344.
28
Van Metre, P. C., Majewski, M. S., Mahler, B. J., Foreman, W. T., Braun, C. L., Wilson, J. T., et al. (2012b). Volatilization of Polycyclic Aromatic Hydrocarbons from Coal-tar-sealed Pavement.
Chemosphere.