ABSTRACT
KALMAR, KIMBERLY JEAN. Caregiver Wellbeing & Household Composition. (Under the direction of Maxine Thompson.)
Formal caregiving is simply unaffordable for some families. Consequently, a significant portion of people with disabilities are cared for at home by relatives and friends.
CAREGIVER WELLBEING & HOUSEHOLD COMPOSITION
by
KIMBERLY JEAN KALMAR
A thesis submitted to the Graduate Faculty of North Carolina State University
in partial fulfillment of the requirements for the Degree of
Master of Science
SOCIOLOGY
Raleigh, North Carolina 2007
APPROVED BY:
_________________________ _________________________
Edward Kick Feinian Chen
________________________________ Maxine Thompson
BIOGRAPHY
ACKNOWLEDGEMENT
C. METHOD OF ANALYSIS. . . 4. RESULTS . . . 5. DISCUSSION . . . . . . . 6. IMPLICATIONS FOR POLICY & FUTURE RESEARCH . . . 7. REFERENCES . . .
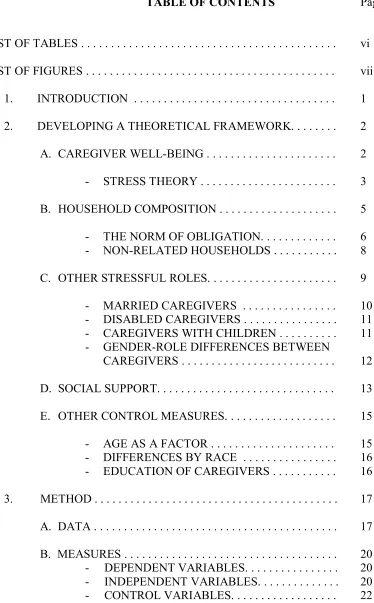
LIST OF TABLES
Table 1 Caregiver Descriptive Statistics. . . Table 2 OLS Regression of Life Satisfaction on Household Structure,
Stressful Life Roles, Social Support, & Demographics. . . Table 3 OLS Regression of Depression on Household Structure,
Stressful Life Roles, Social Support, & Demographics. . . Table 4 OLS Regression of Subjective Health on Household Structure,
Stressful Life Roles, Social Support, & Demographics. . .
Page 19
24
27
LIST OF FIGURES
Figure 1 A Modified Stress Process Model for Caregiving . . .
Introduction
There are numerous reasons that people require part or fulltime caregiving: hereditary
genetic defects, Alzheimer’s disease, dementia, etc. As technology extends the average life
span to over 70 years, it is important that research on caregiving identify potential problems
and obstacles to adequate care. Furthermore, because the cost of formal caregiving is
prohibitive for some families, a significant portion of people with disabilities are cared for in
the home by relatives or friends. As a consequence, it is particularly important to identify the
implications of household structure on caregiving. Does it matter how many people live in
the household or who lives there? This study will examine these and other factors, like
household composition and stressful life roles, on caregiver wellbeing.
Previous literature has made substantial strides defining avenues to caregiving,
characteristics of caregivers, and theories about caregiver wellbeing or caregiver burden
(Aneshesel et al., 1995; Covinsky et al., 2003; Hoyert & Seltzer, 1992; Lewis, 1998;
Tornatore & Grant, 2002). Less attention has been paid to the influence of household
composition or household context on caregiver wellbeing (see Hughes & Waite, 2002 for
the exception). I contend that the absence of research in this area leaves a void in the
caregiving literature. This research project hopes to provide some insight on the importance
of household living arrangements for caregiver wellbeing by examining different aspects of
household structure, namely household composition and number of available adults in the
household, in concert with ongoing stressful roles and social supports. In the following
section, the association between caregiving and household composition is discussed within
the stress process theoretical framework. In this section, particular attention is paid to how
the norm of obligation among family members might shape the interactions among members
National Survey of Families and Households (NSFH), Wave II (19921994), I examine the
specific effects of household structure on burden of caregiving for adults occupying multiple
roles. This study concludes by making some inferences for future research of caregiver well
being and offers implications for public policy.
Developing a Theoretical Framework
Caregiver Wellbeing.
Different components of caregiver wellbeing are examined across various literatures
including but not limited to research on aging and mental illness. Overwhelmingly, research
indicates that the caregiving role has detrimental effects on caregiver wellbeing. Caregivers
may experience psychological distress, also known as burden, and/ or physical health issues
(Hoyert & Seltzer, 1992; Hughes & Waite, 2002; Kramer, 1993; Thoits, 1999). For example,
Kosmala et al. (1999) found a correlation between Alzheimer’s caregivers with high
depression and high burden scores. Several researchers conclude that a major, resultant factor
of stressors is often depression or depressive symptoms (Hoyert & Seltzer, 1992; Kramer,
1993; Pratt et al., 1985; Thoits, 1999).
Health of caregivers, as noted, is often affected as well. Pratt et al. (1985) report the
experience of caring for persons with Alzheimer’s disease was significantly related to self
reported health in respondents. Caregivers who rated their health as good or excellent had
lower burden scores than those who did not rate their health as positive (Pratt et al., 1985:29).
Research also suggests that poor physical health is positively related to depression (Covinsky
et al., 2003; Kosloski et al. 1999). Pratt et al. (1995) confirms this idea suggesting that well
being scores are significantly related to the health of the caregiver, and those in better health
reported increased wellbeing. In addition, when Faison, Faria, and Frank (1999) studied 88
caregivers dropped from averages prior to the time they became caregivers. According to
research of caregiver/ care recipient Alzheimer dyads, female caregivers of Alzheimer’s
patients were particularly susceptible to increased levels of stress and health problems
(Kosmala & Kloszewska, 2004). Health is also predicted to decline for caregivers of persons
with mental illness, according to Covinsky et al. (2003) who studied 5,627 caregiver/ care
recipient dyads at eight different locations across the U.S. In this study, I examine multiple
dimensions of psychological and physical, caregiver wellbeing including life satisfaction,
depression and physical health.
Stress Theory.
The stress process theory, originally defined by Pearlin and colleagues (1981) and the
guiding framework for this research, contends that environmental demands (i.e. stressors)
have negative impacts on psychological wellbeing and health (Thoits, 1999: 346). Stress is a
lack of fit between environmental demands and individual resources and can be mentally,
emotionally, or physically taxing (Aneshensel et al., 1995). For example, caregivers often
experience social isolation, lack of time for oneself, family and friends, career interruptions,
financial drain, and heavy physical burdens (Pratt et al., 1995: 27). In other words, stressors
coalesce to overwhelm the person’s coping abilities and, therefore, produce psychological
distress or, in severe cases, mental disorder. This is not to imply that all caregivers have or
will experience mental illness. Other manifestations of stress can include but are not
exclusive to: anxiety, sleeplessness, fear, worry, anger, frustration, and physical illness
(Kramer, 1993; Pratt et al., 1985; Thoits, 1999). The ways in which individuals cope depends
on available resources and the types of stressors encountered (Kramer, 1993). Without
appropriate coping resources, stressors can influence caregivers’ physical or mental well
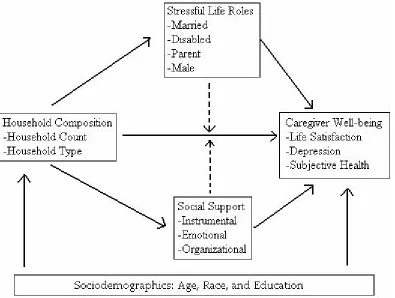
A modified stress process model for caregiving is illustrated in Figure 1. This model takes
as a starting point that caregiving is a stressful role and examines the interrelationship among
different types of stressors for caregivers. Traditionally, the stress process model does not
explicitly include household structure. Household structure as a stressor is one modification
of the traditional stress theoretical framework in Figure 1. It has a direct influence on
caregiver wellbeing. Household structure matters because it signals the potential for
caregiver integration and interaction with others. Following the norm of obligation within
families, it is argued that some interactions within households are more negatively impacted
by the caregiving experience, like those between spouses or parent and children.
Next, caregiving often occurs in the context of other ongoing roles or relationships which
is another source of stress. Stress theory argues that caregiving contributes to a proliferation
of stressful roles (Aneshensel et al., 1995). It is the compilation of stressors that predict
caregiver wellbeing. Therefore, I suggest that the presence of other stressful roles may
moderate the influence of household context on caregiver wellbeing as well as have a direct
impact on caregiver wellbeing. The model also expresses a moderating effect of social
support, which can temper the effects of stressors. Social supports or social resources may
moderate or buffer the influence of household context on caregiver wellbeing. The model
considers the social context of caregiving by controlling for social characteristics such as
race, age and education as well. A conceptual rationale for the importance of household
composition and other social factors in the model is discussed in the following section.
Household Composition.
A large portion of caregiving is done within the household, but household composition is
often overlooked by caregiving research (Hoyert & Seltzer, 1992). Household composition
a central structure whose members in number and identity provide social integration and
social support for each other. Further, they hypothesize that “individuals experience role
based household relations as sets of resources and demands” and, depending on the structure,
individuals are more or less likely to perceive that the demands do or do not outweigh the
resources available (Hughes & Waite, 2002: 1). In other words, different types of households
have different amounts and kinds of resources available to them. Singleparent households,
for example, may not have the same amount of financial resources available to them as
spouse/ partner type households. The addition of a spouse or partner may also decrease
stress. For example, if the caregiver has someone she or he can rely on for emotional and/ or
physical health, like a spouse or partner, their presence may decrease the stress of caregiving.
Although some may suggest that caregiver wellbeing has more to do with the
responsibilities of care than actually living within the same household (Reinhard &
Horowitz, 1995), the argument presented here is that household membership is an integral
part of interpreting and predicting caregiver wellbeing. Note that this definition does not
require household members to be related. However, because relationship ties imply various
strengths in normative expectations of commitment and caring, they are important to discuss.
The Norm of Obligation.
Aneshensel et al. (1995) and Himes & Reidy (2000) note that there is a developed
hierarchy in caregiver preference. People in need will turn, first, to spouses for aid, then to
adult children, and then to other relatives. If all else fails, they will resort to asking friends for
assistance. Spouses are obligated to care for one another within the context of marriage, “in
sickness and in health,” while children rationalize caregiving in terms of reciprocating for
previous care (Albert, 1990); and, parents rationalize caregiving as part of parental
perception of responsibility to care for its members. This theory is referred to as the norm of
obligation (Albert, 1990; Ganong & Coleman, 1998).
Rossi & Rossi (1990) explain that kin norms are culturally defined rights and duties that
specify the ways in which any pair of related persons is expected to behave toward one
another. For those who research filial responsibilities to elderly divorced parents and
stepparents, “family obligations function as parameters within which individuals define and
negotiate their responsibilities (Ganong & Coleman, 1998: 272).” Under what circumstances
is one obligated to care? To whom is one obligated to care? Filial obligation is often seen as a
moral duty that must be performed in order to consider oneself a “good” person (Ganong &
Coleman, 1998; Rossi & Rossi, 1990).
Piercy (1998) finds that caregiving responses are determined by these definitions of
responsibility. Specifically, Piercy (1998) found that families identified three particular
obligations, one of which is environmental quality. Environmental quality in this instance
refers to the household climate. In other words, families were responsible not only for
providing a safe, comfortable environment, but they were also responsible for attending to
emotional, physical, and social needs of members. Additionally, she found that sharing
responsibility of care was a significant principle for all families of her study, regardless of
whether they actually shared the burden or not. It follows that social expectations to provide
care may increase stress.
Caregiving can also equate to a social exchange. In fact, a lot of caregivers see themselves
as performing a reciprocal role (Belgrave et al., 2004; Ganong & Coleman, 1998; Karp,
2001; Lewis, 1998). Ganong & Coleman (1998) refer to this as the norm of reciprocity.
Husband caregivers who have this perception frequently feel they are giving something back
even if reciprocal, are associated with high levels of depression among caregivers. For
example, according to Kosloski et al. (1999), who studied depression among caregivers of
Alzheimer’s patients, as perceived expectations of family obligations increased so did
depressive symptoms.
Moreover, most societies have some form of socially accepted norms or rules that
preclude who is notobligated for certain familial responsibilities. For example, Kosloski et
al. (1999), Piercy (1998), and Rossi & Rossi (1990) denote that there may be exceptions to
one’s responsibility to the family, such as in the case of illness, decreased mental capacity or
health, employment, special occasions, lack of available time and money, or settings in
which family members live long distances away. In other words, extenuating circumstances
preclude that not everyone experiences the obligation to care in the same way.
NonRelated Households.
Nonfamilial relationships have an entirely different connotation of reciprocity and
obligation according to family researchers (Himes & Reidy, 2000; Rossi & Rossi, 1990).
People are taught to distinguish between kin and nonkin from a young age. For example,
children are often obligated to attend birthday parties for family members, but they may miss
out on the birthdays of friends. In other words, children are taught that friends and family do
not hold the same status. Several authors argue, however, that while friends may not feel
completely unobligated to care for one another, when times are hard and money is tight,
friendship does not incur the same level of obligation as a relative (Ganong & Coleman,
1998; Himes & Reidy, 2000; Rossi & Rossi, 1990). In order for friends to take on this role,
they must determine that the benefits of the friendship outweigh the costs. After all,
While family may be no more equipped than friends to handle caregiving tasks, family
may be nonetheless more obligated. This norm of obligation denotes that household
compositions in which members share relational ties should be more compelled to perform
caregiving functions than those household which do not share a family bond. Because social
bonds and the norm of obligation are stronger among family members, the following
hypothesis is examined:
Hypothesis 1a: Caregivers who live in households with other family members will have more
positive psychological and physical wellbeing outcomes than caregivers who live with
unrelated persons.
In addition to the composition of relationships within households, number of persons in
the household is likely to influence caregiver wellbeing. Number of persons living in a
household may influence caregiver wellbeing in several ways. For one, it may follow that
more people in the household means caregiving tasks as well as domestic and financial
responsibilities will be more evenly distributed among residing members. Therefore, burden
for the caregiver may decrease when the number of people in the household increases. In this
analysis, we examine the hypothesis that:
Hypothesis 1b: As the number of persons within the household increases, caregivers will
have more positive psychological and physical wellbeing outcomes.
Other Stressful Roles.
Caregiving is a complex role but is often not the only role held by the caregiver at any
given time. Aneshensel et al. (1995) argue that individuals are not simply caregivers, but
more often than not, they occupy a number of competing roles simultaneously. The scarcity
hypothesis denotes that a person does not have enough resources to adequately fulfill several
between roles can result in the division of the caregiver’s attention from other relatives as the
patient continues to deteriorate, especially in cases of Alzheimer’s, muscular dystrophy,
multiple sclerosis and the like. When a caregiver must shift his/her priorities to the care
recipient, it may mean that other members of the household are not happy with the
delegation.
In addition, the roles of caregivers may become confused when the person is not sure with
which identity she or he should primarily ascribe to her/himself (Lewis, 1998). Most
caregivers are spouses or children of the care recipient(s) (Hoyert & Seltzer, 1992; Kramer,
1993; Pratt et al., 1985; Reinhard & Horowitz, 1995; Ward & Spitze, 1998). The priority that
caregivers give to social roles is not always clear. Should they be daughters first and
caregivers second? Should they be caregivers first and spouses second? This study examines
the influence of household structure in the context of other competing roles. Specifically, this
research examines the influence of marriage, disability, parenting, and gender.
Married Caregivers.
Literature also indicates that marital status plays an integral role in caregiver wellbeing.
According to Hughes & Waite (2002), married persons usually have better health than
widowed, separated or unmarried persons. Marriage benefits health because marriedcouple
households typically have more economic resources than singleparent households (Hughes
& Waite, 2002). For spouses, researchers note, the idea of caring is part of the marriage
contract; therefore, it is unproblematic (Hoyert & Seltzer, 1992; Lewis, 1998). Lewis (1998),
who studied nine elderly, married couples wherein one spouse suffered from dementia,
argues that caregiving spouses must distance themselves from the deterioration of the other’s
mental state. For example, caregivers can rationalize the behavior of their spouses and the
Lewis (1998) contends that caregivers must seek motivation for care from previous memories
of the relationship. Further, some argue that spousal caregivers may be at increased risk for
depression due to a loss of the intimate connection shared by the caregiver and care recipient
(Covinsky et al., 2003). In other words, while commitment or obligation to caregiving may
not be the issue for married couples, role conflict certainly is an issue.
Disabled Caregivers.
Having a disability presents another distinctly challenging role for caregivers. Considering
that a large portion of caregivers for the elderly are spouses or adult children, it is important
to consider disabilities. As Baines (1984) & Mui (1995) note, at least half of caregiving for
older adults is provided by spouses who are themselves old and vulnerable to disease.
Because the nature of caregiving is most often a physical task, caregivers who are disabled
may have extra obstacles to overcome. Caregivers with moderate disabilities may have
limitations regarding their physical ability to care for others (Kim & Keshian, 1994).
Therefore, stress of caregiving is likely to further erode already moderate or poor health.
Poor health has also been equated with increased symptoms of depression (Kosloski et al.,
1999). Kosloski et al. (1999: 374) note that “chronic and acute health conditions represent
important vulnerability factors with respect to depression.” Elderly wives, for example,
reported lower scores of wellbeing than adult children (Hoyert & Seltzer, 1992).
Additionally, Baines (1984), in the study of caregivers of older adults, states that only 10% of
her study reported their health as excellent. However, even if caregivers are ablebodied, they
may be disadvantaged in other ways. For example, consider caregivers who are parents.
Caregivers with Children.
Every parent wishes the occupation came with a manual for pottytraining, the terrible
much of the time. While we know that all parents who are caregivers may not necessarily be
caring for children alone, caregiving while parenting can still be taxing. In some cases, stress
associated with caring for other relatives may negatively influence the relationship between
parent and child as the parent’s time is necessarily divided and reprioritized (Szinovacz,
2003). Reinhard & Horowitz (1995), who studied 163 parents and siblings of mentally ill
adults, confirm that most parents report at least some consequence of caregiving. The three
stressors most often reported were being distracted from activities, upset household routines,
and family frictions.
GenderRole Differences Between Caregivers.
Genderrole differences also have an impact on caregiver wellbeing. Aneshensel et al.
(1995) note a particular vulnerability for women because of their refusal to delegate work.
Women would rather add on new roles than replace or alter old roles (Aneshensel et al.,
1995: 87). Unfortunately, most caregivers are female (Aneshensel et al., 1995; Himes &
Reidy, 2000; Hoyert & Seltzer, 1992; Marks, 1997; Pratt et al.,1985; Szinovacz, 2003; Ward
& Spitze, 1998) and most care recipients are female (Himes & Reidy, 2000). Because the
average lifespan of women is longer than that of men, more women live to reach older age
when a significant amount of caregiving may be required.
Moreover, where women have traditionally been viewed as occupying the role of nurturer,
the result has been the feminization of caregiving. Women are simply more obligated to offer
caregiving support (Rossi & Rossi, 1990). Although family policy has attempted to address
this problem, compounding factors of underemployment, wage disparity, and sex
discrimination may further complicate the situation. As a result the caregiving situation may
Further, Marks (1997) found that women have more family stress spillover to work than
men. Obviously, stress experienced by one member of the family or household is not always
exclusive to that member. Stress often has this “spillover effect” onto other family members
and the mere presence or absence of someone can change household dynamics drastically
(Karp, 2001; Reinhard & Horowitz, 1995; Szinovacz, 2003).
As we have seen, multiple roles and demands force families to adapt to caregiver and care
recipient needs to protect its members (Aneshensel et al. (1995) calls this stress
containment). The alternative is that they will fail to adapt and result in increased stress or
burden (Mitrani et al., 2006). As role overload results in high levels of caregiver stress,
caregiving may interfere with marital, parental, and occupational role demands of time,
effort, and energy simultaneously.
Hypothesis 2a: Psychological and physical, caregiver wellbeing will be lower for caregivers
who are involved in additional stressful life roles.
In addition, it follows that household composition will be mediated by the addition of
stressful life roles. In other words, the occupation of certain types of roles, like being
married, disabled, a parent, or a certain gender, will alter the effect of household
composition. For example, we know there are genderrole differences in the way that men
and women perform caregiving tasks. Where male caregivers are more likely to have
informal aide, female caregivers are likely to take advantage of both informal and formal
help (Lum, 2005). Therefore, the increase in household membership may be especially
influential for male caregivers, if males are relying on other family members to help in the
process of caregiving. And, singleparent households will certainly have different effects
Hypothesis 2b: The association between household composition and psychological and
physical, caregiver wellbeing will be mediated by other stressful roles.
Social Supports.
In the stress process model, Thoits (1999: 360) defines social support as “the degree to
which a person’s basic social needs are gratified through interaction with others.” Social
support is composed of two parts: emotional aid which encompasses affection, sympathy,
understanding, etc. and the instrumental aid which encompasses advice, information, etc
(Thoits 1999: 360). Therefore, the social support system is defined as the people within a
person’s social network that they rely on for emotional and instrumental aid.
Thoits (1999) explains that social supports act as buffers for the impact of stress. In
theory, people with strong social support should be able to cope better with major life events
than those with less support (Thoits, 1999: 359). Thoits (1995) further examined the
effectiveness of the buffering hypothesis in using social support to moderate the impact of
life events on mental health. She argues that the perception of emotional support availability
has a much stronger influence on mental health than the actual receipt of social support
(Thoits, 1995). In addition, while social integration is correlated with mental and physical
health, Thoits (1995) found that it did not buffer the impacts of physical or emotional life
events.
However, Wuest et al. (2001) note that some research indicates that not all support
reduces caregiver burden. In fact, some support although well meant, may create upsetting
interactions that may increase caregiver depression (Wuest et al., 2001: 119). In addition,
caregivers who are unsatisfied with their available resources report higher levels of
depression than their counterparts (Kramer, 1993: 387). Regardless, some social support is
Hypothesis 3a: Psychological and physical, caregiver wellbeing will increase with the
addition of social support.
Moreover, the effects of household composition and other stressful roles may be mediated
by the presence of social support. For example, the caregiver may experience decreased well
being in terms of household type or membership. Further, caregivers may experience other
stressful roles in addition to caregiving. However, the presence of social support, in the form
of emotional, instrumental and/or organizational, could mitigate the effects of some
previously incurred forms of burden, like household composition.
Hypothesis 3b: The effects of household composition and stressful roles on psychological and
physical, caregiver wellbeing will be mediated by social support.
Other Control Measures.
Age as a Factor.
Other social characteristics, such as age, race and education, are considered as control
variables within this analysis. Faison, Faria, & Frank (1999) predict that the portion of the
population aged 60 and older will exceed 17% by the year 2030. First, although the risk of
institutionalization rises with age, a majority of those who are 85 years or older live at home
(Aneshensel et al., 1995). Second, few studies consider the impact of age on caregiving (Kim
& Keshian, 1994). Third, the stress associated with aging may compound the difficulties of
caregiving. As noted, because caregiving is a very physical task, in some cases, increased age
may interfere with the caregiver’s ability to perform all necessary activities. In addition,
Covinsky et al. (2003) report a statistically significant increase in burden scores for increased
age of caregivers.
While some authors argue that age has a negative association with caregiver wellbeing,
Keshian (1994), for example, studied elderly clients as part of a Council on Aging home
nursing support program and found that caregivers over the age of 85 reported satisfaction
with caregiving because of the longevity of the relationship and emotional bond to the care
recipient. The authors infer that this is because most caregivers were caring for spouses (Kim
& Keshian, 1994). In addition, it is also possible to infer that role strain may decrease for
caregivers over the age 85 because they have less conflicting time constraints and obligations
(Kim & Keshian, 1994).
Differences by Race.
Caregivers differ by race as well. African Americans are more likely to receive informal
care from relatives and friends than white elders (Belgrave et al., 2004; Lum, 2005; Reinhard
& Horowitz, 1995). However, they are less likely to receive care from spouses, because they
are less likely than whites to be married (Belgrave et al., 2004; Lum, 2005). Rossi & Rossi
(1990) also find that African Americans have significantly stronger obligations to care for
distant kin compared to whites. In turn, this may contribute to an increased risk of minority
caregivers developing depressive symptoms (Covinsky et al., 2003; Lum, 2005). In fact, Lum
(2005) examined family/ household structure, socioeconomic status, and culture in relation to
caregiver networks and found that race was the most important factor predicting caregiver
wellbeing. Social support networks for caregivers of Lum’s (2005) study differed most
dramatically by race.
Education of Caregivers.
Lastly, several researchers have found that most caregivers have at least a high school
degree (Covinsky et al., 2003; GallagherThompson & Powers, 1997; Gitlin et al., 1999;
Lum, 2005; Morano, 2003). Rossi & Rossi (1990) note that with increased education comes
al. (1995), Covinsky et al. (2003), Kosloski et al. (1999), and Kosmala et al. (1999), have
found that having less education is associated with higher levels of burden. In other words,
the effect of education appears to be more than the receipt of a diploma. Completing at least a
high school degree may offer the caregiver a minimal set of social and emotional “tools” or
coping resources that s/he can draw from in times of need.
In summary, there appears to be significant literature to assert hypotheses concerning the
mediating presence or absence of persons living with the caregiver and care recipient. Again,
caregiving is a complex task with a finite number of stressors. And, I admit that household
structure may not be the most influential mediating force in caregiver burden. However,
research in this area has fallen short of examining fully its implications.
Hypothesis 4: The association between household composition and caregiver psychological
and physical wellbeing will be mediated by age, race, and education.
Methods.
Data.
To empirically examine these hypotheses, this study uses the National Survey of Families
and Households, Wave II (19921994). The original sample consisted of 10,009 respondents
for Wave II who were part of the noninstitutionalized population aged 19 and older in the
contiguous United States. The sample for this study is limited to respondents who answered
affirmatively to the question: “During the last 12 months have you, yourself, given anyone
who was living with you at the time any help with personal care because of their long term
physical or mental condition, illness, or disability?” (N=750.) Analysis was further limited by
missing data, resulting in a final sample of 575 caregivers.
Because data was not recollected for household composition in wave II, this measure had
wave II is problematic. Households are unstable units. Older children move out, people
divorce and remarry, and family members may die. However, since this measure was not
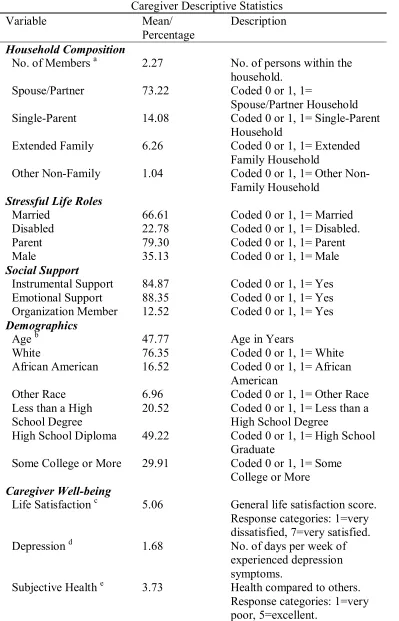
Table 1. Caregiver Descriptive Statistics Variable Mean/ Percentage Description Household Composition
No. of Members a 2.27 No. of persons within the household.
Spouse/Partner 73.22 Coded 0 or 1, 1=
Spouse/Partner Household SingleParent 14.08 Coded 0 or 1, 1= SingleParent
Household
Extended Family 6.26 Coded 0 or 1, 1= Extended Family Household
Other NonFamily 1.04 Coded 0 or 1, 1= Other Non Family Household
Stressful Life Roles
Married 66.61 Coded 0 or 1, 1= Married Disabled 22.78 Coded 0 or 1, 1= Disabled. Parent 79.30 Coded 0 or 1, 1= Parent Male 35.13 Coded 0 or 1, 1= Male Social Support
Instrumental Support 84.87 Coded 0 or 1, 1= Yes Emotional Support 88.35 Coded 0 or 1, 1= Yes Organization Member 12.52 Coded 0 or 1, 1= Yes Demographics
Age b 47.77 Age in Years
White 76.35 Coded 0 or 1, 1= White African American 16.52 Coded 0 or 1, 1= African
American
Other Race 6.96 Coded 0 or 1, 1= Other Race Less than a High
School Degree
20.52 Coded 0 or 1, 1= Less than a High School Degree
High School Diploma 49.22 Coded 0 or 1, 1= High School Graduate
Some College or More 29.91 Coded 0 or 1, 1= Some College or More Caregiver Wellbeing
Life Satisfaction c 5.06 General life satisfaction score. Response categories: 1=very dissatisfied, 7=very satisfied. Depression d 1.68 No. of days per week of
experienced depression symptoms.
Subjective Health e 3.73 Health compared to others. Response categories: 1=very poor, 5=excellent.
Demographic characteristics indicate the mean age of caregivers was approximately 48
years, and most caregivers had at least a high school degree (80%). The sample was also
primarily white (76%). Seventeen percent were African American, and other races composed
only 7% of the sample.
Measures.
Dependent Variables.
The dependent variables considered in this study are life satisfaction, depression, and
physical health. The variable “life satisfaction” measured satisfaction over six concerns:
financial situation, amount of leisure time, health, friendships, family life, and present job.
Respondents were asked to rate their satisfaction on a scale from 1 to 7, where 1 is very
dissatisfied and 7 is very satisfied. The life satisfaction scale had a standardized Cronbach’s
alpha coefficient of .67.
For the depression scale, respondents were asked to indicate how many days per week that
they experienced lack of appetite, feeling depressed, restless sleep, feeling lonely, feeling
irritable, and the number of days the respondent “could not get going” or experienced things
that didn’t normally bother them. The Cronbach’s alpha standardized score was .86.
Subjective physical health was measured by one item: “Compared with other people your
age, on a scale of 1 to 5, where 1 is very poor and 5 is excellent, how would you describe
your health?”
Independent Variables.
Household composition variables included: the number of persons within the household
(“How many additional persons live in this household with you, not including yourself?”)
and household type, which was a constructed variable for the NSFH, Wave I. Household type
singleparent household, extended family household, and other nonfamily household. The
reference group is other nonrelated households.
Stressful life role variables included measures for: marital status, disability (“Do you have
any other longterm physical or mental condition or disability which limits what you are able
to do, or which is likely to limit your activities in the future?”), parental status (“How many
children have you given birth to/ fathered?”), and sex. For the purpose of ordinary least
squares (OLS) regression, these variables are coded “0” and “1”, respectively, for
unmarried/married, no disability/ disabled, no children/ parent, and female/male.
Because social support can come in the form of physical, instrumental support or
emotional support, I used three variables to capture this aspect. Instrumental support was
measured by a question that asked, “What if you had to borrow $200.00 for a few weeks
because of an emergency. Who would you ask?” This variable was coded “0” if the
respondent had no support and “1” if the respondent had some support. Emotional support
was measured by a question which asked, “Suppose you had a problem, and you were feeling
depressed or confused about what to do. Who would you ask for help or advice?” Again, the
variable is coded “0” if the respondent had no support and “1” if the respondent had some
support.
Finally, to capture organizational membership, ten items were scaled into one
substantively, interpretable variable. The ten questions used to create this measure were:
How often if at all, do you participate in each type of organization? The organizations listed
included fraternal groups, service clubs, and political groups, sports groups, youth groups and
school related groups, hobby or garden clubs, literary, art, study or discussion group,
professional or academic societies, and churchaffiliated groups. The standardized
respondent mentioned belonging to one of the groups in the list and “0” if the respondent was
not a member.
Control Variables.
Additional measures were included for the caregivers’ age, race, and educational level.
Race is a categorical variable and is recoded into three dummy variables representing whites,
African Americans, and other races. Education is also recoded as a threepart, dummy
variable: less than a high school degree, a high school degree, and some college or more.
These variables are coded “1” if the respondent indicated that level of education. The
reference categories are white and less than a high school degree.
Methods of Analysis.
Of the 750 selfindicated caregivers, 175 had missing data, and 575 met the statistical
requirements for OLS linear regression testing. This study tries to provide a picture of
different household structures that are more or less conducive to the emotional and physical
health of the caregiver. Therefore, OLS linear regression is appropriate for this task.
Three tables were constructed to analyze the effects of the three dependent variables for
caregiver wellbeing: life satisfaction, depression, and subjective health. For each table, the
measures are introduced in successive equations that represent the block of variables tested in
each of the hypothesis. Model A is the baseline equation and examines the effects of the
number of persons within the household and household type upon caregiver wellbeing. The
four stressful roles are added to the baseline equation in Model B. Model C introduces social
support to the Model B, and Model D considers all preceding variables with the addition of
Results.
Means for the three dependent variables describe the baseline distribution for measures of
caregiver wellbeing. First, caregivers were, in general, moderately satisfied with their life
satisfaction rating as 5.06 on a scale of 1 to 7. Second, caregivers often experienced about 2
days per week with depressive symptoms. And, third, caregivers indicated a physical health
range from good to very good with the average being 3.73 on a scale of 1 to 5.
The average household size was 2.27 people in addition to the caregiver. Means for the
four variables composing household type offer another baseline for household composition.
Seventythree percent of the sample lives within spouse/ partner households. Fourteen
percent of the sample lives within singleparent households. Extended family households
comprise 6.26% of the sample, and 1.04% of the sample lives within other nonrelated
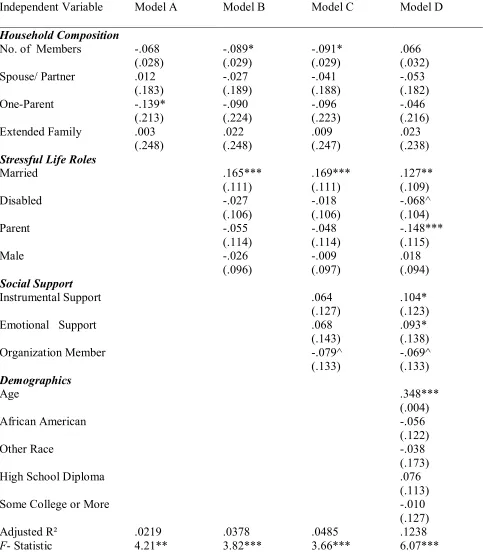
Table 2.
OLS Regression of Life Satisfaction on Household Structure, Stressful Life Roles, Social Support, & Demographics
Independent Variable Model A Model B Model C Model D
Household Composition No. of Members .068 (.028) .089* (.029) .091* (.029) .066 (.032) Spouse/ Partner .012 (.183) .027 (.189) .041 (.188) .053 (.182) OneParent .139* (.213) .090 (.224) .096 (.223) .046 (.216) Extended Family .003 (.248) .022 (.248) .009 (.247) .023 (.238) Stressful Life Roles Married .165*** (.111) .169*** (.111) .127** (.109) Disabled .027 (.106) .018 (.106) .068^ (.104) Parent .055 (.114) .048 (.114) .148*** (.115) Male .026 (.096) .009 (.097) .018 (.094) Social Support Instrumental Support .064 (.127) .104* (.123) Emotional Support .068 (.143) .093* (.138) Organization Member .079^ (.133) .069^ (.133) Demographics Age .348*** (.004) African American .056 (.122) Other Race .038 (.173) High School Diploma .076 (.113) Some College or More .010 (.127) Adjusted R² .0219 .0378 .0485 .1238 F Statistic 4.21** 3.82*** 3.66*** 6.07***
Note: N= 575. Table entries are standardized (metric) regression coefficients (standard errors of estimates are in parentheses). ^ p<.10; * p<.05; ** p<.01; *** p<.001 (two
In Table 2, all four models were statistically significant at least at the .01 alpha level for
life satisfaction. According to the baseline model, respondents who were residing in a single
parent household are less likely to feel satisfied with life (.139) compared to respondents in
nonrelated households. None of the other measures for household types reaches statistical
significance. The adjusted R² indicates that 2.19% of the variance in life satisfaction is
explained by household structure.
Accounting for stressful life roles, the effect of oneparent households is reduced by 35%
and is no longer statistically significant. Being married (.165) has a statistically significant
positive effect on one’s life satisfaction score, and the coefficient for household count
reaches statistical significance, suggesting a suppression effect. It is plausible that the
influence of spouse/ partner households is being picked up by marital status in the latter three
models. However, linear regression analysis does not indicate a strong Pearson’s correlation
between the two variables.
The addition of stressful roles also unveils a relationship between the number of persons
within the household and caregiving. Life satisfaction scores are predicted to decrease by
.089 units for every additional member of the household. The addition of stressful roles also
significantly increased the explained variation in life satisfaction to 3.78%, according to
results of an incrementalF test.
When social supports are added household membership and being married continue to
have statistically significant effects on the life satisfaction score. Additionally, membership
in an organization (.079) approached statistical significance at the .05 alpha level. Model C
indicates that 4.85% of variance is explained by household structure, stressful roles, and
social support. Again, this increase in variance was statistically significant according to the
With the addition of control variables, Model D accounts for 12.38% of the variance in
life satisfaction, another statistically significant increase in explanation. Household count is
no longer statistically significant within this model, but being married maintained
significance at the .01 alpha level. Organizational membership also continued to approach
significance. Additionally, being a parent, age, and having emotional and instrument support
became statistically significant at least at the .05 alpha level. Parental significance indicates
that there is a suppression effect going on. It can also be said that having instrumental and
emotional support increases life satisfaction scores. There is a predicted increase of life
satisfaction score of .348 units with every one year increase in age. Consequently, becoming
a parent (.148) is predicted to decrease life satisfaction score. Having a disability also
began to approach statistical significance. Throughout the first few models, being married
had a stronger impact on life satisfaction than the number of persons within the household or
social support measures as indicated by standardized coefficients. This is consistent with
mental health literature. However, when control variables are added, age had the strongest
Table 3.
OLS Regression of Depression on Household Structure, Stressful Life Roles, Social Support, & Demographics
Variable Model A Model B Model C Model D
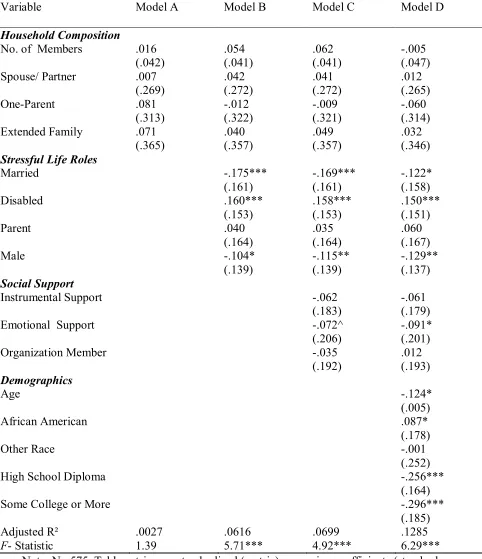
Household Composition No. of Members .016 (.042) .054 (.041) .062 (.041) .005 (.047) Spouse/ Partner .007 (.269) .042 (.272) .041 (.272) .012 (.265) OneParent .081 (.313) .012 (.322) .009 (.321) .060 (.314) Extended Family .071 (.365) .040 (.357) .049 (.357) .032 (.346) Stressful Life Roles Married .175*** (.161) .169*** (.161) .122* (.158) Disabled .160*** (.153) .158*** (.153) .150*** (.151) Parent .040 (.164) .035 (.164) .060 (.167) Male .104* (.139) .115** (.139) .129** (.137) Social Support Instrumental Support .062 (.183) .061 (.179) Emotional Support .072^ (.206) .091* (.201) Organization Member .035 (.192) .012 (.193) Demographics Age .124* (.005) African American .087* (.178) Other Race .001 (.252) High School Diploma .256*** (.164) Some College or More .296*** (.185) Adjusted R² .0027 .0616 .0699 .1285 F Statistic 1.39 5.71*** 4.92*** 6.29***
Table 3 examines the effects of household structure, stressful roles, and social support on
depression. Household composition variables were not significant in any of the four models
for depression. Although the baseline model for household composition was not significant,
the following models were statistically significant at the .0001 alpha level for this dependent
variable. When stressful life roles are added statistical significance is found for the roles of
being married, disabled, and male. According to Model B, those who are married are
predicted to face .175 fewer days with depressive symptoms than those who are not married.
In addition, male caregivers are predicted to experience .104 fewer days with depressive
symptoms than females. However, those who have a disability are predicted to incur .160
more days with depressive symptoms than those without disability. The adjusted R² indicates
that 6.16% of the variance in depression is explained by household structure and these three
stressful roles.
The increase of variance explained from Model B to Model C was statistically significant
according to the incrementalF. With the addition of social support, the model explains
6.99% of the variance in depression. Disability, marital status, and male gender continue to
have statistically significant effects that remain also in the next model. Emotional support
also approaches statistical significance.
The last model, which considers for control variables, accounts for another significant
increase with 12.85% of the variance in depression explained by these variables. Age and
education are predicted to have a negative effect on the number of days with depressive
symptoms at least at the .05 alpha level. For every one year increase in age, depression is
predicted to decrease by .124. Also, those with a high school degree and those who have
some college or more are predicted to experience .256 and .296 fewer days, respectively,
education. Consequently, being African American (.087), compared to being white, is
predicted to increase the number of days with depressive symptoms. While being married
and disabled had comparably strong effects on depression throughout the later three models,
when controlling for demographic characteristics, education had the strongest effect,
Table 4.
OLS Regression of Subjective Health on Household Structure, Stressful Life Roles, Social Support, & Demographics
Variable Model A Model B Model C Model D
Household Composition No. of Members .081^ (.025) .025 (.024) .017 (.025) .068 (.027) Spouse/ Partner .181* (.160) .219** (.159) .214** (.159) .196** (.156) OneParent .197** (.186) .171* (.188) .173* (.188) .144* (.185) Extended Family .002 (.217) .010 (.208) .004 (.209) .019 (.204) Stressful Life Roles Married .097* (.094) .090^ (.094) .058 (.093) Disabled .295*** (.090) .296*** (.090) .286*** (.089) Parent .008 (.096) .006 (.096) .023 (.098) Male .011 (.081) .005 (.082) .012 (.080) Social Support Instrumental Support .048 (.107) .043 (.106) Emotional Support .043 (.120) .060 (.118) Organization Member .058 (.113) .027 (.114) Demographics Age .067 (.003) African American .049 (.104) Other Race .080* (.148) High School Diploma .261*** (.097) Some College or More .246*** (.109) Adjusted R² .0189 .1089 .1133 .1611 F Statistic 3.76** 9.77*** 7.67*** 7.89***
All four models predicting subjective health in Table 4 are statistically significant at least
at the .01 alpha level. Spouse/partner households and singleparent households, significant at
the .05 and .01 alpha levels, respectively, were predicted to have a negative effect on
subjective health compared to other nonrelated households. If the caregiver is a member of a
spouse/partner household or a singleparent household, s/he is predicted to have a lower
subjectively reported health score of .181 and .197 units, respectively, compared to other
nonrelated households. Household composition also explains approximately 1.89% of the
variance in subjective health. According to standardized coefficients, household type had
comparably greater predictive strength than the number of persons within the household in
accounting for subjective health.
Within the model for stressful life roles the significance of household membership
disappears with the introduction of stressful life roles. It predicts that membership in
spouse/partner households (.219), singleparent households (.171), and being disabled (
.295) will have negative effects on health. However, being married is predicted to have a
.097 unit increase in health at the .05 alpha level. The model, with the addition of stressful
roles, explains 10.89% of the variance in subjective health. In addition, variance explained in
Model C increased to 11.33%, according to the adjusted R². According to the incrementalF
test, while the addition of stressful life roles was a statistically significant improvement in
variance of subjective health from the model containing only household composition, the
addition of social support was not a significant improvement over Model B.
The addition of social supports continues to predict negative influences for caregivers
belonging to spouse/partner (.214) or singleparent households (.173) or possessing a
disability (.296), as opposed to those who belong to other nonfamily households and not
spouse/partner households and being disabled have greater strength in predicting health than
singleparent households and marital status. However, none of the added variables for social
support were statistically significant, and marital status loses statistical significance at the .05
alpha level.
Lastly, another statistically significant increase in explanation of variance, the model with
control variables, by comparison, accounts for 16.11% of the variance in subjective health on
household structure, stressful roles, social support, and control variables. Again,
spouse/partner households, singleparent households, and possession of a disability predict a
.196, .144, and .286 unit decrease in subjective health, respectively. Additionally,
caregivers of other races (.080) are also predicted to have lower subjective health scores
than whites. While the positive effect of being married disappeared in Model D, having a
high school degree (.261) or some college (.246), in comparison to those with less that a high
school degree, was predicted to positively influence health. This model indicated the
strongest predictive variables for subjective health were possession of a disability and
education.
Discussion.
Recall that there were seven hypotheses introduced for analysis. Hypothesis 1a argued
that caregivers who live in households with other family members will have more positive
psychological and physical wellbeing outcomes than caregivers who live with unrelated
persons. This hypothesis was partially supported within models for life satisfaction and
physical health. Singleparent households are predicted to have lower life satisfaction than
nonrelated variables, but this relationship disappears when other stressful roles are
considered. Additionally, singleparent and spouse/ partner households are predicted to have
regardless of stressful roles, social support, and demographic control variables. While single
parent households are understandably more stressed and, therefore, less healthy,
spouse/partner households are a bit harder to reconcile. Although the coding for household
type does not specify who else is residing in the household, two possible mechanisms may be
at work. Perhaps these households fair worse because caregivers are caring for spouses alone
without additional household members to help. On the other hand, additional people may be
present in the household but their presence does not guarantee that they will help the
caregiver.
Another factor to consider is the relationship between caregiver and care recipient.
However, the variables were limited in their ability to distinguish this relationship. Linear
regression indicated that educational attainment data was insufficient for cases that denoted
the relationship between caregiver and recipient. Because the addition of such a variable
made the number of interpretable cases drop to an unacceptable level for analysis, it was
determined that educational attainment was a more important predictor for caregiver well
being than the relationship between caregiver and recipient. Therefore, the latter variable was
excluded from the analysis.
Hypothesis 1b predicted that as the number of persons within the household increases,
caregivers will have more positive psychological and physical wellbeing outcomes. This
hypothesis was not supported by any models. While household membership approached
significance in the baseline model for subjective health, its relevance disappeared in
subsequent models. In fact, models including stressful roles and social supports for life
satisfaction actually report findings contradictory to the hypothesis. Models indicate that
while the number of persons within the household is a statistically significant predictor, as
predicted to decrease. Because life satisfaction was scaled as a composite variable, meaning
that the question was constructed to measure several items at once, this finding may reflect
discontent with a number of things. The addition of household members with the increase of
household needs may limit: finances, time to spend with friends, time to enjoy leisure
activities, or time to spend with family.
Now, recall that hypothesis 2a argued psychological and physical, caregiver wellbeing
will be lower for caregivers who are involved in additional stressful life roles.Substantial
support was found for this hypothesis. Life satisfaction findings predict that disabled
caregivers and caregivers who are parents have lower scores than caregivers who do not
occupy those roles. Also, several models for depression and health predict that disabled
persons have statistically significantly higher incidence of depressive symptoms and lower
subjective health.
However, there was also significant evidence in opposition to this hypothesis. Models
which include stressful roles, social supports, and control variables for life satisfaction and
depression predict that people who are married, versus those who are unmarried, have higher
life satisfaction scores and fewer days with symptomatic depression. Additionally, the model
for stressful roles predicts that those who are married have higher subjective health scores
than those who are unmarried. However, this effect disappears when social supports and
control variables are introduced.
Hypothesis 2b further predicts that the association between household composition and
psychological and physical, caregiver wellbeing will be mediated by other stressful roles.
This hypothesis was supported by models for life satisfaction and health. For life satisfaction,
the significance of singleparent households disappears with the addition of stressful life
subjective health, the significance of household membership disappears with the introduction
of stressful roles. Moreover, while spouse/partner households gain significance, singleparent
households lose some significance.
According to these findings, there appears to be a correlation between the number of
persons within the household and singleparent households. Age of additional household
members may be a mediating factor. As previously discussed, while the introduction of
additional members into the household may be helpful for the caregiver if others can
compensate for some of the burdens of care, there are cases in which additional members do
not exert a positive influence upon wellbeing. For example, if the additional members are
children, specifically young children, who are unable to help the caregiving situation, they
may simply become added burden for the caregiver.
Hypothesis 3a argues that psychological and physical, caregiver wellbeing will increase
with the addition of social support.Partial collaboration is found in models for life
satisfaction and depression. Statistically significant pvalues predict that emotional support
lowers the number of days with depressive symptoms and increases life satisfaction scores.
Instrumental support is also predicted to increase life satisfaction scores. Consequently,
models including social supports and control variables of life satisfaction predict that
members of organizations will have lower scores. This finding is unexpected, though it may
be explained as membership may impose more stress rather than be a source of social
support. Let us also recall that Thoits (1995) argued that while social integration is directly
and positively related to mental and physical health, it may not buffer the impact of chronic
stress. While instrumental support found only limited significance, this finding is not
completely without precedent. Thoits (1995) also found stronger significance for emotional