UNIVERSITI TEKNOLOGI MALAYSIA
UTM/RMC/F/0024 (1998)
BORANG PENGESAHAN LAPORAN AKHIR PENYELIDIKAN
TAJUK PROJEK : PEMBENTUKAN MODEL KUALITI HIDUP BANDAR DI MALAYSIA
MENGGUNAKAN KAEDAH DATA ENVELOPMENT ANALYSIS
Saya
_______________ HO CHIN SIONG_____________________
____ (HURUF BESAR)Mengaku membenarkan Laporan Akhir Penyelidikan ini disimpan di Perpustakaan Universiti Teknologi Malaysia dengan syarat-syarat kegunaan seperti berikut :
1. Laporan Akhir Penyelidikan ini adalah hakmilik Universiti Teknologi Malaysia.
2. Perpustakaan Universiti Teknologi Malaysia dibenarkan membuat salinan untuk tujuan rujukan sahaja.
3. Perpustakaan dibenarkan membuat penjualan salinan Laporan Akhir Penyelidikan ini bagi kategori TIDAK TERHAD.
4. * Sila tandakan ( / )
SULIT (Mengandungi maklumat yang berdarjah keselamatan atau
Kepentingan Malaysia seperti yang termaktub di dalam
AKTA RAHSIA RASMI 1972).
TERHAD (Mengandungi maklumat TERHAD yang telah ditentukan oleh
Organisasi/badan di mana penyelidikan dijalankan).
TIDAK
TERHAD
TANDATANGAN KETUA PENYELIDIK
Nama & Cop Ketua Penyelidik
Tarikh : _________________
CATATAN : * Jika Laporan Akhir Penyelidikan ini SULIT atau TERHAD, sila lampirkan surat daripada pihak
berkuasa/organisasi berkenaan dengan menyatakan sekali sebab dan tempoh laporan ini perlu dikelaskan sebagai SULIT dan TERHAD.
Lampiran 20
MODELING URBAN QUALITY OF LIFE WITH DATA
ENVELOPMENT ANALYSIS METHODS
(PEMBENTUKAN MODEL KUALITI HIDUP BANDAR DI
MALAYSIA MENGGUNAKAN DATA ENVELOPMENT
ANALYSIS)
PROF.DR.HO CHIN SIONG
DR. MUHAMMAD ZALY SHAH BIN MUHD HUSSEIN
FAKULTI ALAM BINA
UNIVERSITI TEKNOLOGI MALAYSIA
2008
ABSTRACT
The research examines the use of Data Envelopment Analysis (DEA) for the
measuring performance of the urban quality of life in Malaysia using the CCR
model. The Data Envelopment Analysis uses the general purpose linear
programming version multi-input multi-output model for the estimation taking the
selected cities as the decision making unit (DMUs). The performance measurement
of the urban quality of life indicators based on seven (7) sectors out of eleven (11)
sectors for better urban environment shows that Melaka city is the most efficient city
compared with the others. The analysis result also showed that the two (2) significant
sectors that influencing the urban quality of life are demography and land use
sectors. From this analysis, the frontier cities indicate that the DEA method seems to
be suitable for generating benchmarks for non-efficient cities. As a consequence, the
reference city may be used as a stimulation for the other cities to improve their
ii | P a g e
ABSTRAK
Penyelidikan ini adalah bertujuan untuk menguji penggunaan kaedah Data
Envelopment Analysis dalam mengukur prestasi kualiti hidup bandar di Malaysia
menggunakan model CCR. Kaedah Data Envelopment Analysis ini menggunapakai
konsep program linear berasaskan model pelbagai input dan output sebagai anggaran
dengan bandar-bandar terpilih sebagai decision making unit (DMUs). Berdasarkan
analisis yang telah dijalankan menggunakan petunjuk-petunjuk yang terpilih ke atas
bandar-bandar kajian mendapati bahawa bandaraya Melaka merupakan bandar yang
paling efisien berbanding yang lain. Hasil kajian ini adalah berdasarkan daripada
sebelas (11) sektor yang digunakan dan bandaraya Melaka adalah efisien dalam tujuh
(7) sektor berkenaan. Sementara itu, hasil analisis juga mendapati terdapat dua (2)
sektor yang signifikan dalam mempengaruhi kualiti hidup bandar pada tahun
penyelidikan iaitu sektor demografi dan guna tanah. Secara keseluruhannya, daripada
penyelidikan ini dapat membuktikan bahawa penggunaan kaedah Data Envelopment
Analysis adalah yang terbaik dalam membuat perbandingan bagi bandar-bandar yang
efisien. Dengan ini bandar yang efisien dapat dijadikan sebagai bandar rujukan bagi
bandar-bandar lain untuk meningkatkan prestasi mereka dalam mewujudkan kualiti
iii | P a g e
TABLE OF CONTENTS
DECLARATION
ABSTRACT
ABSTRAK
TABLE OF CONTENTS
LIST OF TABLES
LIST OF FIGURES
LIST OF APPENDICES
CHAPTER 1:
INTRODUCTION
1.1 Introduction 1
1.2 Goal and Objectives 1
1.3 Study Approach 2
1.4 Research Methodology 4
1.5 Conclusion 6
CHAPTER 2:
LITERATURE RIVIEW
2.1 Introduction 9
2.2 Urban Quality of Life 10
2.3 Sustainable and Quality of Life 11
iv | P a g e
2.5 Methods of Indicator Measurement 32
2.6 Data Envelopment Analysis 33
2.7 Strengths and Weaknesses of Data Envelopment Analysis 44
2.8 Conclusion 46
CHAPTER 3:
URBAN QUALITY OF LIFE FOR SELECTED CITY
3.1 Introduction 49
3.2 Urban Quality of Life Index 49
3.2.1 Demography 50
3.2.2 Housing 51
3.2.3 Economic 52
3.2.4 Utilities and Infrastructure 52
3.2.5 Public Facilities and Recreational 54
3.2.6 Environment 56
3.2.7 Social 57
3.2.8 Land Use 59
3.2.9 Urban Design and Heritage 59
3.2.10 Transportation and Accessibility 60
3.2.11 Financial Management 61
3.3 Conclusion 63
CHAPTER 4:
ANALYSIS AND RECOMMENDATION
4.1 Introduction 64
4.2 CCR Model Analysis 64
4.3 Analysis by Sectoral 70
v | P a g e
4.3.2 Analysis for Housing Sector 71
4.3.3 Analysis for Economics Sector 72
4.3.4 Analysis for Utility and Infrastructure Sector 73
4.3.5 Analysis for Public Facilities and Recreation Sector 74
4.3.6 Analysis for Environment Sector 75
4.3.7 Analysis for Social Sector 75
4.3.8 Analysis for Land Use Sector 76
4.3.9 Analysis for Urban Design and Heritage Sector 77
4.3.10 Analysis for Transportation and Accessibility Sector 78
4.3.11 Analysis for Finance and Management Sector 79
4.4 Benchmarking with Current Urban Quality of Life Index 80
4.5 Findings and Recommendation 82
vi | P a g e
LIST OF TABLES
Table 1: The definition of sustainable development concept in Malaysia 18
Table 2: Current Quality of Life Indicator 26
Table 3: Research Indicators of Urban Quality of Life 47
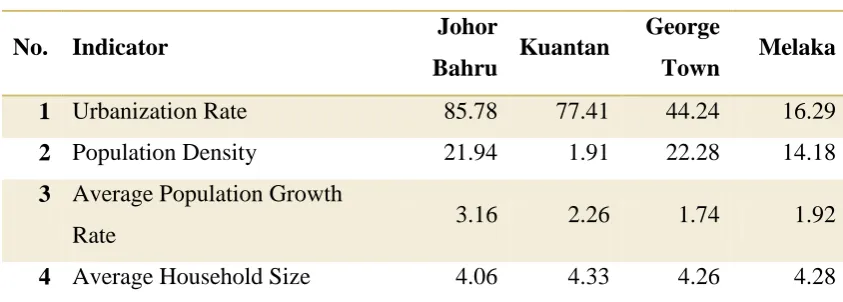
Table 4: Demography Indicators 50
Table 5: Housing Indicators 51
Table 6: Economic Indicators 52
Table 7: Utilities and Infrastructure Indicators 53
Table 8: Public Facilities and Recreational Indicators 55
Table 9: Environment Indicators 57
Table 10: Social Indicators 58
Table 11: Land Use Indicator 59
Table 12: Urban Design and Heritage Indicator 60
Table 13: Transportation and Accessibility Indicators 61
Table 14: Financial Management Indicators 62
Table 15: Input Efficiency Analysis Result for Demography Sector 71
Table 16: Input Efficiency Analysis Result for Housing Sector 72
Table 17: Input Efficiency Analysis Result for Economic Sector 73
Table 18: Input Efficiency Analysis Result for Utility and Infrastructure
Sector 74
Table 19: Input Efficiency Analysis Result for Public Facilities and
Recreation Sector 74
Table 20: Input Efficiency Analysis Result for Environment Sector 75
Table 21: Input Efficiency Analysis Result for Social Sector 76
Table 22: Input Efficiency Analysis Result for Land Use Sector 77
Table 23: Input Efficiency Analysis Result for Urban Design and
vii | P a g e Table 24: Input Efficiency Analysis Result for Transportation and
Accessibility Sector 79
Table 25: Input Efficiency Analysis Result for Finance and Management
Sector 80
Table 26: Data Envelopment Analysis (DEA) result and Quality of Life
Matrix by Sector for Research Study 81
Table 27: Indicators listed in Urban Indicators Database by
HABITAT (1993) 151
Table 28: Indicators listed in Malaysia Urban Network Index (MURNInet)
by Town and Country Planning Department, Malaysia (2003) 152
Table 29: Indicators used by Community University Institute for
viii | P a g e
LIST OF FIGURES
Figure 1: Research Methodology ... 4
Figure 2: Research Methodology Hierarchy ... 5
Figure 3: Profile of Research cities ... 8
Figure 4: General concept of sustainable development ... 12
Figure 5: Towards norms of Good Urban Governance... 14
Figure 6: Determining the best performing countries with normal DEA ... 35
Figure 7: The general structure of a DEA model (envelopment form) ... 40
Figure 8: The difference of CCR and BCC models ... 41
Figure 9: User Interface for Analysis Result (a. before and b. after) in MATLAB R2008a Software ... 66
Figure 10: The Programming Command Interface for Step 1 Solution ... 67
ix | P a g e
LIST OF APPENDICES
I. The MURNINet Indicators 86
II. Towards Norm of Good Urban Governance 131
III. The Applications of DEA in Selected Case
Error! Bookmark not defined.
CHAPTER 1
INTRODUCTION OF URBAN QUALITY OF LIFE STUDY
1.1 INTRODUCTION
Efficiency of resources management and planning are needed in ensuring
adequate amenities and better urban quality of life. Data Envelopment Analysis
(DEA) is one of the approaches in measuring efficiency of resources. DEA is a
popular approach used by researchers in developed countries in benchmarking
evaluation of quality.
For this research, DEA method is used as a new approach in evaluating our urban
quality of life. It is a comprehensive approach to make sure, the use of balanced
evaluating urban quality of life indicators.
1.2 GOAL AND OBJECTIVES
2 | P a g e
“Identifying status of urban quality of life for selected cities in Malaysia by using Data Envelopment Analysis (DEA)”
Below are the objectives of this study;
1. To identify urban quality of life indicators,
2. To benchmark urban quality of life for selected cities by using DEA,
3. To identify significant sectors influencing the urban quality of life for
selected cities in Malaysia.
1.3 STUDY APPROACH
The approaches used for this study include;
a) Data Collection
Data collection will be done based on primary and secondary data from the related
local authority, which are;
- Majlis Bandaraya Johor Bahru,
- Majlis Bandaraya Melaka Bersejarah,
- Majlis Bandaraya Pulau Pinang,
- Majlis Perbandaran Kuantan.
Data collection is based on the identified indicators from the literature review in
chapter 2. Selected local authorities are based on their size of population and urban
hierarchy in national context. Among 4 of the selected cities, only Kuantan still
remained with municipality as compared with the other three city halls. The reason
3 | P a g e
Peninsular Malaysia for east coast region as well as the relative big size of the city.
However, Kuala Lumpur City has been eliminated from this list because of the high
density area, less area for developing activities and its special role as a national
capital area.
b) Measuring and Benchmarking
Measurement and benchmarking for this study will based on DEA method. Data will
be limited for selected city and available data only. And the analysis is depends on
4 | P a g e
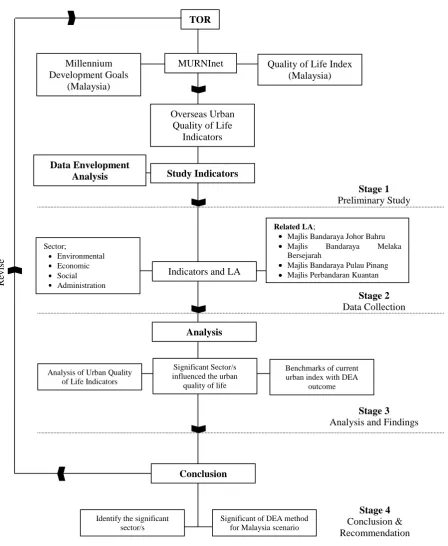
1.4 RESEARCH METHODOLOGY
Figure 1: Research Methodology TOR
MURNInet Millennium
Development Goals (Malaysia)
Quality of Life Index (Malaysia)
Overseas Urban Quality of Life
Indicators
Study Indicators
Indicators and LA Data Envelopment Analysis Stage 1 Preliminary Study Sector; Environmental Economic Social Administration
Related LA;
Majlis Bandaraya Johor Bahru Majlis Bandaraya Melaka Bersejarah
Majlis Bandaraya Pulau Pinang Majlis Perbandaran Kuantan
Stage 2 Data Collection
Analysis
Analysis of Urban Quality of Life Indicators
Significant Sector/s influenced the urban
quality of life
Benchmarks of current urban index with DEA
outcome
Stage 3 Analysis and Findings
Conclusion
Significant of DEA method for Malaysia scenario Identify the significant
5 | P a g e Figure 2: Research Methodology Hierarchy
Stage 1: Preliminary Study – This stage explains the Terms of Reference (TOR)
and literature study on DEA and indicators for urban quality of life. It includes recent
indicators used by local and overseas. In the local context, recent indicators used in
MURNInet program developed by Town and Country Planning Department will be
used as the basic example. It also includes the Malaysia Quality of Life Index Report
and Millennium Development Goals in 1992. While at the international context, it
relates to various sources especially from developed countries as parallel with our
Vision 2020. Detail review of DEA concept is also being done at this stage for a
better understanding of benchmarking and evaluation.
Stage 2: Data Collection – For data collection, it is based on primary and secondary
sources. It is done with related local authorities for this research. At this stage,
questionnaire forms will be used based on indicators identified in stage 1. The
secondary data sources are from the urban report, technical report and from
MURNInet website as the primary source for this research. Quality Performance and Final
Report
Continuous Quality Improvement
Analyze and Report
Test The Program
Preparing for Data Collection
Specify Indicators
6 | P a g e
However, for some data such as amount of spending and revenue of the local
authorities which are not included in their report, an appointment or telephone called
will be made to the officer in charge to get those information. The phone call will be
made for local authorities such Majlis Perbandaran Kuantan and Majlis Bandaraya
Pulau Pinang.
Stage 3: Analysis and Findings – For analysis, DEA method is the main tool to
measure urban quality of life indicators. This method will combine as the command
analysis with the MATLAB R2008a software which includes a lot of engineering
mathematics formula and solutions.
The DEA CCR model which been used in this research was been modified to
ensure it can be used for the analysis of data collected. The result of this analysis can
be used to benchmark the current index from the MURNInet.
Stage 4: Conclusion and Recommendation – This stage will identify the main
indicators that influence the urban quality of life. This will also ensure the
applicability of DEA method with our local environment in measuring the local
urban quality of life. At the same time, it will also identify the significant factors
affecting urban quality or life.
1.5 STUDY AREA
For this research four (4) main cities have been selected which are Johor
Bahru, Melaka, George Town and Kuantan. The four cities accounted for about 30
7 | P a g e
1.6 CONCLUSION
This research is the first time pioneer the use of DEA method in evaluating
our urban quality of life in Malaysia. The data collection will focus on the related
local authorities and in the significance of urban quality of life indicators with our
local context. The research has been divided into four (4) main stages i.e.; from
theoretical framework indicators identification, the outcomes and recommendations
Figure 3: Profile of Research cities
State: Johor
Status: Johor Bahru, Capital of Johor
Land Area: 220 sq. km
Main Economic Activities: Trade, commercial and industrial activities, and tourism State: Melaka
Status: Melaka town centre Capital of Melaka
Land Area: 303 sq. km
Main Economic Activities: Trade and commercial activities, and tourism
State: Pahang
Status: Kuantan, Capital of Pahang
Land Area: 2453 sq. km
Main Economic Activities: Trade and commercial activities, and port services
State: Penang
Status: George Town, Capital of Penang
Land Area: 299.65 sq. km Main Economic Activities: Trade, commercial and industrial activities
9 | P a g e
CHAPTER 2
LITERATURE RIVIEW OF URBAN QUALITY OF LIFE AND
DATA ENVELOPMENT ANALYSIS
2.1 INTRODUCTION
Since 1991, urbanization in Malaysia has been developed rapidly with 54.3%
and up to 65.4% in 2000. It gave a huge impact to most of urban areas and amenities
such as urban economic, utility and infrastructure, environment, public services,
community convenience and it‟s affecting towards the urban population quality of
life. At the same time, sustainable development which was introduced in the world
summit at Rio de Janerio, Brazil in 1992 has already used in Malaysia. It covers three
major dimensions which are environment, economic and social needs. It includes
urban life aspects such as education, housing, transportation, health, security and
environment. These dimensions promised for balanced in planning and development
towards developed area. Variety of indicators and measuring methods are used in
evaluated the development we brought with our quality of life status. And it is
already been complex issues to discuss about the quality of life as it has to tackle
10 | P a g e
2.2 URBAN QUALITY OF LIFE
The concept of quality of life has been popular since 1960‟s and 1970‟s when
environmental crisis became major issues especially in developed countries such as
United State. Since then, there are many players tried to use this concept of quality of
life in their planning and management. It includes the scientists, local authorities,
academicians, Non-Governmental Organization (NGO‟s), community and others.
And it brings to diverse definitions depend on their background and requirement.
Quality of life can be interpreted in many different ways. For some it means
security and safety, employment opportunities, a clean environment, ease of travel,
access to services, adequate health care, good schools, efficient government, or
simply time spent with family and friends. This wide interpretation of quality of life
demands a broad representation of indicators to best reflect the overall health of the
community.
However, in normal situation the definition of quality of life defined related
with income per capita. The concept of quality of life has been used widely, but a
research done by The Economist Intelligence Units (EIU) concluded that this concept
cannot describe about the quality of life itself in certain area. It showed that
individual needs consist of complexity of various aspects. It covers the human
characteristics and feelings. It includes their happiness, sad, enjoyment, and more
than that is their origin background.
Malaysia Quality of Life report (2004) defines the quality of life as
self-developed, healthy life style, access and freedom in gained knowledge and enjoying
more than basic needs and human psychology in achieving social consciousness
towards national vision.
However, Laura Carnfield (2005) a research officer from Physiology
11 | P a g e
life. It covers human feelings with their environment such as convenience, happy,
sad and other feelings. Her researches on some developing countries show that
individual quality of life is depending on their gender and age. For an example in
Thailand, the aged population dreams of having better health and religious wellness
rather than the young generation which dream of having a better job and vehicle
ownership.
In the City of Jacksonville Progress Report 2006, quality of life is defined as
the same meaning with Laura Carnfield as it refers to a feeling of well-being,
fulfilment, or satisfaction resulting from factors in the external environments. For
many people, the quality of close interpersonal relationships, rather than the external
environments, is the primary factor in determining happiness.
As a conclusion, in general Malaysia quality of life is similar with other
nations. In addition, Malaysia aims at progress and development of quality of life
towards national vision to be among a developed country by year 2020. This defines
the concept of our development towards own style and approach. However the basis
is still same as it tries to improve its community environment lifestyle towards better
day. Although the quality of life is a wide concept to discuss but the basis is that it
includes feelings and needs of human to improve their life style for more
convenience and enjoyable. Variety of dimensions should be taken into consideration
to evaluate the quality of life. With the complexity of human environment to
understand makes the measurement becomes more quantitative rather than
qualitative.
2.3 SUSTAINABLE AND QUALITY OF LIFE
12 | P a g e 'development which meets the needs of the present without compromising
the ability of future generations to meet their own needs'.
However, United Nations Centre for Human Settlements (HABITAT) definition
on sustainable urban in their Sustainable Urban Program is an urban area which can
preserved their development in social, economic and physical development forever.
Through the Sustainable development concept, the UN-HABITAT has introduced
the Sustainable Cities Programme (SCP). The SCP is a joint UN-HABITAT/UNEP
facility established in the early 1990‟s to build capacities in urban environmental
planning and management. The programme targets urban local authorities and their
partners. It is founded on broad-based stakeholder participatory approaches.
Figure 4: General concept of sustainable development
In promoting urban environmental governance processes SCP works closely
with UN-HABITAT‟s Global Campaign on Urban Governance. The goal of the
13 | P a g e
urban governance. Its objectives are the increasedcapacity of local governments and
other stakeholders to practice good urban governance and raised awareness of and
advocacy for good urban governancearound the world.
“Urban governance is the sum of the many ways individuals and institutions,
public and private, plan and manage the common affairs of the city. It is a continuing
process through which conflicting or diverse interests may be accommodated and
cooperative actions can be taken. It includes formal institutions as well as informal
arrangements and the social capital of citizens.
Urban governance is inextricably linked to the welfare of the citizenry. Good
urban governance must enable women and men to access the benefits of urban
citizenship. Good urban governance, based on the principle of urban citizenship,
affirms that no man, woman or child can be denied access to the necessities of urban
life, including adequate shelter, security of tenure, safe water, sanitation, a clean
environment, health, education and nutrition, employment and public safety and
mobility.
Through good urban governance, citizens are provided with the platform
which will allow them to use their talents to the full to improve their social and
economic conditions.” (Source: Good Urban Governance: A Normative Framework
14 | P a g e Figure 5: Towards norms of Good Urban Governance (refer Appendix II for detail
explanations)
a) Sustainability in all dimensions of urban development
Cities must balance the social, economic and environmental needs of present and
future generations. This should include a clear commitment to urban poverty
reduction. Leaders of all sections of urban society must have a long term, strategic
vision of sustainable human development and the ability to reconcile divergent
interests for the common good.
b) Subsidiarity of authority and resources to the closest appropriate level
Responsibility for service provision should be allocated on the basis of the
principle of subsidiarity, that is, at the closest appropriate level consistent with
TOWARDS NORMS OF GOOD URBAN GOVERNANCE
SUSTAINABILITY
SUBSIDIARITY
EQUITY
EFFICIENCY TRANSPERAN
CY & ACCOUNTABI
LITY CIVIC
ENGAGEMENT & CITIZENSHIP
15 | P a g e
efficient and cost-effective delivery of services. This will maximize the potential for
inclusion of the citizenry in the process of urban governance.
Decentralization and local democracy should improve the responsiveness of
policies and initiatives to the priorities and needs of citizens. Cities should be
empowered with sufficient resources and autonomy to meet their responsibilities.
c) Equity of access to decision-making processes and the basic necessities of urban
life
The sharing of power leads to equity in the access to and use of resources.
Women and men must participate as equals in all urban decision-making,
priority-setting and resource allocation processes. Inclusive cities provide everyone – be it the
poor, the young or older persons, religious or ethnic minorities or the handicapped –
with equitable access to nutrition, education, employment and livelihood, health care,
shelter, safe drinking water, sanitation and other basic services.
d) Efficiency in the delivery of public services and in promoting local economic
development
Cities must be financially sound and cost-effective in their management of
revenue sources and expenditures, the administration and delivery of services, and in
the enablement, based on comparative advantage, of government, the private sector
and communities to contribute formally or informally to the urban economy. A key
element in achieving efficiency is to recognize and enable the specific contribution
of women to the urban economy.
e) Transparency and Accountability of decision-makers and all stakeholders
The accountability of local authorities to their citizens is a fundamental tenet of
good governance. Similarly, there should be no place for corruption in cities.
16 | P a g e
poverty. Transparency and accountability are essential to stakeholder understanding
of local government and to who is benefiting from decisions and actions. Access to
information is fundamental to this understanding and to good governance. Laws and
public policies should be applied in a transparent and predictable manner. Elected
and appointed officials and other civil servant leaders need to set an example of high
standards of professional and personal integrity. Citizen participation is a key
element in promoting transparency and accountability.
f) Civic Engagement and Citizenship
People are the principal wealth of cities; they are both the object and the means
of sustainable human development. Civic engagement implies that living together is
not a passive exercise: in cities, people must actively contribute to the common good.
Citizens, especially women, must be empowered to participate effectively in
decision-making processes. The civic capital of the poor must be recognized and
supported.
g) Security of individuals and their living environment
Every individual has the inalienable right to life, liberty and the security of
person. Insecurity has a disproportionate impact in further marginalising poor
communities. Cities must strive to avoid human conflicts and natural disasters by
involving all stakeholders in crime and conflict prevention and disaster preparedness.
Security also implies freedom from persecution, forced evictions and provides for
security of tenure. Cities should also work with social mediation and conflict
reduction agencies and encourage the cooperation between enforcement agencies and
other social service providers (health, education and housing).
In Malaysia, the applied of quality of life concept has been applied in
sustainable development concept. Sustainable development has been integrated into
national development policies since the late 1970‟s and factors such as access to a
17 | P a g e
areas include implementation of national forestry management policies at state levels
and environmentally acceptable and efficient expansion of energy generation
capacity to meet expanding demand (Malaysia Development Goal, 2004).
The Malaysian government believes that economic growth is not an end in
itself but a means to bring prosperity and better quality of life to all segments of
society. In this respect, the principle of “growth with equity” has underlined all the
national development efforts since the 1970s, which had contributed to a significant
reduction in the incidence of poverty and a more equitable distribution of income
(Development Planning in Malaysia, 2004).
In terms of the formation of sustainable urban indicators, Malaysia is based
on the sustainable development and urban sustainability concept that is adopted in
this country. This sustainability is condensed to sectoral sustainability where each
has specific objectives and used as a reference to formation of indicators and
indicator standards.
Since then, the sustainable concept comprehends various aspects in
development, including;
i. Sustainable community
ii. Sustainable economic
iii. Sustainable social
iv. Sustainable culture
v. Sustainable agriculture
vi. Sustainable environment, and
18 | P a g e Table 1: The definition of sustainable development concept in Malaysia by Town
and Country Planning Department, Malaysia
DEFINITION OBJECTIVES
Sustainable Population Objective of Sustainable
Population Indicator
The total population within a settlement or
a city is balance with the carrying capacity
of the respective settlement or city from the
aspect of infrastructure, facilities, economy
and environment.
Towards achieving Vision 2020
with a quality of citizens that is
harmonious, caring and formation
of an ideal citizen.
Sustainable Housing Objective of Sustainable
Housing Indicator
To prepare adequate housing to handle
population growth and the needs of all
levels of society.
Housing development that
prepares adequate, quality and
affordable for citizens.
Sustainable Economy Objective of Sustainable
Economy Indicator
Enable an urban economic situation that is
productive, stable and innovative in
formulating a sustainable urban dynamism
as a contributor of job opportunities.
To eradicate urban poverty,
increase urban productivity and
increase job opportunities to
encourage perpetual urban
growth.
Sustainable Utility and Infrastructure Objective of Sustainable Utility
and Infrastructure Indicator
Sustainable utility and infrastructure needs
to be focused on water, electricity and
telecommunication supply as compared to
Availability of infrastructure and
utility supplies that is efficient and
19 | P a g e demand, while minimizing the rate of
wastage. For other utilities, which are solid
waste disposal, sewerage and drainage,
sustainability needs to be focused on a
service level that ensures comfort, health
and safety of residents.
well being of local residents.
Sustainable Public Facilities Objective of Sustainable Public
Facilities Indicator
Availability of adequate public and
recreational facilities by the authorities
need to be in line with population growth.
This is to enable current and future
residents will achieve a quality of life that
is comfortable and healthy.
Preparation of adequate
community and recreation
facilities to achieve a population
that is healthy and increase the
quality of life.
Sustainable Environment Objective of Sustainable
Environment Indicator
Sustainable environment concept is based
on the balance between development and
environment. In other words, the economic
development has to be encouraged but at
the same time the environment has to be
protected and conserved.
To ensure that physical
development is balanced with
environmental conservation
because both of them are inter
related and influence one another.
Physical development without
conservation will not ensure the
quality of life that is hoped for.
Sustainable Sociology and Social Impact Objective of Sustainable
Sociology and Social Impact
Indicator
Seen from the quality of life aspect
20 | P a g e (peaceful, familial, safety, health and
cleanliness - without pollution).
social characteristics of human
life that is aimed for.
Sustainable Land Use Objective of Sustainable Land
Use Indicator
Land use that is planned and implemented
by the Local Authority needs to consider
the interests of all levels of society
especially those marginalized. Issues such
as housing accessibility and other social
facilities are connected to land use
planning that is supposed to be maximizing
benefits and minimize costs.
To ensure a land use that is
planned and implemented within
the carrying capacity of the
respective area.
Sustainable Urban and Heritage Design Objective of Sustainable Urban
and Heritage Design
Identification and usage of design and
historical site characteristics to create an
urban design that is suitable.
Inclusion of design elements
within the design of the city that
mirror local identity and image.
Sustainable Transportation Objective of Sustainable
Transportation Indicator
A transportation system where residents
have access to work, commerce, recreation,
culture and housing by utilizing minimum
resources.
Sustainable transportation characteristics
are safety, comfort and efficient from the
aspect of economy and power usage while
minimizing environmental pollution.
To increase the usage level of
public transportation, bicyclists,
pedestrians and other
non-motorized transportation while
decreasing usage of motorized
21 | P a g e Sustainable Administration and Finance Objective of Sustainable
Administration and Finance
Indicator
Sustainable Local Authority is an
organization that can adjust and adapt for
the long term.
Pro-active Local Authorities and
have strong financial foundations
with a high level of enforcement.
Source: Garis Panduan Penerapan Konsep Pembangunan Mampan Dalam Perancangan, October
2001
While, Research Triangle Institute (RTI) defined the sustainable urban as a
metropolitan region which can emulate successfully at global level but still can
preserved their culture and environment excellent.
Hence, the used of urban quality of life concept is corresponding with the
sustainable concept that used in development planning. The applied of balancing
sector in quality of life dimension and aspect can help to achieve fair and successful
community.
As a conclusion, we have conclude that the urban quality of life is important
to parallel with the sustainable development concept such mention before. Hence
that, the mean of urban quality of life for this research is building better community
environment with their lifestyle towards an enjoyable and better environment for
future generation. Meaning that, the result of input/output decision making will be
based on this urban quality of life understanding. However, the input/output result is
22 | P a g e
2.4 URBAN QUALTIY OF LIFE INDICATORS
Many leading democracies around the world as well as major international
institutions are involved in efforts to develop specialized and comprehensive
indicator systems of societal performance (quality of life). Specialized indicator
systems focus on specific topics or information areas, such as health, education, or
children while comprehensive indicator systems focus on several information areas,
generally within the broader categories of economic, social, and environmental
arenas.
Several democracies, such as Canada and Australia, use comprehensive
indicator systems and focus on information areas such as economic opportunities and
innovation, the strength and safety of communities, national wealth, and national
income. Within these information areas are indicators ranging from real national net
wealth per capita and real disposable income per capita to life expectancy at birth
and literacy.
Several states and communities within the United States, such as the State of
Minnesota and the metropolitan area of Boston, also use comprehensive indicator
systems. These indicator systems focus on information areas such as public safety,
housing, and community and democracy and include indicators ranging from growth
in gross state product and unemployment rate to volunteer time and prenatal care.
Comprehensive indicator systems have two primary characteristics;
a) Creating an overall picture of how a community (or region, nation, etc.) is
doing.
b) Showing the interconnectedness of various key information areas, such as the
23 | P a g e
Through both these characteristics, a comprehensive indicator system allows
for a deeper understanding of what is really happening in a society and significantly
broadens the availability of that knowledge. Different entities take an individualized
approach to grouping together key specialized information areas. For example,
Australia‟s system includes biodiversity, crime, economic disadvantage and
inequality, education and training, health, land, national income, national wealth,
social attachment, water, and work.
We think our life is good when quality of life is high. Most of us, an ideal
quality of life would measure a person‟s overall well-being, that is, an individual‟s
total utility. An ideal index would depend upon things that money can buy.
Traditional economic goods such as food and drink, shelter, clothing, transportation,
and entertainment would be included among these things. Money income can be
used as a metric to measure well being. The logic is straightforward. More money it
minimizes our budget constraint and allows a person to purchase more things and
achieve a higher level of utility.
However, quality of life is not about money only. An ideal would depend also
upon social, environmental, and perceptual dimensions of well being. Moderate
climate, fresh air, clean water, safe neighbourhoods, good schools, and good
government would be included among these things. Furthermore, an ideal, holistic
definition would depend on the way in which individuals and households combine
marketed goods and services and environmental and community factors with their
own time and energy to produce the things such as happy homes that give them
utility directly and determine over well-being.
Based on ICLEI (1996), indicator is a measurement tool used effectively to
evaluate an achievement of certain community or urban area. It describes how
developed they are, increased or not, excellent or are they stick to their existing
24 | P a g e
At the international level, especially the urban indicator project that was
implemented by the UN Conference on Human Settlements (UNCHS 1996), UN
Development Programmes‟s Human Development Reports (UNDP 1996), World
Resources Institute (1994), Worldwatch Institute (Brown et. al.1997), World Bank
(1996), and OECD (1994). For example, the Lancashire case where indicators were
used comprehensively and it played various roles including administration and
technical, formation of political objectives; public participation and also surveying
action plan implementation.
Indicators are also accepted as a necessity for planning and enable the future
to be more sustainable at the local and global level. For survey purposes, indicators
have to be associated with its‟ objective. Data has to be easily obtainable and also
easily prepared as structured information.
Generally, there are at a minimum, three broad purposes for indicator systems
that are not mutually exclusive based on Forum on Key National Indicators in United
States on 27 February 2003. These three purposes are as follows:
a) Accelerate learning: This type of indicator system contributes to scientific
understanding as well as enhances the awareness, insight, and foresight provided
to leadership and the public.
b) Assess position and progress: This type of indicator system involves a broad,
constituent-focused aim and requires a generally accepted common vision and
comprehensive framework that helps uncover especially challenging problems
and beneficial opportunities.
c) Measure performance: This type of indicator system is specifically intended to
determine to what degree institutions or projects are successful and are
producing appropriate benefits for the resources they use.
Basically, the terms of urban quality on life indicators is based on
HABITAT‟s indicator. It becomes a benchmarking tool for global urban areas to
25 | P a g e
based on this HABITAT‟s indicators which been complied with their urban and local
environment. The reason is to make it easier for them to benchmark their urban
strengths and weaknesses.
However, in Canada, based on a research done by Community-University
Institute for Social Research (CUISR), they used various types of indicators to
measure the urban neighborhood quality of life in Canada. But, urban indicators as
generated by UNCHS (HABITAT) still remained the basic indicators used as the
indicators are collected from various countries will be grouped within the Global
Urban Indicator Database. In the research, they divided it into 9 main sectors with 56
indicators (refer Table 2). It was a holistic approach with summarize from different
government departments and NGO‟s. It includes the Canada Mortgage and Housing
Corporation (CMHC) and Federation of Canadian Municipalities (FCM).
In Malaysia, realizing how important the need for urban indicators, the
Federal Department of Town and Country Planning Peninsular Malaysia has
formulated 11 sectors with 55 Urban Indicators to measure the minimum quality of
life standard that has to be achieved by each city in the country (refer Table 2). To
simplify the usage of these indicators, a Malaysia Urban Indicators Network
(MURNInet) application system has been produced.
MURNInet was created based on a computer network that was designed to
analyze current urban conditions; effects of development, survey temporal change
and formulate sustainable urban scenarios for the future based on fixed standards
Table 2: Current Quality of Life Indicator
SECTOR Urban Indictors Database, HABITAT (1993)
MURNInet,
JPBD Malaysia (2003)
Community,
University Institute for Social Research
(2005)
SOCIAL 1) Population
2) Annual population growth
3) Tenure types
4) Evictions
5) Access to water
6) Household connections
7) Housing rights
8) Under - five mortality
9) Reported Crime rates
10)Poor households
11)Gross school enrolment
ratios
12)Urban violence
13)Literacy
14)Life expectancy at birth
1) Population Density.
2) Average Population Growth Rate.
3) Median Age.
4) Average Household Size.
5) Doctors and Population Ratio.
6) Ratio of Public Open Space per 1,000
Populations.
7) Primary Schoolchildren and Teacher
Ratio.
8) Kindergarten and Population Ratio.
9) Civic Hall and Population Ratio.
10)Percentage of the Population Involved In
Community Program.
11)The Quality Levels of Health Services.
12)Ratio of Crime Index Case per 10,000
1) Population Growth
2) Household & Family Compositions 3) Average Income
4) Renters & Owners 5) Population Mobility 6) Foreign Born
7) New Immigrant Groups 8) Language Spoken at Home
9) Visible Minorities
10)Aboriginal Population
11) 30+ Income on Shelter 12) 50%+ Income on Shelter 13) Core Housing Need 14) Substandard Unit
27 | P a g e
15)Urban violence Populations.
13)Ratio of Juvenal Case per 1,000
Populations.
14)Ratio of Arrests Due to Social Ills per
1,000 Populations.
15)Divorce Rate per 1,000 Marriages.
16)Percentage of Public Bus Users.
17)The Quality Level of Public Bus
Services.
18)Percentage of Single Occupancy Vehicle
(SOV) Entering City Centre during
Morning Peak Hour Period.
19)Ratio of Road Accident Cases per 10,000
Populations.
20)Percentage of Fatal Road Accident
Cases.
17) Voter Turnout
18) Women in Municipal Government 19) Newspaper Circulation
20) Volunteering
21)Charitable Donations
22) Education Levels 23) Literacy Levels 24) Adult Learning
25) Education expenditures 26) Classroom Size
27) Student/Teacher Ratio 28) Post-Secondary Tuition
29)Spending on Private Education
30) Youth Offenders 31) Violent Crimes 32) Property Crimes
33)Injuries and Poisonings
34) Low Birth Weight Babies 35) Teen Births
28 | P a g e
38) Suicides
39)Infant Mortality
40) Social Housing Waiting Lists 41) Rental-Geared-to-Income Housing 42) Social Assistance Allowances 43) Subsidized Child Care Spaces 44) Public Transit Costs
45) Social Services Professionals 46) Lone Parent Family
47) Incidence of Low Income Families 48) Children Living in Poverty
ENVIRONMENT 1) Water Consumption
2) Median water price
3) Waste water treated
4) Solid waste disposal
5) Travel time
6) Transport modes to work
7) Disaster prevention &
mitigation
8) Local environmental plans
1) Urbanization Rate.
2) Ratio of Floor Space Area per Person.
3) Ratio of Housing Output per 1,000
Populations.
4) Daily Water Consumption Rate of Every
Population.
5) Water Loss.
6) Percentage of Flooding Prone Area.
7) Average Garbage Collection per Day per
1) Air Quality
2) Urban Transportation 3) Population Density 4) Water Consumption 5) Wastewater Treatment 6) Solid Waste
7) Ecological Footprint
29 | P a g e
Population.
8) Percentage of Residential Units Serviced
by Centralized Sewerage.
9) Ratio of Asthmatic Cases per 10,000
Populations.
10)River Water Quality Index (WQI).
11)Percentage of Area That Received Waste
Disposal Services.
12)Percentage of Solid Waste That Has
Been Recycle.
13)Number of Complaint Cases on Noise.
14)Ratio of Water Bone and Food Diseases
per 10,000 Populations.
15)Air Quality Index.
16)Percentage of Total Land Area for Public
Facilities.
17)Percentage of Residential Floor Space
30 | P a g e
ECONOMIC 1) Land price to income ratios
2) House price & rent
3) Informal employment
4) City product
5) Unemployment
6) Public-private partnership
1) Unemployment Rate.
2) Employment Growth Rate.
3) Labor Force Growth Rate.
4) Poverty Rate.
5) Income Distribution (Gini Coefficient).
6) Housing Price and Income Ratio.
7) Housing Rental and Income Ratio.
8) Percentage of Tourism Attraction Area.
9) Percentage of Financial Budget for
Environmental Management.
10)Percentage of Budget Allocation for
Landscape Program.
11)Percentage Expenditure on Maintenance
of Heritage Elements and Urban
Beautification.
12)Percentage of Expenditure to Enhanced
Accessibility System.
13)Percentage of Administration
Expenditure As Compared to Revenue.
1) Rental Housing Starts
2) Monthly Rent
3) Unemployment/Employment Rates 4) Quality of Employment
5) Long Term Unemployment
6) Labor Force Replacement
7) Business Bankruptcies 8) Consumer Bankruptcies 9) Hourly Wages
10) Change in Family Income
11)Building Permits
12) Community Affordability
13) Families Receiving EI/Social Assistance 14) Economic Dependency Ratio
15)Income Gap
31 | P a g e 14)Local Authority per Capita Revenue.
15)Tax Collection Rate.
16)Cash Flow Ratio As Compared To
Emoluments.
17)Development Expenditure Per Capita.
ADMINISTRATIVE 1) Decentralization
2) Local government revenue &
expenditures
3) Citizens participation
4) Transparency &
accountability
5) International cooperation
1) Ratio of Population per Professionals and
Management Officers.
2) Percentage of C.F.O Approvals.
Source: 1- Urban Indicators Guidelines, HABITAT (1993)
2- MURNInet (version 2) Manual and Guidelines, JPBD (2003)
Based on table above, we can recognize which is the best quality of life
indicator based on their quality and quantity. The most quantity indicators are easier
to define rather than quality. It is because the quantity indicators are based on
numbers of indicators its covering but for the most quality indicators there are a few
things should be consider such as details of the indicators and how it was measured
in terms of unit (example population density: is it measured by every 1000
population or every 10000 population).
However, as mentioned before, there are some countries come with
comprehensive indicators and some with specific indicators. This issue occurred as
the research boundary is not a constant value. There are indicators need
comprehensive studies if it covers the entire country but if the study boundary covers
an urban area the best indicators are covering specific indicators to present the
condition of urban area.
2.5 METHODS OF INDICATOR MEASUREMENT
The quality of life approach usually categorized into two forms based on the
subjective or objective form.
With the introduced of quantitative method and social indicator movement
around 20-century, the objective approach has been used widely in quality of life
study. This approach is a test to use in balanced the objective criteria and quantitative
data in ensuring the individual value of quality of life. Most of the used are on
statistic and census data and it was an approach with more advantages including the
data availability and benchmarks between set. However, it was a method for indirect
33 | P a g e
While the subjective approach used the direct measurement happened to the
human and their environment. Without the data availability, this approach needs
more energy and effort in data collection on site.
A major difference between these two methods is objective indicator shows
the materialistic life style while the subjective approach measures the individual life
style perspectives. Hence the researchers have the own approach but most of them
used the same basis of quality of life that is characteristic. And usually, the
individual perspective and materialistic life style move correspondentially.
However, recently most of the researchers believed that both approach have
their own strength and weaknesses. The integration both approach brings the
completeness of quality of life measurement (Cobb, 2000).
2.6 DATA ENVELOPMENT ANALYSIS (DEA)
Data Envelopment Analysis (DEA) is a non-parametric approach that uses a
linear programming technique (Charnes, Cooper, Lewin and Seiford, 1989). It is
concerned with measuring the relative efficiency of a sample of producers, referred
to as decision making units (DMU) (Charnes et al, 1989). It is a relatively new “data
oriented” approach for evaluating the performance of a set of peer entities called
Decision Making Units (DMUs) which convert multiple inputs into multiple outputs
(Cooper, Lawrence and Zhu, 2004).
This section aims to illustrate the main concepts of DEA and how it can be
used to identify efficient producers within a particular industry. The method was
introduced by Charnes, Cooper and Rhodes (1978) based on frontier model by
34 | P a g e
maximum outcome (output). The DEA defines the best practice frontier that serves
as a benchmark and minimizes the relative distance to this benchmark.
DEA is about the flexibility in selecting data. Input and output can be in
various types of variable whether continuous, ordinal or categorical variables. It can
recognize the different variables including meter, dollar, hectare and etc. The terms
of output can be defined in verity of means neither the output performance nor the
quality of the performance. For efficiency, it comes in terms of efficiency evaluation,
quality evaluation and the outcome.
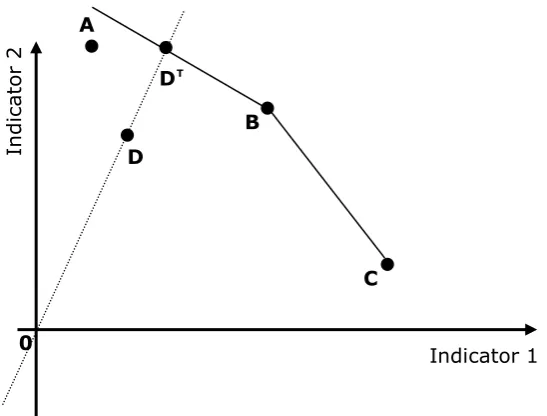
Farrell (1958) introduced the concept of the best practice frontier, which
delineates the technological limits of what a country can achieve with a given level
of resources. The solid line in figure 6 shows the best practice frontier computed by
DEA in a situation in which two indicators are combined into one single performance
index. Each dot in the diagram (A to D) stands for the performance of a country in
the sample.
The DEA constructs an envelope for the observed indicator combinations of
all countries in the sample under the constraint that all well-performing countries
support the envelope. The frontier is called best practice frontier and allows us to
classify countries into well performing units if they are at the frontier and into worse
performing units if they lie below. A worse performing country could either augment
the indicator number one or number two, or even both. The indicator of performance
is then given by the relative distance between the actual observed performance and
35 | P a g e Figure 6: Determining the best performing countries with normal DEA
In figure 6, three countries (A, B, and C) support the DEA ― best practice
frontier and are classified as best performing. Country D lies below the best practice
frontier and is identified as worse performing. As a performance indicator we used
the radial distance measure developed by Farrell (1957). It is defined as the ratio of
the distance between the origin and the projected point of the examined country at
the frontier divided by the distance between the origin and the actual observed point.
For example, the performance of country D is 0DT/0D (figure 6). The performance
score for the best performing countries is 1 and for the worse performing countries it
is larger than 1.
The case shown in figure 6 is the aggregation of two indicators with the aid
of an index-maximizing DEA. An index-maximizing DEA seeks to compute
economic performance as a proportional augmentation in all indicators. The
index-maximizing approach is applied if the scores of all indicators are preferred to be as
high as possible (e.g., GDP, literacy rate, etc.).
Indicator 1
In
d
icator
2
A
B
C D
D T
36 | P a g e
The computation of the envelope and the development index can be reduced
to a linear program for each individual country in which the following optimization
problem is solved:
Source: Linear program was developed by Charnes et al. (1978).
This procedure computes the performance score Zo of a single country that is equal to the weighted sum of the four indicators and must be repeated for each
country in the sample. Because we combine the four indicators of the HDI, the
resource side consists of the unity vector. The model computes the weights so that
the country under instigation is ranked as best as possible. Every weight of individual
indicators can lie between 0 and 1 and the sum of all weights must be equal to 1. The
weights can differ from country to country in contrast to the standard definition of
37 | P a g e 2.6.1 Models In DEA
Built upon the earlier work of Farrell (1957), DEA is a well established
methodology to evaluate the relative efficiencies of a set of comparable entities by
some specific mathematical programming models. These entities, often called
decision making units (DMUs), perform the same function by transforming multiple
inputs into multiple outputs. A main advantage of DEA is that it does not require any
prior assumptions on the underlying functional relationships between inputs and
outputs (Seiford and Thrall, 1990). It is therefore a nonparametric approach. In
addition, DEA is a data-driven frontier analysis technique that floats a piecewise
linear surface to rest on top of the empirical observations (Cooper et al., 2004).
As a body of concepts and methodologies that have now been incorporated in
a collection of models with accompanying interpretative possibilities as follows
(Cooper et al., 2004):
a) The CCR Ratio Model
Since the work by Charnes et al. (1978), DEA has rapidly grown into an
exciting and fruitful field, in which Operations Research and Management Science
(OR/MS) researchers, economists, and experts from various application areas have
played their respective roles (Forsund and Sarafoglou, 2002, 2005). For
comprehensive DEA expositions it was explained in publication by Cooper et al.
(2006).
As an example, assume that there are K DMUs, e.g. electricity distribution
utilities, to be evaluated that covert N inputs to M outputs. Further assume that
DMUk consumes xnk ≥ 0 of input N to produce ymk ≥ 0 of output M and each DMU
has at least one positive input and one positive output (Farell et al., 1994b; Cooper et
al., 2004). Based on the efficiency concept in engineering, the efficiency of a DMU,
38 | P a g e
(weighted combination of outputs) to its virtual input (weighted combination of
inputs).
To avoid bias in assigning the weights for inputs and outputs, Charnes et al.
(1978) developed an optimization model known as the CCR in ratio form to
determine the optimal weights for DMUo by maximizing its ratio of virtual output to
virtual input while keeping the ratios for all the DMUs not more than one. This
problem can be further transformed into an equivalent „„output maximization‟‟ linear
programming problem as follows:
Model (1) is known as the CCR in multiplier form. The efficiency scores of
DMU1 to DMUK can be derived by solving K such models.
Despite the linear form of (1), efficiency score is usually calculated based on
39 | P a g e
Model (2) is known as the input-oriented CCR in envelopment form (or the
Farrell model), which attempts to proportionally contract DMUo‟s inputs as much as
possible while not decreasing its current level of outputs. In economic literature,
model (2) may date back to the activity analysis models introduced by Von Neumann
(1945) and Koopmans (1951).
It has also a close relationship with the input distance function introduced by
Shephard (1970). In a similar way, we can also derive the output-oriented CCR in
envelopment form if efficiency is initially specified as the ratio of virtual input to
virtual output. Note that the constraint set in model (2) is nicely corresponding to the
piecewise linear production technology that exhibits constant returns to scale (CRS)
40 | P a g e
Where x = (x1, x2 . . . xn) and y = (y1, y2 . . . ym) are respectively the vectors
of inputs and outputs. Here we call T the reference technology that consists of all the
feasible combinations of inputs and outputs.
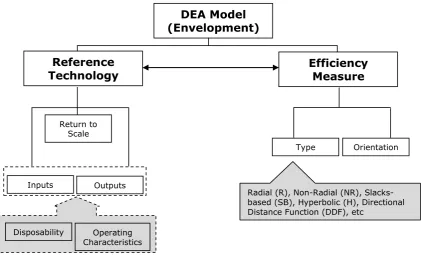
According to (2) and (3), we may break a DEA model down into two parts:
the efficiency measure and the reference technology. A DEA model is fully
characterized by its reference technology and efficiency measure.
Furthermore, the reference technology can be characterized by the type of
returns to scale (RTS), and the disposability and operating characteristics of inputs
and outputs. The efficiency measure will be determined by its type and orientation.
Figure 7 shows the general structure of a DEA model as well as the most
widely used efficiency measures energy and environmental studies.
Source: Zhou, P. et al (A survey of data envelopment analysis in energy, 2006)
Figure 7: The general structure of a DEA model (envelopment form)
DEA Model (Envelopment)
Efficiency Measure Reference
Technology
Return to Scale
Orientation Type
Outputs Inputs
Radial (R), Non-Radial (NR), Slacks-based (SB), Hyperbolic (H), Directional Distance Function (DDF), etc
41 | P a g e
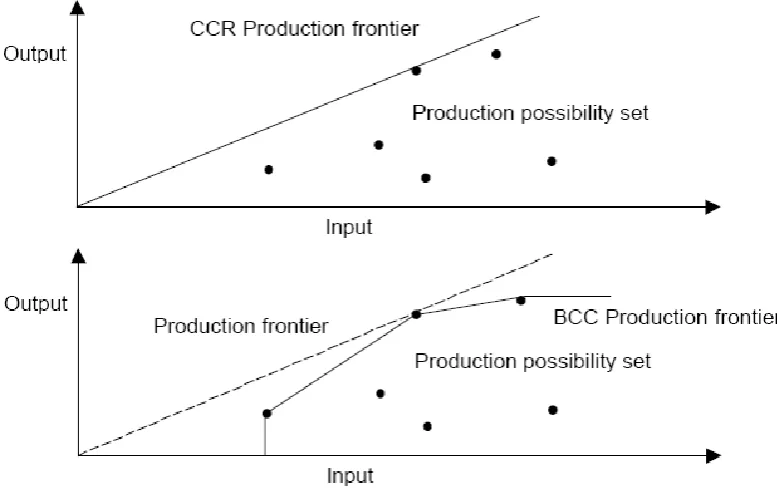
b) The BCC Model (1984)
The CCR model assumes constant returns to scale while determining the
efficiency of the DMUs. Banker, Charnes and Cooper (1984) modified the CCR
model by adding a constraint to account for the variable returns to scale. The
difference between the two models is illustrated by figure 8.
Figure 8: The difference of CCR and BCC models
The envelopment form of the BCC model would be the same as the dual for
42 | P a g e
c) The Multiplicative models (Charnes et al. 1982, 1983)
A Log-linear envelopment or a picewise Cobb-Douglas interpretation of the
production process (by reduction to the antecedent 1981 additive model of Charnes,
Cooper and Seiford)
d) The Additive model (as better rendered in Charnes et al. 1985 a