31
Quality of Work life of Coal Mining Workers
– A Case Study
Dr Manoj kumar
ABSTRACT:
Coalmining workers contribute extremely towards the economy in the energy sector and also to the country’s economy. Traditionally, they were the working class and the principal cause for the growth and expansion of the society and economy. The main objective of this paper identifies the various indicators of quality of wok life (QoWL) of coal mine workers and suggest for improvement of the key indicators. This paper also examines the socio-economic picture of the coal mining workers from the different aspects. This study is based on survey of objective as well as subjective questions that are seen as indicators/parameters/domain, sub indicators/ sub-parameters/sub-domain. The different tools which are used in this study are schedule, interview, direct observation and informal conversation through three round of surveys and sample over 300 responses of coal mining workers in 7 different coal mining complexes of Bermo coalfields of Bokaro district, Jharkhand. In the study, primary as well as secondary data were used to achieve the objective of the study. The QoWL index was found to be in fair category ranging from 0.55 - 0.68. Out of the thirteen parameters, the parameters like energy, housing, health, sanitation, education and transportation needs attention. This shows that the managers of coal mining complexes need to focus on improving infrastructures, both physical as well as social infrastructure to improve the quality of worklife.
32
INTRODUCTION :
The living conditions and the standard ofliving of coal mining workers would largely depend upon theincome earned by them. But worklife condition depends on other parameters apart from his earnings. Moreover, it is influencedby the working environment in and around the work place and the policy of the employer towards satisfaction of the employee at the work place.
The worklife condition of coal mining workers depends upon a number of factors, e.g.,Housing, Clothing, Food, Energy, water supply & Cleanliness, Health, Employment & working conditions, Social Security, Income, Education, Transportation, Communication, Addiction, Recreation etc.
The study model for QoWL of coal mining workers were developed in two ways.
1. One way equates QoWL with a set of objective organizational conditions & practices (job enrichment, supervisor, employee involvement, safe working conditions)
2. Equating QoWL with employee perception that they are safe, relatively well satisfied & able to develop as human being.
QoWL∝ human needs
QoWL is a function of objective conditions of life & subjective attitude. It encompasses a wide range of issues &ares like humanization of work, industrial democracy, work place participation, work improvement programme, socio-economic conditions, environmental pollution, social security. It varies with place, time, and availability of resources, educational status & aspiration of society.
33
𝑄𝑜𝑊𝐿 = � 𝑁𝑖 × 𝑍𝑖𝑗
NRiR = NRiCRNRiDRNRiS,
NRiCR = WRiCR/100,
NRiDR = WRiDR/100,
NRiSR= WRiSR/100 ,
Zij = ∑ 𝑓(𝑝)
Where :
Ni = Composite parametric Importance unit value of ith need / Domain/ sub- Domains NiC= PIU of ithcategory of needs.
NiD= PIU of ithdomains of ith needs.
NiS= PIU of ithsubdomains for respective domains of respective needs. WiC= Weightage of ithcategory of needs.
WiD= Weightage of ithdomains of ith needs.
WiS= Weightage of ithsubdomains for respective domains of respective needs. f(p) = rating in respect of ith needs / domains/ sub domains.
PURPOSE OF THE STUDY
The purpose of the study is to get the first hand knowledge ofthe socio-economic picture of the coal mining workers in different mining complexes of Bemo coalfields of Jharkhand State.
OBJECTIVES OF THE STUDY
The major objective of the present study is to assess the Quality of work life of coal mining workers.
The aim is to study
• To identify the various indicators of quality of life of coal mine workers.
• To find out the level of quality of work life of coal mine workers.
• To suggest for improvement of q uali t y of work li fe o f coal mi ne workers.
METHODOLOGY
34
RESEARCH –DESIGN
This study has used both qualitative &quantitative methods of data gathering with the help of questionnaires & personal interview. RequiredPrimary data collected from the field survey in the study areaand researcher used govt. Reports, researchpapers, magazines etc. for secondary data. 3 different round of survey were made for designing the questionnaire.
1. 1P
st
P
round Survey – for collection of Domains / parameters 2. 2P
nd
P
Round Survey – for ranking of parameters & sub domains 3. 3P
rd
P
round survey – to assign PIU.
Designing of questionnaire
After 3P
rd
P
round survey questionnaire were designed keeping in mind for calculating QoWL on index concept. Concept of optimum pathway matrix developed by ODUM et al was considered. Indicators were grouped into 4 categories on basis of needs of human (basic, well being needs, opportunity needs, amenity needs) & 15 domains/parameters and 68 sub domains. Unitization information of each factors were for each alternatives were developed.
Si = 1 ( Max CRy1R, CRy2R, ……. ) whereCRy1R, CRy2R, ……. = values of different responses &UVRizR = SRi RX CRyij
CR1R = xRi1R, CRnR = CRn-1 RXRn,n-1R, XRnnR, CRiR= XRi-1 jR CRi-1R where CR1 R= Cumulative importance of 1P
st
P
row, CRn R= Cumulative importance of nP
th
P
row excluding 1P
st
P
& last row categories, CRi R= Cumulative
importance for last but one row., XRijR = Value of ‘p’ for ith row over jP
th
P
column Cyi = (1/n) ∑ 𝐶Rik where, RCRyR is the average cumulative importance.
Unitised information were further administered to develop Parametric importance unit (PIU) for each of the subdomains/indicators/sub parameters. Now the questionnaire took the final shape for its administration over the sampled workforce in the study area.
Selection of Sample
35
SOCIAL STRUCTURE OF THE AREA
The following section explains the Social structure of the study area.
Caste structure :
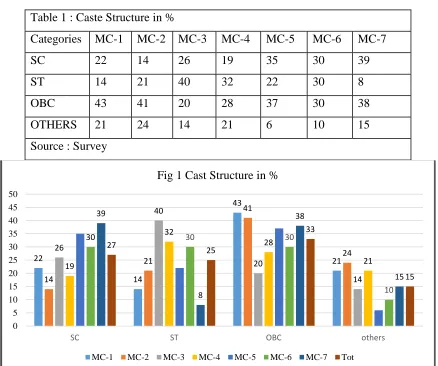
Table 1 : Caste Structure in %
Categories MC-1 MC-2 MC-3 MC-4 MC-5 MC-6 MC-7
SC 22 14 26 19 35 30 39
ST 14 21 40 32 22 30 8
OBC 43 41 20 28 37 30 38
OTHERS 21 24 14 21 6 10 15
Source : Survey
Dominance of SC & ST (52%) were observed in the sample drawn in the study area the population comprises of 27 % of SC, 25 % ST, 33 % OBC, and remaining 15 % others .
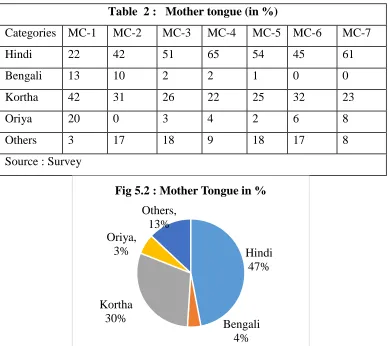
Mother tongue : The study area represents a multilingual pattern. Fig 2 reveals that Hindi and Khortha speaking covering about 77 % of the workers dominate the area. The rest includes Bengali spoking (4 %), Oria (6 %), others (13 %), which includes people speaking Bhojpuri, Magahi, Urdu, Panjabi, Tamil etc. as shown in table no. 2.
22 14 43 21 14 21 41 24 26 40 20 14 19 32 28 21
30 30 30
10
39
8
38
15
27 25
33 15 0 5 10 15 20 25 30 35 40 45 50
SC ST OBC others
Fig 1 Cast Structure in %
36
Table 2 : Mother tongue (in %)
Categories MC-1 MC-2 MC-3 MC-4 MC-5 MC-6 MC-7
Hindi 22 42 51 65 54 45 61
Bengali 13 10 2 2 1 0 0
Kortha 42 31 26 22 25 32 23
Oriya 20 0 3 4 2 6 8
Others 3 17 18 9 18 17 8
Source : Survey
After 1P
st
P
round survey parameters and sub parameters were identified by different expert through questionnaire. Domains includes parameters like Housing, Clothing, Food, Energy, water supply & Cleanliness, Health, Employment & working conditions, Social Security, Income, Education, Transportation, Communication, Addiction, Recreation. Total sixty eight numbers of subdomain identified for the study.
The sub-parameter or sub domain were grouped in parameters or domains. These domains were further grouped on the basis of various need. Description of respondents of study area for various domains included in the study are:
Housing : Sampled workforce living in the company quarters are satisfied with the light and ventilation (60%) but are dissatisfied with the sanitation and hygiene (55%). Similarly majority of them are not satisfied with measures taken against insects, rodents etc which are a source of diseases as well as irritation. This can be a possible area of company action that may lead to
Hindi 47%
Bengali 4% Kortha
30% Oriya,
3%
Others, 13%
37 higher QoWL. A huge majority about 80% does not perceive maintenance of housing as satisfactory.
Food :According to study the majority of worker consume rice (88%) as their main food. Little high consumption in vegetables were observed, may be due to the village nearby, where cheap and fresh available vegetables are abundantly available. About 75% of sampled workforce consumes less than 0.5 liters of milk per family. They believe on non-vegetarian food. There is no constant pattern observed. But 76 % of the sampled workforce are satisfied with their food habits. Irrespective of that about 28-41% of the workers at different complexes are dissatisfied. This may be due to various reasons. This is primarily due to the fact that distribution system does not ensure availability to every needy worker in adequate quantity at some of the complexes.
Fuel :A good proportion of workers cook their food in the same room in which they leave. They used coal for cooking their food as Coal is abundantly available in the study area. Though there is reimbursement facility of cooking LPG gas but as per survey about 80% of them finds comfortable in using coal as main fuel. 59% of the sampled work force uses supply water being drawn from nearby river treated & supplied by Coal Company for drinking purpose. Mine water are rarely reported being used for drinking water. The coal company is now on the job of using mine water with the help of IRCTC. About 50% or even more of the workers are satisfied with quality, quantity, cleanliness and storage facilities of the supply water. However there was about 27-30% of dissatisfaction among the workers. The main source of water supply are pipelines and Wells. Overall quality and availability of drinking water are perceived as satisfactory.
Health:The sampled workforce were not in their proper health because of their working style and working environment..The common ailment includes cold & cough and other lung infections (58%), Dysentry (5%), Diarrhea (6%), Malaria (14%). The reasons may be obvious - air pollution & poor Sanitation. More than 50% of the workers are dissatisfied with the medical facilities available in the study area. Among these the conditions of governmental hospitals and dispensaries are the worst.
38
Transportation: The majority of workforce owns cycle (58 %) and scooters (35%) for attending duty & other works. Very few owns four wheelers. However many people owning four wheelers were not willing to admit this. Company conveyance are available mostly for education and health purposes to the employees. On few occasions these facilities are also made available for recreation i.e. for picnic, site seeing, mela etc. only nine percent of the workers are availing transportation facilities for going to work place. This may be due to that these facilities are not regular and also the workers are getting transport subsidies, if they uses their own means of transportation.
Addiction: Addictionsituation is not very alarming. The analysis shows that there is around 40% addiction to chewing tobacco followed by alcohol. Addiction to drugs are not there.50% of the workers knows the implications and consequences of the environmental pollution at all the mining complexes except at MC-5, where only 26 % of the workers are expressing their affirmations. This mining complex is situated in the most remote and backward area. This may because of the lower level of awareness regarding environmental concerns.
Employment & Working conditions: As per surveyit has been observed that most of the workers are satisfied with their work and work place security. About 22 % of them are dissatisfied with safety of work& working condition at the work place. About 40-60 % of the workers are dissatisfied with the environmental conditions prevailing in the different complexes. Pollution loads are increasing day by day. The scenario of sanitation facilities specially garbage removal and CCL efforts towards mitigation and control measures of environment shows dissatisfaction of about 60% or more among the workers.
Income: From the questionnaire survey it was observed that the worker is the only earning member in his family. Only exceptionally other family members were employed. it was observed that about 64% of the workers of study area were satisfied with wage and perks. It may be due to their recent pay revision. Even though they had to borrow loans for fulfilment of their needs
39 About 26% of them expressed dissatisfaction and feel the needs of more savings for future. 45% of sampled work force were dissatisfied with the work of public representatives. This might be more as that some of the work force were reluctant as a fear or threat from the local representatives and the union of workers to which they are affiliated. About 57 % affirmed that they do not have life insecurity while at work place.
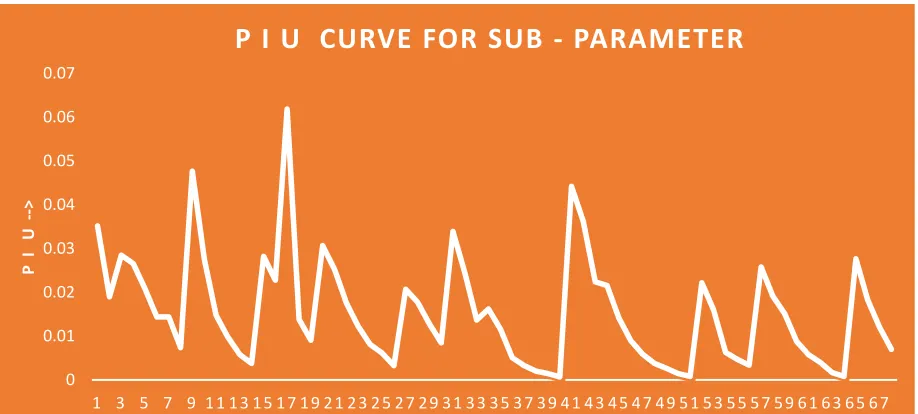
DEVELOPMENT OF PARAMETRIC CURVE :
On the basis of 3 round of questionnaire survey parametric Importance unit & curves were developed.
for different needs, Domains/ parameters & Sub domains/ sub parameters.
0.0000 0.0500 0.1000 0.1500 0.2000 0.2500 0.3000 0.3500 0.4000
Basic need Well Being Need Opportunity
Need Amenity Need
PIU
PARAMETRIC IMPORTANCE CURVE FOR NEEDS
0 0.02 0.04 0.06 0.080.1 0.12
P I U
40 With the help of the curves developed one can assess the QoWL for particular parameters, sub-parameters directly without much exercise only after knowing the satisfaction level by using equation 1.
RESULT:
PIU along with QoWL on the administering questionnaire survey over the sampled population in the study area has been tabulated at table no. 3.
Table 3 : Overall QoWL at Study Area PIUs Existing QoWL Percentage
achievements
Basic needs 0.3629 0.2114 58
Well being needs 0.2757 0.2114 64
Opportunity needs 0.2151 0.1186 55
Amenity needs 0.1463 0.0827 57
From the table 3, it was observed that the corresponding PIU for various needs viz. Basic, Well being, Opportunity & Amenity needs were 0.3639, 0.2757, 0.2151, 0.1463 respectively and
0 0.01 0.02 0.03 0.04 0.05 0.06 0.07
1 3 5 7 9 11 13 15 17 19 21 23 25 27 29 31 33 35 37 39 41 43 45 47 49 51 53 55 57 59 61 63 65 67
P I
U
-->
41 against this we find that the overall QoWL index level as 0.2114, 0.1769, 0.1186, 0.0827 respectively, thereby making percent achievement as 58%, 64%, 55% , 57% respectively.
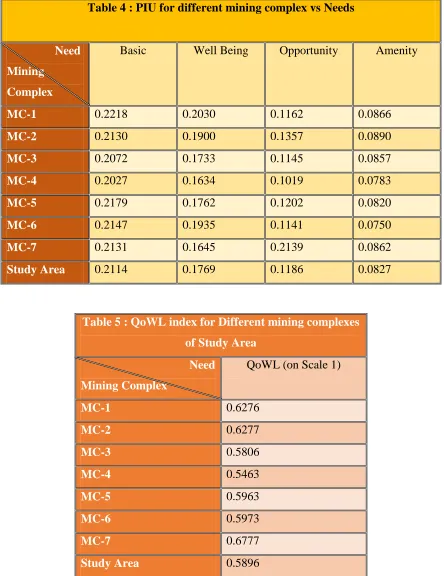
Table 4 : PIU for different mining complex vs Needs
Need
Mining
Complex
Basic Well Being Opportunity Amenity
MC-1 0.2218 0.2030 0.1162 0.0866
MC-2 0.2130 0.1900 0.1357 0.0890
MC-3 0.2072 0.1733 0.1145 0.0857
MC-4 0.2027 0.1634 0.1019 0.0783
MC-5 0.2179 0.1762 0.1202 0.0820
MC-6 0.2147 0.1935 0.1141 0.0750
MC-7 0.2131 0.1645 0.2139 0.0862
Study Area 0.2114 0.1769 0.1186 0.0827
Table 5 : QoWL index for Different mining complexes
of Study Area
Need
Mining Complex
QoWL (on Scale 1)
MC-1 0.6276
MC-2 0.6277
MC-3 0.5806
MC-4 0.5463
MC-5 0.5963
MC-6 0.5973
MC-7 0.6777
42 The mine complex wise figures as shown at Table R2 & Table R3 points out a scope for
improvement to a fair degree. There are organizations in the country where quality of work life is much higher. Of course there are several other issues involved like nature of work, place of operation of the company, the nature of work force mix etc.
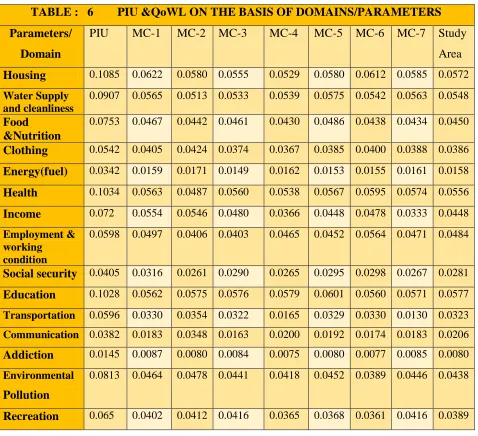
TABLE : 6 PIU &QoWL ON THE BASIS OF DOMAINS/PARAMETERS
Parameters/
Domain
PIU MC-1 MC-2 MC-3 MC-4 MC-5 MC-6 MC-7 Study Area
Housing 0.1085 0.0622 0.0580 0.0555 0.0529 0.0580 0.0612 0.0585 0.0572
Water Supply and cleanliness
0.0907 0.0565 0.0513 0.0533 0.0539 0.0575 0.0542 0.0563 0.0548
Food &Nutrition
0.0753 0.0467 0.0442 0.0461 0.0430 0.0486 0.0438 0.0434 0.0450
Clothing 0.0542 0.0405 0.0424 0.0374 0.0367 0.0385 0.0400 0.0388 0.0386
Energy(fuel) 0.0342 0.0159 0.0171 0.0149 0.0162 0.0153 0.0155 0.0161 0.0158
Health 0.1034 0.0563 0.0487 0.0560 0.0538 0.0567 0.0595 0.0574 0.0556
Income 0.072 0.0554 0.0546 0.0480 0.0366 0.0448 0.0478 0.0333 0.0448
Employment & working condition
0.0598 0.0497 0.0406 0.0403 0.0465 0.0452 0.0564 0.0471 0.0484
Social security 0.0405 0.0316 0.0261 0.0290 0.0265 0.0295 0.0298 0.0267 0.0281
Education 0.1028 0.0562 0.0575 0.0576 0.0579 0.0601 0.0560 0.0571 0.0577
Transportation 0.0596 0.0330 0.0354 0.0322 0.0165 0.0329 0.0330 0.0130 0.0323
Communication 0.0382 0.0183 0.0348 0.0163 0.0200 0.0192 0.0174 0.0183 0.0206
Addiction 0.0145 0.0087 0.0080 0.0084 0.0075 0.0080 0.0077 0.0085 0.0080
Environmental
Pollution
0.0813 0.0464 0.0478 0.0441 0.0418 0.0452 0.0389 0.0446 0.0438
Recreation 0.065 0.0402 0.0412 0.0416 0.0365 0.0368 0.0361 0.0416 0.0389
43 Statistical Tools Applied
Data analysis is an attempt to organize andsummarize the data in order to fulfill the objectives. Varietiesof analytical and statistical tools are being used for coding anddecoding of data, analysis of data and for establishingrelationship among various factors. The results were tested by Mann-Whitney U Test. It is a non-parametric test or distribution free test used for statistical or inferential analysis. The Mann-Whitney U test is used tocompare differences between two independent groups when thedependent variable is either ordinal or continuous, but notnormally distributed. For testing whether variable/parameters used in the regression equation for predicting the assessed value of quality of work life of coal mining complexes in the study area is useful or not, t- test were performed.
Mann-Whitney U Testwere used to test whether the samples from different mining complexes
have been drawn from the same population. This is a most powerful non parametric test as it could be used for both qualitative and quantitative data. It is very useful to test when one may wish to avoid the assumption of t test.
The null hypothesis to be tested in this case is Ho : Two samples come from different population H1 : Two samples come from identical population We obtained the value of
U = UR1R + UR2
UR1R = {nR1RnR2R + [ nR1R (nR1R+1)/2]-RR1R}
UR2R = {nR1RnR2R + [ nR2R (nR2R+1)/2]-RR2R}
Where,
RR1 R= Sum of the ranks of the values of the first sample
RR2 R= Sum of the ranks of the values of the second sample
nR1 R= number of element in the first sample
nR2 R= number of element in the second sample
U= Calculated Mann-Whiteny U value
UR1 R= Calculated Mann-Whiteny U value for the first sample
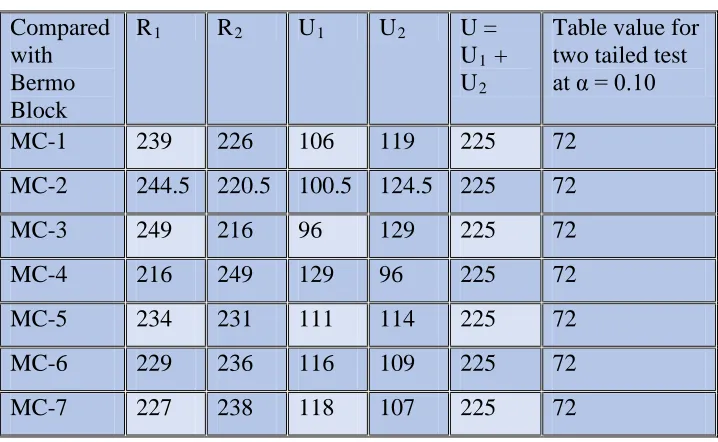
44 Here nR1R= 15 & nR2R = 15 compared with Bermo block
Compared with Bermo Block
RR1 RR2 UR1 UR2 U =
UR1R +
UR2
Table value for two tailed test at α = 0.10
MC-1 239 226 106 119 225 72 MC-2 244.5 220.5 100.5 124.5 225 72 MC-3 249 216 96 129 225 72 MC-4 216 249 129 96 225 72 MC-5 234 231 111 114 225 72 MC-6 229 236 116 109 225 72 MC-7 227 238 118 107 225 72
Since calculated U = 225 for all the sample is more than 72, the value U for two tailed test at α = 0.10, we find that the null hypothesis must be rejected and null hypothesis to be selected.Hence the sample selected and the elements in the different sample come from the same population. In t- test the absolute value of t were found greater than the t-critical value for each respective parameter, hence the null hypothesis was rejected and the alternative hypothesis was accepted, which implied that the variable/parameters used in the above regression equation are useful in predicting the assessed value of quality of work life of coal mining complexes in the study area.
Conclusion:
45 are some sub-parameters where personality rather than company interventions are crucial. It is personal life style and attitude that will be important. For instance expenditure on food. In this case awareness and concern about health are the determining attributes. Complexes which we have studied are remotely located and not well connected with cities or townships and hence company support for effective road communication is important in improving QoWL. Subjective and objective conditions here are quite different so, even though availability of transportation facilities are there through external sources. The perception is that company transport facilities are poor. This may be possible area for improvement for the company which may help in bringing the worker closer to the company. Company intervention needs to be planned.
On one important sub-parameter i.e. addiction, related to carving for drugs and alcohol, the situation is not very alarming. Still the company needs to take into account the fact that is one area where quality of work life should be 100% as compared to what it is i.e. overall 60%. 100 % of the quality of work life here means no alcoholism and drug addiction, because this leads to several other evils like indebtedness, absenteeism, accident, disharmony, family tension etc. This has to be achieved through generating awareness and educating the people about negative effects of addictions. Company intervention is also required to provide financial support to avoid in debtless. Individual or separate counselling seems to be essential for upliftment of socio economic conditions of the study area.
Limitation
The responses given by the subjects and time of completion of project were the limitation of the study.
Delimitation
• For data collection researcher only used questionnaire & interview method
• For interview only Piece Rated workers were chosen
• Study of coal mining workers of Bermo block were made on the basis of primary data.
Acknowledgement
46 thank Prof (Dr) Pramod Pathak, IIT(ISM), Dhanbad for his support for completing this study. The views presented by author is outcome of the study and is solely his interpretation.
REFRENCES :
Datta, G.D. (1976), “Improving quality of work Life – Some Selections and Concrete Experience.” Paper presented in the workshop ‘Quality of Work life’ organized by the National Labour Institute, Delhi.
Kumar M (2004), “Quality of Worklife of coal mining workers – A Case Study”, PHD thesis (Unpublished).
Kumar Manoj (2001), “Quality of work life of coal mines”, MBA Thesis (unpublished). Kumar M (2001), “Quality of life at mining complexes”, Certificate of Environmental studies,
(Unpublished), IGNOU – New Delhi.
MS-10 : organizational design, development and change PP 16 : unit 7 Quality of working life : booklet 3 “work organization .
Need to change in socio-cultural condition, Quality of working life, Indira Gandhi National Open University (Course material), 1999.
Panda, N., Pal, A. K. and Saxena N. C. (2001), “Quality of life for socio-economic development”, ENVIS Monograph, No. 7.
Seema Awasthi and Padam S. Bisht. (2017), Socio-Economic Condition of Chikan Workers of Kakori Block In Lucknow. Int J Recent Sci Res. 8(9), pp. 19841-19844.
Singh, S. K (2015), “Quality of life in Lucknow : A principal component of analysis”, Indian Journal of Economics & Business, Vol 14, No. 1, pp 107-114
Strauss, G (1976). “Worker attitude and adjustments” in Rosow, J. (ed.) The workers and the job. N.J. : Prentice hall.