Aerial Photo Interpretation
on British Columbia Rangelands
T. M. LORD AND ALASTAIR MCLEAN Soil Scientist and Plant Ecologist, Canada Department of Agriculture, Research Station, Vancouver and Kamloops.
Highlight
Following intensive study of soils and plant communities in the Princeton area of southern British Columbia, it became apparent that photo interpretation techniques could be used to greater advantage in soils surveys and land classification than as simply field mapping guides. Significant relationships between soil-vegetation-physio- graphic units and photo patterns appeared. The area, a topographic low within the Thompson Plateau, contains mainly Chernozemic soils developed under grassland and open tree cover. Six land units were distinguished by combinations of tone, pattern, and texture on aerial photos as determined by topography, nature of bedrock or surficial deposits, drainage, kinds of vegetation, and patterns of micro-features and were related to land use.
This
study indicates
how some characteristic
aerial-photo
patterns of vegetation and land forms
were used as an aid to soils survey and land classifi-
cation in the Princeton
basin, a local topographic
low of some 75 square miles, in southern interior
British Columbia.
During the departmental
soil survey and map-
ping of the Princeton
district (Green, Lord, and
Hortie, 1963) aerial photographs were used mainly
as field mapping guides. Following intensive study
of soils and plant communities
(Lord and Green,
1969) it became apparent that photo-interpretation
techniques
(Buringh,
1954; Colwell,
1960) could
be used to greater advantage in soil surveys and
land classification
in this region similar to that
done in Australia (Gibbens and Downes, 1964).
The basin contains mainly Black and Dark Gray
Chernozemic
soils under grassland and open tree
cover and is surrounded by Podzolic and Brunisolic
soil areas (soils nomenclature
follows the Canadian
classification
system (Leahey, 1965)) of the forested
plateau.
The vegetative zones of the study area have been
classified
by McLean
(1969) as ponderosa
pine,
douglasfir, and subalpine
fir.
Mathews
(1944) and Hills (1962) investigated
the glaciation
of the Princeton
coalfield,
while
Rice (1960) described the geology of the area. A
drumlinized
till plain occupies most of the basin
area. The few large drumlins
are composed of
thick glacial till.
However,
over areas of more
gentle relief the till ranges in thickness from about
10 ft to a fraction of a foot on abraded rock ridges.
The textures of the till reflect the composition
of
the underlying
sedimentary
rocks and lavas, and
the nearby granitic intrusives.
Extensive
gravelly
outwash deposits cover the main valley floor and
mantle
the beds of former meltwater
channels.
Terraces,
pitted outwash, fans, and alluvial flood-
plains are the major land forms of the valleys.
filethods
Valley bottomlands and much of the basin area have been soil surveyed in detail (Green et al., 1963). The remainder of the area encompassed within the photo has received a reconnaissance soil survey (Lord and Green,
1969). The vegetation was classified ecologically and the major plant communities described. One aerial photo- graph (Fig. 1) of the northern section was selected to illustrate soil-vegetation-terrain units.
In order to determine broad patterns of vegetation, drainage, and terrain, the photographs were first studied as a mosaic. Then the major landscape units formed by tonal and textural images of landform, slope, drainage, and vegetation under the stereoscope were delineated on the photograph. The boundaries on this photo-interpreta- tion map were then checked in the field by standard soil survey procedures and observations of vegetation and landform.
Plant nomenclature follows Hitchcock et al. (1955, 1959, 1961, 1964) for the dicots and Davis (1955) for all other plants.
Results and Discussion
The three major landscape units identified
and
delineated
on the photograph
(Fig. 1) are:
Unit A (four subunits)-smooth
glaciated
up-
lands, grass or tree covered.
Unit B-irregular
steeply-sloping
valley sides.
Unit
C (two subunits)-narrow,
irregularly-
shaped valley bottoms and terraces associated with
drainage courses.
Each unit and subunit is described by its char-
acteristic landform, plant community, and soil pat-
tern and is correlated with its photo image. Two
stereograms
(Fig. 2) illustrate
typical units and
subunits; in the lower stereopair the two subunits
of Unit C are delineated.
Unit A.
This major unit includes the upland areas of the
basin and part of the plateau above the valley
steeplands.
Four subunits are described below.
Subunit
A
I.-Occasional
large drumlins,
ori-
ented in the direction
of the southerly ice flow,
interrupt
the generally subdued rolling landscape.
Over most of the area, moderately coarse textured
till deposits form a smooth mantle over bedrock.
Photo Pattern.-The
uniform light tone, slightly
mottled
texture,
and absence
of tree
cover
help to separate this grassland unit from the treed
areas. It is further distinguished
from other grass-
lands or clearings
by topographic
position,
den-
dritic drainage network, fluted pattern, and lack
of current scars.
6
LORD
AND MCLEAN
the darker-toned
“speckled”
photo image caused
by growth of different
tree species.
Additional
diagnostic features are: lack of an integrated drain-
age pattern, numerous
dry gullied channels, and
the pattern of farm clearings.
Soils.-Soils
of the Podzo Regosol Great Group
occupy most of the subunit.
Cutanic Podzo Reg-
osols developed
on sandy loam and loamy sand
till (Shisler series), merge with Dark Gray soils
developed on these materials
along the grassland
boundaries
and in forest clearings.
Some of the
associated soils have morphological
features of the
Western
Brown Forest soils of the USA.
Vegetation.-Plant
communities
of the douglas-
fir zone occupy most of this subunit.
The forest
cover is open to medium dense, and is dominated
by douglasfir
(Pseudotsuga
menziesii)
associated at
lower elevations with ponderosa pine and at higher
elevations
with lodgepole
pine
(Pinus contorta).
Aspen is often a prominent
tree of the forest open-
ings on the deeper soils. Two principal plant com-
munities
dominate.
The drier community,
gen-
erally at low elevations,
is douglasfir-idaho
fescue.
Pinegrass
(Calamagrostis
rubescens),
idaho fescue,
and bluebunch
wheatgrass characterize
the ground
cover. This community
is most commonly found
on the Dark Gray soils. The community on less dry
sites is the douglasfir-pinegrass
community
which
is found largely on Cutanic Podzo Regosols and
some Orthic
Gray Wooded
soils.
The
ground
cover is dominated
by pinegrass associated
with
bearberry
(Arctostaphylos
uva-ursi),
northwestern
sedge
(Carex concinnoides),
and whitetop spiraea
(Spiraea betulifolia).
Correlation.-The
distinctive
relief and vegeta-
tive pattern of the photo image was borne out by
field observations.
Clearings
within the subunit
and along grassland boundaries
need careful field
checks.
Land Use.-This
subunit is well suited to in-
tegrated
use, producing
a medium
dense forest
which also yields a significant
volume of forage.
These areas have a low-medium
growth potential
for douglasfir
and ponderosa
pine (average site
indexes 70 and 80 respectively).
Sites without sig-
nificant
tree influence
have an average carrying
capacity of 5 to 7 acres/animal-unit-month.
The
subunit is used for summer range for cattle and for
the harvest of douglasfir and ponderosa pine.
Subunit
A
3.-Glacial
flutings and drumloidal
forms are characteristic
of this subunit.
Photo Pattern.-The
dark gray tones, uniform
texture, and linear pattern are distinctive
features
of the photo image.
The
pattern
of modified
trellis drainage with narrow irregularly-shaped
de-
pressions, light-toned rock outcrops and low ridges
are further aids to identification.
Soils.-A
catenary sequence of Podzolic soils oc-
curs on the moderately
coarse textured till of the
drumlinized
uplands.
Bankeir
soils, Orthic Acid
Brown Wooded sandy loams, occupy abraded bed-
rock ridges and crest positions of drumlins.
Well-
drained Degraded Acid Brown Wooded Mazama
soils occur on drumlin
slopes.
In toe-slope and
depressional
positions Gleyed Gray Wooded, Cut-
anic Regosol, and Organic soils are the main soil
associates.
Vegetation.-Plant
communities
of the subalpine
fir zone occupy most of this subunit.
The major
plant community
is subalpine
fir-pinegrass
which
is a well-developed
ecotone between the douglas-
fir-pinegrass
and subalpine
fir-blueberry
commu-
nities.
The community
is found mostly on the
Acid Brown Wooded soils. The dominant tree at
present is lodgepole
pine with reproduction
in-
dicating a trend towards engelmann
spruce
(Picea
engelmanni)
and subalpine
fir
(A bies Zasiocarpa).
Grouse whortleberry
(Vaccinium, scoparium),
pine-
grass, and twinflower
(Linnaea borealis)
dominate
the ground cover.
An important
community
associated with the
subalpine
fir-pinegrass
on Gleyed Gray Wooded
and other imperfectly
drained soils is subalpine
fir-bunchberry.
This community
is characterized
by dense stands of subalpine
fir and engelmann
spruce.
Lodgepole
pine and douglasfir
are im-
portant seral trees. The ground cover is charac-
terized by bunchberry
(Cornus
canadensis),
side-
bells pyrola
(Pyrola secunda)
and twinflower.
Correlation.-In
part,
the placement
of the
boundary
line between this unit and the upper
limit of the steeplands is dependent
upon slope,
aspect, field experience,
and photo quality.
Under
some conditions
the two units appear to merge.
Land Use.-The
upland portion of this forested
subunit usually has a low rating for tree produc-
tivity. It is a poor site for the growth of subalpine
fir but medium
for spruce, lodgepole
pine (site
index SO), and douglasfir
(site index 70). The
forage values are low except when the tree canopy
is reduced, when the carrying capacity may increase
to about
7
acres/animal-unit-month.
The associ-
ated subalpine fir-bunchberry
plant community on
imperfectly
drained soils is usually rated high for
timber production
with site indexes in excess of
100 for douglasfir,
engelmann
spruce, lodgepole
pine, and subalpine fir. Forage values are usually
low because of the heavy shrub cover.
Subunit
A
4.-Although
this subunit
is not
clearly represented
on the aerial photograph,
it is
characterized
by a drumloidal landscape, frequently
interrupted
by rock outcrops and thinly mantled
rock ridges.
PHOTO
PATTERNS
7
Soils.-Orthic
Gray Wooded soils belonging
to
Connaly series are the major soils developed
on
sandy loam and loam till. They are mainly associ-
ated with Podzo Regosols and Dark Gray soils on
the lower boundaries,
and with Brunisolic
soils at
higher elevations.
Vegetation .-A
moist phase of the douglasfir-
pinegrass
community
dominates
this map unit.
Douglasfir
is the dominant
tree while lodgepole
pine is an important seral species. The tree canopy
is generally
denser than that of the type com-
munity.
It is also distinguished
by a greater abun-
dance of false box
(Pachistima myrsinites),
prince’s
pine
(Chimaphilla
umbellata)
and twinflower.
Correlation.-The
boundary
area between
the
Gray Wooded
and the lower Regosol
unit is
transitional
and unreliable
without
close field
checks. The upper limits into the Brunisolic
zone,
however, show a good correlation.
Land Use.-This
subunit is related in use to sub-
unit A 2 but because of the better forest growth,
mostly of douglasfir
and lodgepole,
the timber
values are higher and forage values lower except
on recently logged areas.
Unit B.
This unit has long steep slopes usually associated
with valley sides.
Photo pattern.-Irregular
light and dark tones
are imparted by abrupt changes in vegetation and
drainage as well as by rock bluffs and talus slopes.
Southerly aspects reflect a more variegated lighter-
toned image than do the northerly exposures.
Soils.-Regosol
soils occur with rockland on the
valley slopes. Alleyne soils, Cutanic Podzo Regosol
sandy loams, have developed on coarse colluvium
and till under tree cover. Orthic Dark Gray soils
of the Darcy series are associated with grass and
shrub cover on dry southerly aspects of the steep-
lands.
Vegetation.-
This unit occurs mostly within the
douglasfir zone. A variety of communities
may be
found, depending
on microclimate
and soil mois-
ture, such as douglasfir-fescue
and douglasfir-pine-
grass.
On steep south-facing
slopes at lower
elevations,
especially on talus slopes, a douglasfir-
bluebunch
wheatgrass community
is found usually
on Regosols.
This community
is characterized
by
open
stands of slow-growing
douglasfir.
The
ground cover is sparse and consists mostly of blue-
bunch wheatgrass and clubmoss
(SeZagineZZa wal-
Zacei)
with scattered saskatoon service berry
(Ame-
Eanchier alnifolia).
Correlation.-These
are generally distinct terrain
units with sharp boundaries.
Following field check
confirmation,
the photo interpretation
units may
be used as final map units.
Land Use.-This
unit supplies a significant
vol-
ume of forage on south- and west-facing
slopes
where the slope is not too steep or footing unstable
for cattle.
Timber
values vary from poor to me-
dium depending
on available
moisture
but the
site is not suited to intensive timber management.
Unit C.
This
unit includes
glacio-fluvial
terraces and
alluvial floodplains.
Pitted outwash and fans as-
sociated with valley deposits are present as minor
components.
The photo patterns have the even
tones and textures reflected by the level topogra-
phy and surface features
of water-laid
deposits.
The agricultural
use of these lands is illustrated
by the patterns of fields, roads, and buildings.
Two subunits can be identified.
Subunit
C
I.-The
glacio-fluvial
terraces
are
composed of thick, bedded, gravelly materials with
level surfaces scarred by meander marks and small
oxbows.
Photo Pattern.-The
level terraces adjoining the
till plain have grayish tones modified
by lighter
streaks and the pattern of sparse tree cover.
Soils.-Major
soils belong
to the Dark Gray
Great Group.
These are Whipsaw, a Rego Dark
Gray soil and Galena, an Orthic Dark Gray soil.
These soils, developed on shallow sandy loam over-
lying deep gravels, are often associated with Asp
series, a Degraded Brown Wooded soil.
Vegetation.-The
principal plant community on
these benches is ponderosa pine-fescue.
The com-
munity typically is characterized
by Savannah-like
stands of ponderosa pine; some douglasfir may or
may not be present. The ground cover is essentially
grassland in nature being dominated by bluebunch
wheatgrass,
idaho fescue,
eriogonum
and silky
lupine.
The removal of trees usually makes little
difference
to the stand composition.
This com-
munity is found mostly associated with the Dark
Gray soils; associated
Degraded
Brown Wooded
soils usually support
the douglasfir-fescue
com-
munity.
Correlation.-These
are well defined units under
stereo vision, with excellent ground correlation.
Land Use.-This
subunit is suited to integrated
use. In most cases the forage values outweigh the
timber values. It provides valuable feed for spring
and fall grazing which is in critical supply in the
region. Where trees do not depress the herbaceous
growth the carrying capacity is about 5 acres/ani-
mal-unit-month.
It is a poor low-medium site for
the production
of ponderosa pine (site index 65-
70). Where stones are not a serious handicap the
soil may be irrigated for forage crops.
Subunit C
2.-The
recent alluvial terraces occur
along stream courses.
8
LORD
AND MCLEAN
along the meandering
streams of valley bottom-
lands.
Soils.-Well
drained Riddell soils are associated
with other members of the Rego Dark Gray Sub-
group on moderately
coarse textured
materials.
Undifferentiated
gravelly Regosols were mapped
as a soil complex along stream courses.
Vegetation.-The
vegetation
on these lower
benches has not stablized or approached
climax
and as a result is extremely variable.
It is generally
a complex
of cottonwood
(Popdus
trichocar-pa)
and aspen with some douglasfir and spruce repro-
duction.
Western
redcedar
(Thuja
plicata)
is
sometimes
found adjacent
to the river bank.
A
variety of shrubs occurs; the most common shrub
is snowberry
(Symphoricarpos
albus)
on the more
stabilized terraces. A number of grasses are found,
the most common of which is kentucky bluegrass,
especially on areas used as pasture.
Correlation.-The
boundaries
drawn under the
stereoscope correlate
well with field checks. The
small patchwork
pattern of fields and clearings
requires close checking of soils and vegetation
in
order to define final map units. The minor com-
ponents of the photo pattern, the fans and pitted
outwash, are sharply defined in the photo image
and on the ground, but the soil and vegetation re-
lationships are frequently complex.
Land Use.-Where
the shrub cover is not too
dense, this subunit
may supply some pasturage.
Cleared sites where some topsoil is present and
the profile not too cobbly, may produce good tame
pasture or hay with irrigation
or spring flooding.
Conclusions
Aerial photo interpretation
proved to be a useful
early step in a soil survey in the Interior
Plateau
region of southern British Columbia.
It was pos-
sible to identify photo patterns which correlated
well with soil and vegetation
units, in a similar
way to that used by Dormaar and Lutwick (1966)
and the Soils Survey Staff (1966).
In our study
correlation
was usually
obtained
at the Great
Group level.
Three
major landscape units were
distinguished
and described in the Princeton basin.
The first unit (A) was the grass- or tree-covered
uplands and plateau area which was subdivided
into four subunits, each with distinct terrain, soil,
and vegetation characteristics.
The first subunit, the till plain at lower eleva-
tions, was separated on the photograph
by a uni-
form tone and distinct landform
pattern.
It was
found mostly on Black, Dark Brown, and Dark
Gray soils associated with the idaho fescue-eriog-
onum
and
ponderosa
pine-fescue
plant
com-
munities.
In the second subunit a pattern of gullies and
low knolls dissect the till plain.
They, however,
lack an integrated
drainage
pattern and form a
light-toned speckled image on the photograph.
The
soils belonged
to the Podzo Regosol group and
supported
plant communities
of the douglasfir
zone.
The higher elevations on the till plain formed a
third subunit distinguished
by tone, texture, and
a linear pattern on the photograph.
The soils were
mostly Acid Brown Wooded associated with the
‘subalpine fir-pinegrass
plant community.
The drumloidal
landscape of the fourth subunit
shows a dark color but with considerable
contrast
in the photograph.
The
characteristic
Gray
Wooded soil supported a moist phase of the doug-
lasfir-pinegrass
plant community.
The second major subdivision (B) was considered
to be the steeply sloping valley walls. Irregular
tones on the photograph
are caused largely by
abrupt changes in vegetation,
slope, and aspect.
The dominant soils were Regosols associated with
the douglasfir-pinegrass
community although Dark
Gray soils supporting
the douglasfir-fescue
com-
munity were common on the drier sites.
The third subdivision
(C) was that of the valley
bottoms and low terraces.
The level terraces and
surfaces scarred by meander marks and patterns
of agricultural
use were distinct on the photograph.
The terraces adjoining the till plain had a distinc-
tive grayish tone. Dark Gray soils predominated
along with Regosols and supported the ponderosa
pine-fescue
and douglasfir-fescue
communities
re-
spectively.
Although
subunits
C 1 and A 1 have similar
vegetation
and are both areas of chernozem soils,
the soil associates, parent materials, and landscape
units are quite different and, therefore, have to be
separated.
The recent alluvial
terraces appeared
on the
photographs
as narrow
patchwork
units along
streams.
The soils were mostly Regosols and the
vegetation was an unstabilized
complex of decidu-
ous trees and shrubs usually with some conifers.
Aerial-photo
interpretation
was a very useful
technique,
prior to and in conjunction
with a
ground survey, in classifying land. Correlation
of
soils, vegetation and terrain was generally good.
LITERATURE
CITED
BURINCH, P. 1954. The analysis and interpretation of aerial photographs in soil survey and land classification. Neth. J. Agr. Sci. 1, 4. p. 251-255.
COLWELL, ROBERT N., EDITOR IN CHIEF. 1960. Manual of photographic interpretation. American Society of Photo- grammetry. 868 p.
DAVIS, R. J. 1955. Flora of Idaho. W. C. Brown. Du- buque, Iowa. 828~.
FEDERAL
land in South-Western Victoria. Soil Conserv. Authority, Victoria, Australia. 289 p.
GREEN, A. J., T. M. LORD, AND H. J. HORTIE. 1963. Soil survey of the Similkameen and Tulameen valleys in the Princeton area of British Columbia. Contrib. 37. Can. Dep. Agr., Res. Sta. Vancouver, B.C. 123 p.
HILLS, L. V. 1962. Glaciation, stratigraphy, structure and micropaleobotany of the Princeton Coalfield, British Columbia. M.S. Thesis, Dep. Geology, University of B.C.
19 p.
HITCHCOCK, C. L., ARTHUR CRONQUIST, MARION OWNBY, AND J. W. THOMPSON. 1955, 1959, 1961, 1964. Vascular plants of the Pacific Northwest. University of Washing- ton Press. Seattle. 4 Vol.
LEAHEY, A., CHAIRMAN, N.S.S.C. 1965. Report of the Sixth Meeting of the National Soil Survey Committee of Canada. Lava1 University, Quebec. 132 p.
Economic Importance
of Federal Grazing:
An Interindustry Analysis’
DAN W. BROMLEY
Research Fellow, Department of Agricultural Economics, Oregon State University, Corvallis.
Highlight
An important, yet overlooked aspect of public land management involves the economic significance to rural areas of grazing and lumber production on federal lands. To illustrate the relative importance of these two uses, a mathematical technique was used to quantify the economic interdependence of all business activity in an eastern Oregon county. In addition to a description of the existing situation, changes in magnitude of grazing and logging use in the county were simulated to illustrate likely impact on the local economy.
Through the years, the
Journal
has carried many
articles concerned
with economic
problems.
The
grazing fee issue and the economics of range im-
provements seem to prevail as standard fare. One
area receiving little attention is the relationship
of
ranching
and logging interests,
both dependent
upon public lands, to other economic activities in
a rural area. As the demand for competing
uses
of the public domain and national forests increases,
the identification
of this economic interdependence
takes on added significance.
In a recent study sponsored by the Forest Service
.and the Bureau of Land Management,
the U.S.
1 The author is indebted to H. H. Stoevener and Dillard H. Gates for critical review of the original manuscript, and to H. H. Stoevener and G. E. Blanch for guidance in the research from which this article is drawn. Oregon Agricul- tural Experiment Station Technical Paper No. 2440.
GRAZING
9
LORD, T. M., AND A. J. GREEN. 1969. Detailed reconnais- sance soil survey of the Tulameen map area British Columbia. Canada Dep. Agr., Res. Sta., Vancouver, B.C. Rep. 11.
MATHEWS, W. H. 1944. Glacial lakes and ice retreat in South-Central British Columbia. Royal Sot. Can., Ser. 3, Vol. 38 Pt. 4. 19 p.
MCLEAN, ALASTAIR. 1969. Plant communities of the Simil- kameen Valley, British Columbia and their relationships to soils. Ph.D. Thesis, Wash. State University. (in press). RICE, H. M. A. 1960. Geology and mineral deposits of
the Princeton Map-Area, British Columbia. Geol. Surv. Can. Mem. 243. 136 p.
SOIL SURVEY STAFF. 1966. Aerial-photo interpretations in classifying and mapping soils. U.S. Dep. Agr. Handbook 294. 89 p.
Department
of Agriculture’s
Economic
Research
Service
investigated
the effects on gross ranch
income from a grazing fee increase and a 20%
reduction
in federal grazing. That the respective
agencies are concerned
about these changes on
ranch incomes is heartening.
But administrators
would be the first to admit they know little of the
indirect impact upon those who buy from, and sell
to, the ranching community.
By overlooking
these
secondary effects, a much too incomplete
picture
is presented.
To help bridge this void, a study was undertaken
by the Department
of Agricultural
Economics
at
Oregon State University in 1965. Its purposes were
threefold:
1) to depict the extent of grazing of
domestic
livestock
on public
lands in Oregon;
2) to ascertain the extent of economic activity at-
tributable
to the use of public lands as a source of
feed for cattle operations in Grant County, Oregon;
‘and 3) based upon the findings of objective
2, to
project the impact of adjustments in federal grazing
on total sales of businesses in the County and the
resultant changes in household income of the area’s
residents
(Bromley,
1967).
In addition,
the ex-
pected economic
impact from an increase in re-
ceipts of the County’s lumber industry was detailed
(Bromley, Blanch, and Stoevener, 1968).
The account will emphasize the importance
of
grazing and logging on public lands to a rural
economy.
However,
the significance
also lies in
acquainting
decision-makers
with a technique
for
detailing
the interrelationships
between commer-
cial uses of federal lands and economic activity in
a local area.
10
BROMLEY
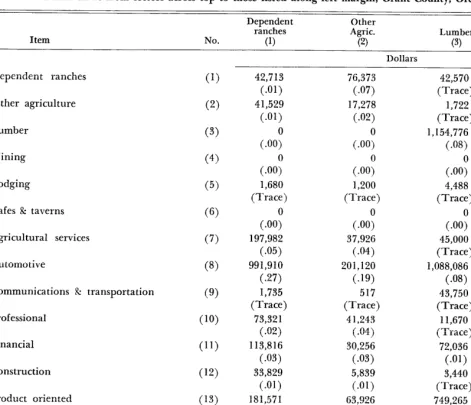
Table 1. Dollar flows from sectors across top to those listed along left margin, Grant County, Oregon, 1964. Dependent Other
ranches Lumber
Item No. (1) Agric. (2) (3) Mining (4)
Dependent ranches
Other agriculture
Lumber
Mining
Lodging
Cafes & taverns
Agricultural services
Automotive
Communications % transportation
Professional
Financial
Construction
Product oriented
Service oriented
(1)
(2)
(3)
(4)
(5)
(6)
(7)
(8)
(9)
(10)
(11)
(12)
(13)
(14)
Dollars
42,713 76,373
(-01) (-07)
41,529 17,278
(-01) (*02)
(.OOY (.OOjl
(.OOY (.OOY
1,680 1,200
(Trace) (Trace)
(.OO;) (.OOY
197,982 37,926
(-05) (*04)
991,910 201,120
(-27) (*19)
1,735 517
(Trace) (Trace)
73,321 41,243
(-02) (-04)
113,816 30,256
(-03) (-03)
33,829 5,839
(-01) (-01)
181,571 63,926
(*05) (-06)
112,453 49,617
(-03) (-05)
42,570 (Trace) 1,722 (Trace) 1,154,776 (*OS)
(.OOY 4,488 (Trace)
(.OOj) 45,000 (Trace) 1,088,086 (-08) 43,750 (Trace) 11,670 (Trace) 72,036 (-01) 3,440 (Trace) 749,265 (-05) 87,52 1
(-01)
(.OOj)
(.OOf)
(.OOjl
c.00;
c.00;
(.OOY
30,000(-08) 10,089 (-03) 692 (Trace)
(.OOj)
(.OOY 1,720 (Trace)
5,876 (-02) (.OOY
Totals 1,792,539 525,295 3,304,324 48,377
(-48) (*51) (-23) (-13)
ture is primarily
livestock oriented
with 86% of
the total agricultural
sales during
1964 coming
from cattle and calves. Crops consist primarily of
hay, wheat, barley, and oats. The majority of the
forested
regions of the County are covered
by
ponderosa pine with lesser amounts of larch, Doug-
las fir, lodgepole pine, and spruce. Range vegeta-
tion is characterized
by sagebrush-grass
commu-
nities. The mountainous
regions provide summer
range while the foothills are used during spring
and fall.
Methods
The technique used to trace the flow of money through an economy is input-output analysis. The economic model is a system of simultaneous equations, one equation for each sector in the economy under study. Each equation will have as many variables as there are sectors in the economy. Thus, the complete model is a square matrix, with as many unknowns as equations.
In Grant County, 14 economic sectors were defined and thus, the model used was a 14 x 14 system of simultaneous
equations. Twelve of the 14 sectors were for commercial businesses, and two for agricultural firms. Each of the commercial business sectors consisted of firms selling some- what similar products or services. The 12 commercial sectors were: Lumber, Mining, Automotive, Lodging, Cafes and Taverns, Agricultural Services, Communications and Transportation, Professional, Financial, Construction, Prod- uct Oriented, and Service Oriented. There were 288 firms in the above categories in 1964.
The two remaining sectors were for agricultural firms. The Dependent Ranches sector was comprised of all cattle ranches in the County possessing a permit or license to graze cattle on the federal range. The Other Agriculture sector consisted of all other agricultural producers in the County. Of the 225 full-time agricultural enterprises in the County, 143 had federal grazing privileges and 82 did not.
FEDERAL
GRAZING
11
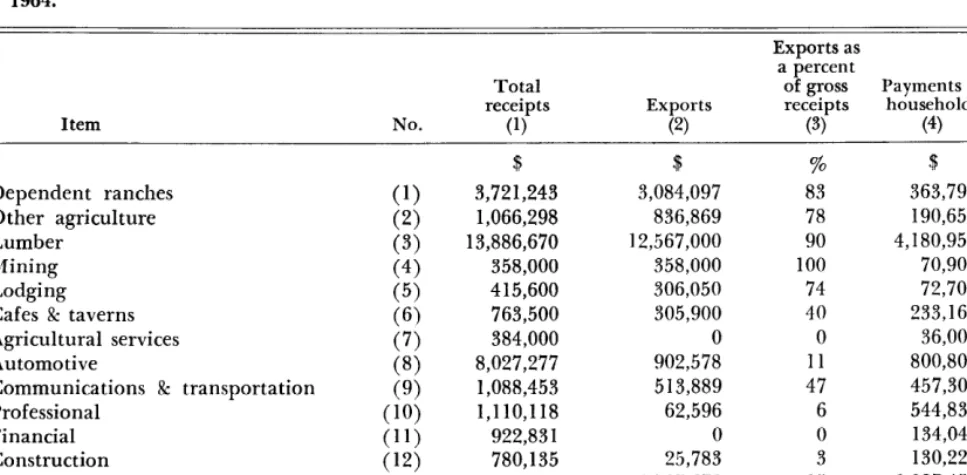
Table 2. Sectors of the Grant County economy showing gross receipts, value of exports, and household incomes paid, 1964.
Exports as Household a percent coefficient Total of gross Payments to Column 4 + receipts Exports receipts households Column 1
Item No. (1) (2) (3) (4) (5)
$ $ % 3
Dependent ranches (1) 3,721,243 3,084,097 83 363,792 .lO
Other agriculture (2) 1,066,298 836,869 78 190,650 .18
Lumber (3) 13,886,670 12,567,OOO 90 4,180,952 .30
Mining (4) 358,000 358,000 100 70,907 .20
Lodging (5) 415,600 306,050 74 72,700 .17
Cafes & taverns (6) 763,500 305,900 40 233,161 .31
Agricultural services ii; 384,000 0 0 36,000 .09
Automotive 8,027,277 902,578 11 800,805 .lO
Communications & transportation (9) 1,088,453 513,889 47 457,309 .42
Professional (10) 1,110,118 62,596 6 544,832 .49
Financial (11) 922,83 1 0 0 134,040 .15
Construction (12) 780,135 25,783 3 130,227 .17
Product oriented (13) 11,812,485 1,787,672 15 1,097,45 1 .09
Service oriented (14) 1,002,819 50,86 1 5 403,399 .40
Totals 45,339,429 20,801,295 8,716,225
In terindus try Analysis
The dollar figures in Table 1 indicate the flow of money, in exchange for goods and services, from firms in those sectors listed across the top to firms in those sectors listed along the left margin. The table is read in the following manner: the dollar figures going down, say, column 1, reveal that ranches in the Dependent Ranches sector spent; $42,713 for the purchase of supplies from ranches within the same sector; $41,529 for these types of purchases form ranches in the Other Agriculture sector; $1,680 in the Lodging sector; $197,982 for supplies from the Agricultural Services sector; and similarly down column 1. Likewise, those firms classified as Other Agriculture spent $76,373 within the Dependent Ranches sector for supplies; $17,278 was paid to firms within the same sector and so on down column 2. Thus, the column entries show the purchasing pattern of firms in the four sectors listed across the top and how they spent money for the purchase of supplies from firms in sectors listed down the left side.
While the dollar figures are interesting, a more meaning- ful picture is revealed by the coefficient immediately under each dollar entry. This is the “trade coefficient” and each entry shows the proportion of every dollar of gross receipts of the sectors listed across the top which went for the purchase of supplies from those sectors listed at the left. For example, for every dollar of gross receipts of the Dependent Ranches sector, its firms spent $0.01 for supplies from ranches in the same sector; $0.01 was spent in the Other Agriculture sector; $0.05 was spent in the Agricultural Services sector; $0.27 in the Automotive sector and so on down column 1.
The total amount of money spent within the County by firms in each of the four sectors listed across the top is found at the bottom of the respective columns. The coefficient below this figure is the sum of the coefficients in that column and reflects what proportion of the sector’s
gross receipts (how much out of every dollar) was spent in the County for the purchase of supplies to be used in the further production of goods and services.
Table
1 shows that the Lumber
industry was
responsible
for more than $3 million in purchases
from the County’s businesses, although the propor-
tion of its gross receipts spent locally (0.23) was
less than half of the proportion
spent by either
agricultural
sector.
Table 2 presents some additional
characteristics
of Grant County commercial and agricultural
busi-
nesses. Exports are the value of goods leaving the
economy (Grant County), generating
a flow of in-
come into the area. Column 3 indicates the propor-
tion of each sector’s income which consisted of
receipts from outside Grant County. The “House-
hold Coefficient”
is merely the total wages and
salaries, as well as dividends and interest, paid by
the sector divided by that sector’s gross receipts.
This indicates the approximate
quantity of labor
and management
services required per one dollar
worth of receipts in that sector.
With the information
in Tables
1 and 2 it is
possible to discuss the trade relationships
which
exist in Grant County and to draw some inferences
about the relative importance
of those economic
activities which depend upon federal lands.
12
BROMLEY
Table 3. Business and household income multipliers for Grant County, 1964.
Item Dependent ranches Other agriculture Lumber
Mining Lodging Cafes & taverns Agricultural services Automotive
Communications & No. (1) (2) (3) (4) (5) (6) (7) !8>
Business Household income income multipliers multipliers
(1) (2)
1.56 1.80
1.60 1.53
1.28 1.17
1.15 1.08
1.52 1.48
1.60 1.26
1.06 1.09
1.19 1.25
transportation (9) 1.20 1.07
Professional (10) 1.04 1.02
Financial (11) 1.01 1.02
Construction (12) 1.29 1.22
Product oriented (13) 1.08 1.14
Service oriented (14) 1.12 1.05
sector brought in $12 million.
These two activities
accounted for over 75yo of the new money brought
into Grant County in 1964.
The $5 million spent by the Dependent Ranches
and Lumber sectors (sum of columns 1 & 3, Table
1) accounted
for 57yo of the total spent by all
businesses in the County for purchases of necessary
goods and services.
The Lumber sector alone ac-
counted for 40yo of the total wage and salary pay-
ments made in the County in 1964 (column
4,
Table
2).
Changes in Land Use
Two types of multipliers
for Grant County are
presented in Table 3: a business income multiplier
and a household income multiplier.
The business
income multiplier
reveals how much total business
receipts in the County would change for a $1.00
change in receipts of the sector at the left. For
example, a $1 .OO increase in gross receipts of the
Automotive
sector would cause total receipts
in
the County (businesses in addition to those in the
Automotive
sector) to increase $0.19.
The household income multiplier
indicates how
much all household incomes in the County would
change for a $1 .OO change in the household
in-
comes of the sectors listed at the left. For example,
when household
incomes
in the Construction
sector increase by $1 .OO, household incomes in the
rest of the economy will increase by $0.22. Those
sectors with the larger multipliers will have a greater
secondary effect upon the health of the economy
per dollar change in their total receipts than will
the sectors with the smaller multipliers.
To illustrate
the use of these multipliers,
a
change in gross receipts of two sectors dependent
upon federal lands will be simulated.
In addition
to estimating
the total impact, the distribution
of
this effect by sectors within
the Grant County
economy will be illustrated.
Reduction in Federal Grazing
A
TO70
reduction
in federal grazing has been
estimated to cause an 11 y0 decrease in gross ranch
income (Caton, 1965).2 To simulate this reduction
in Grant County, ranches were categorized by size
to correspond
to Caton’s classification.
The in-
come reduction
in each of five size-groups was
totaled to arrive at an estimate for all Dependent
Ranches in the County.
The estimated reduction
is $399,578.
With lower gross receipts, the firms
in the Dependent
Ranches
sector could be ex-
pected to curtail purchases of supplies from other
firms in the County.
As those businesses serving
ranchers experience reduced sales, they in turn will
reduce purchases from their suppliers.
Because of
this interdependence,
the original reduction in the
ranching
sector is increased to $404,691
as firms
in the County now buy less from the Dependent
Ranches sector.
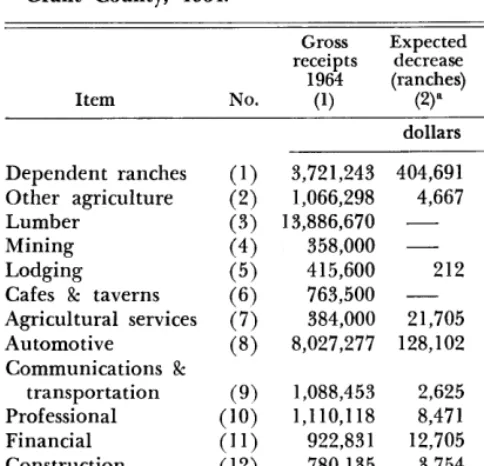
The total expected loss in business receipts for
the other 13 sectors in the County is $2 19,048.
Thus, the reduction
in the Dependent
Ranches
sector, plus this reduction
in the other 13 sectors,
brings the total reduction
in business receipts to
$623,739.
Multiplying
the business income mul-
tiplier for the Dependent Ranches sector times the
direct reduction
in that sector (1.56
x
$399,578)
yields a total reduction
in receipts of $623,342.
This number is slightly smaller than the previous
figure due to different computation
procedures.
The use of the business income multiplier
gives
no indication
of the sectoral distribution
of this
reduction.
The solution
of the system using a
computer consists of first finding the reduction in
each sector, and then finding the sum of the sector
changes.
The results of the computer
solution
showing allocation
of the reduction
by sector are
presented in Table 4. The greatest absolute loss,
though not percentage loss, occurs in the Automo-
tive sector.
The Agricultural
Services sector ex-
periences
the greatest proportionate
loss in gross
receipts--57’,.
The reduction in business incomes in the County
would not be the only ramification
from changes
in grazing use. As gross receipts of the Dependent
Ranches sector decline, the income of households
in that sector (the ranch family) could be expected
FEDERAL
GRAZING
13
Table 4. Effects and distribution of changes in gross receipts of all County businesses resulting from changes in receipts of 2 sectors dependent upon federal lands, Grant County, 1964.
Item No.
Gross Expected Expected receipts decrease increase 1964 (ranches) (lumber)
(1) (2)” (Vb
Dependent ranches Other agriculture Lumber
Mining Lodging
Cafes & taverns Agricultural services Automotive
Communications & transportation Professional Financial Construction Product oriented Service oriented
dollars
(1) 3,721,243 (2) 1,066,298 (3) 13,886,670 (4) 358,000 (5) 415,600 (6) 763,500 (7) 384,000 (8) 8,027,277
(9)
1,088,453 2,625 7,770(10) 1,110,118 8,47 1 1,819
(‘1) 922,83 1 12,705 8,271
(12) 780,135 3,754 454 (13) 11,812,485 23,949 88,948 (14) 1,002,819 12,858 10,339
404,691
4,667
4,844 311 1,514,612
212 503
21,705 5,196
128,102 141,176
Totals 45,339,429 623,739 1,784,243
B Expected decrease in receipts by sector, caused by reduction in receipts of dependent ranches sector.
bExpected increase in receipts by sector, caused by increase in receipts of lumber sector.
to drop also. The household coefficient
in Table
2 indicates that portion of a dollar of gross receipts
which is paid to households for labor and manage-
ment services, dividends and interest, so a reduc-
tion in gross receipts of $404,691
would be ex-
pected to cause household incomes to fall $40,469
(404,691
x .lO).When this is multiplied
by the
household
income multiplier
for the Dependent
Ranches sector (1 JO), a total loss of $72,844
re-
sults, $32,375 of which occurs in households out-
side of the Dependent
Ranches sector.
Increase in Receipts of the Lumber Sector
A similar procedure was followed to derive the
economic
impact from an increase
in the gross
receipts of the Lumber
sector.
The lumber
in-
dustry in Grant County, like ranching,
is depen-
dent upon federal lands as over 75% of the logs
harvested
in 1964 were from national
forests.
A 10% increase
in receipts
would amount
to
$1,388,667.
This
would
cause an increase
of
$269,63 1 in the receipts of the other 13 sectors in
the economy
and a $125,945
increase
in trade
within the Lumber sector. The total increase for
all County
businesses
(including
the Lumber
sector) would be $1,784,243.
The distribution
of
this increase by sector is presented in Table 4.
County household incomes would increase $1.17
for every $1 .OO increase in household
income in
the Lumber sector. The 10% increase in receipts
would cause a $456,013
increase in household in-
comes in that sector, and a subsequent
additional
increase
in household
incomes
in the other 13
sectors of $77,408
bringing
the total impact on
household incomes in the County to $553,414.
Discussion