Foods Eaten by the
Rocky
Mountain
Elk
ROLAND C. KUFELD
Highlight: Forty-eight food habits studies were combined to determine what plants are normally eaten by Rocky Mountain elk (Cervus canadensis nelsoni), and the rela- tive value of these plants from a manager’s viewpoint based on the response elk have exhibited toward them. Plant species are classified as highly valuable, valuable, or least valuable on the basis of their contribution to the diet in food habits studies where they were recorded. A total of 159 forbs, 59 grasses, and 95 shrubs are listed as elk forage and categorized according to relative value.
Knowledge of the relative forage value of plants eaten by elk is basic to elk range surveys, and to planning and evaluation
of habitat improvement programs.
Numerous elk food habits studies have been conducted; however, individual studies are limited to a specific area, and relatively few plant species are found in the diet compared to the number of plants eaten by elk throughout their range. The amount of a particular species consumed in one study may or may not be indicative of its true value as elk forage. The purpose of this inquiry is to combine all food habits work to deter- mine which plants are eaten by elk, and their relative value as reflected by the degree to which they are normally sought.
Methods
With one exception only studies which pertain to food habits of the Rocky Mountain elk (Cervus canadensis nelsoni) in the western U. S. and Canada were included. The exception study involving C. canadensis manitobensis (Blood, 1966) was incorporated because of its quality and because the plants eaten closely paralleled those consumed on elk ranges in Montana and Idaho. Studies of Rocky Mountain elk transplanted to areas out- side their normal range were excluded.
An extensive literature review was made to assemble references concerning
The author is wildlife researcher. Colorado ’ Division of Wildlife, Fort Collins.
The paper is a contribution of Federal Aid to Wildlife Restoration Project W-l 0 1 -R.
Acknowledgment is made to Mrs. Page Smith and to the Library Reference Service, Fed. Aid in Fish and Wildl. Res., Denver, Colo., for assistance in assembling elk food habits re- ferences; and to Dr. Lee E. Yeager for reviewing the manuscript.
Manuscript received May 19, 1972.
elk food habits, and studies meeting the following criteria were incorporated: (1) Data must be original and derived from a specific effort to collect food habits information. References containing state- ments of what elk eat based on general knowledge, or those which summarized previous food habits studies were ex- cluded. (2) Data must be listed by species eaten, and relative quantity consumed must be expressed in terms which would allow degree of use to be categorized. (3) Season of use must be shown. (4) Data must be listed separately for elk. Studies which referred to combined deer and elk use or “game use” were excluded. (5) Studies with a very limited sample (for example, only two or three stomachs) were excluded. (6) Elk must have had free choice of available forage. This ex- cluded some pen feeding studies. (7) Study animals must not be starving. Forty-eight studies were incorporated in this summary.
The following terminology is used throughout this report. Highly valuable plant-one avidly sought by elk and which made up a major part of the diet in food habits studies where encountered, or which was consumed far in excess of its vegetative composition. These had an average ranking of 2.25 to 3.00. Valuable plants-one sought and readily eaten but to a lesser extent than highly valuable plants. Such plants made up a moderate part of the diet in food habits studies where encountered. Valuable plants had an average ranking of 1.50 to 2.24. Least valuable plant-one eaten by elk but which usually made up a minor part of the diet in studies where encountered, or which was consumed in a much smaller propor- tion than it occurred on the range. Least valuable plants had an average ranking of 1.00 to 1.49. These terms are used to reflect the relative value of a plant’s presence on elk range from a manager’s viewpoint because of the response elk have exhibited toward it. Value as used here does not consider nutrient quality or the importance of a species in main- taining a certain desired stage of ecologi- cal succession.
Data were separated by the following seasons of use: Winter-December, Jan- uary, February; Spring-March, April, May; Summer-June, July, August; Fall- September, October, November.
Results
Methods of data collection were as- signed four categories: stomach analysis, feeding observations on wild animals, apparent use of plants, and pen feeding studies designed to determine preference.
Seasonal Use of Major Forage Groups
Winter-Winter use is concentrated on
Studies of food habits differ widely in method of data collection and presenta- tion; in number, relative abundance, avail- ability, and relative palatability of plant species encountered; and in number of animals using the study area. Thus, firm guidelines cannot be established for com- paring relative forage preference among several food habits studies. In every study, however, some plants were con- sumed more extensively than others. The procedure used herein involved categori- zing plants encountered in each study according to whether they were used (1) lightly (2) moderately or (3) heavily in relation to all species consumed in the particular reference. Plants which con- tributed less than 1% of the diet or which
either grasses or shrubs, depending on forage availability. The following authors reported winter grass consumption on Montana’s predominately grass ranges as varying from 63 to lOO%, and averaging 84%: Casagranda and Janson (1957); Constan (1967); Gordon (1968); Greer (1959); Greer et al. (1970); and Morris and Schwartz (1957). Winter shrub use averaged 9% and forb use 8% in these studies.
Idaho of which 22% were conifers (Trout and Leege, 197 1). Boyd (1970) recorded 57% shrub use in Colorado from Decem- ber through April. In these studies grass consumption averaged 22% and forbs were eaten in only two studies where maximum consumption was 10%.
Spting-Spring grass use on eight Montana studies remained high, averaging 87% (Eustace, 1967; Greer et al., 1970; Gordon, 1968; Kirsch, 1963; Mackie, 1970; Morris and Schwartz, 1957; Rouse, 1957; and Stevens, 1966). Little infor- mation outside Montana was available on spring use of major forage classes except for Manitoba, where use of grasses, shr- ubs, and forbs was 54, 37 and 9%, respectively,
Summer-Forbs became important for- age during summer. The summer diet in
Montana averaged 64% forbs, 30%
grasses, and 6% shrubs (Eustace, 1967; Greer et al., 1970; Kirsch, 1963; Mackie, 1970; Morris and Schwartz, 1957; Rouse, 1958; Stevens, 1966). Rouse (1958) re- corded 100% forbs in the summer diet. Summer forage consumption in Colorado, as reported by Nichols (1957), was 58% grasses, 41% forbs, and 1% shrubs. Boyd (1970), also in Colorado, recorded 78% summer use of grasses, 12% forbs, and 10% shrubs. Studies where high summer shrub use were recorded were made by Young and Robinette (1939) in Idaho, where use was 55% shrubs, 25% grasses, and 20% forbs; and by Blood (1966), in Manitoba, who noted 52% use of shrubs, 22% grasses, and 26% forbs.
Fall-Primary use reverts to grasses in the fall in Montana where grass use averaged 73% in nine studies (Greer,
1959; Greer, 1960; Greer et al., 197.0; Kirsch, 1963; Mackie, 1970; Morris and
Table 1. Relative value of forb species eaten by Rocky Mountain elk.
Schwartz, 1957; Peek 1963; Rouse, 1957, Rush, 1932). High grass use in fall was also found in Colorado by Boyd (1970), who recorded 92% grass consumed. In New Mexico, Burt and Gates (1959) found that grass comprised 84% of the fall diet; however, Lang (1958), also in New Mexico, recorded 77% use of shrubs, 21% grasses, and 2% forbs. Shrub use was high in Manitoba and Idaho, where Blood (1955) and Young and Robinette (1939) found 55 and 40% use of shrubs, 37 and 40% use of grasses and 8 and 20% forb use, respectively.
Plant Species Value
Plant species eaten by elk and their relative value rankings for each season are listed by forbs in Table 1, grasses in Table 2, and shrubs in Table 3. Validity of these rankings increases with the number of references on which a ranking is based.
Plant name Winter
Forage value’
Spring Summer Fall References’
Achilles
Achilles millefolium Actaea spicata Agastache urticifolia Agoseris glauca Alectoria fremontii Allium textile Angelica lyallii Antennaria
Antennaria parvifolia Antennaria rosea Aquilegia flavesens Arenaria
Arnica
Arnica cordifolia Arnica latifolia Arnica sororia Artemisia dracunculus Artemisia frigida Artemisia longifolia Artemisia ludoviciana Asplenium felix-femina Aster
Aster canescens Aster commutatus Aster eatoni Astragalus Astragalus miser Balsamorhiza saggittata Boykinia heucheriformis
CMtha leptosepala astilleja
Castilleja minia ta Cerastium arvense Chalachortus elegans Chamaenerion angustifolium Cirsium
Cirsium foliosum Claytonia asarifolia Claytonia sibirica Clintonia uniflora Commandra sp
Commandra pallida
1.33 - 3
1.00 - 1
1.00 - 3
1.00 - 1
2.00 + 1 1.33 - 6 1.00 - 1 1.00 - 1
2.00 + 2
1.50 + 2
1.75 + 4
3.00 * 1 1.00 - 1
1.50 + 4
2.00 + 1
1.00 - 2 1.00 - 1
1 .oo - 1
1.50 + 2
2.00 + 1
1.00 - 4
2.00 + 2
2.00 + 2
1.00 - 1
1.00 - 2 1.00 - 1
1.00 - 4
1.00 - 1
150+2 2.33 * 6
1.00 - 1 1.00 - 1
1.00 - 1 1.00 - 1 2.00 + 1 2.00 + 2 2.00 + 1
3.00 * 1 1.75 + 4 2.00 + 1
2.00 + 1 3.00 * 1 1.00 - 1 1.00 - 1 3.00 * 1 2.50 * 2 1.00 - 1 1.00 - 1
1.00 - 1 3.00 * 1
1.00 - 1 3.00 * 1 3.00 * 1 1.00 - 1
2.00 + 1
1.00 - 2 1.00 - 2 2.00 + 1
1.00 - 1 1.00 - 2
l.OO- 1
3.00 * 1
1.00 - 1 2.00 + 1 2.00 + 1 1.50 + 8 3.00 * 1 2.00 + 1 3.00 * 1 2.00 + 1
2.00 + 1
2.00 + 1 2.00 + 3 3.00 * 1 3.00 * 1 3.00 * 1 1.00 - 1 1.00 - 1
29,36
9, 14, 17, 18,30,31,37,44 48
37,48
7, 17,29,30,39,44 13
32 48
18,25,36,39 44
18 7 10 25,30,44 17,29 48 32 42
14, 20, 24, 25,29,30,42,44 32
30,32 48
18,21,23,24,25,29,30, 33,36,39,42,43
48 32 48 30,42,48 30
3, 7, 11, 18,38,42 48
6,35 37 48 44 48
18,48 20,21,25,36,42 30
48 48 48
z”3
Coptis occidentalis Corydalis scouleri Delphinium sp Delphinium bicolor Delphinium scopulorum Dodecatheon conjugens Dodechatheon pauciflorum Dodocathelon conjugens Epilobium angustifolium Equisetum
Erigeron Eriogonum
Eriogonum heracleoides Eriogonum umbellatum Fragaria
Fragaria virginiana Fraseria sp .
Gaillardia sp. Galium boreale Geranium
Geranium richardsonii Geranium viscossissimum Geum
Geum triflorum Geum turbinatum Glycyrrhiza lepidota Hedysarum sulphurescens Helianthus maximilliana Heracleum lanaturn Hiera cium sp .
Hieracium albiflorum Hieracium chapacanum Hieracium cynoglossoides Hieracium scouleri Heuchera glabella Hydrophyllum capitatum Iris missouriensis Lactuca pulchella Lactuca serriola Lathyrus
Lathyrus laetivirens Ledum groenlandicum Liatris punctata Ligusticum grayi Ligusticum scopulorum Ligisticum tenufolium Lithospermum ruderale Lupinus
Lupinus leucophyllus Lupinus ornatus Lupinus sericeus Medicago sativa Melilotus officinalis Mertensia ciliata Microseris Mite& stauropetala Myosotis alpestris Oenothera fiva Opuntia sp. Oreoxis alpina Osmorhiza occidentalis Oxytropis
Oxytropis splendens Oxytropis viscida Pedicularis cystopteridifolia Pedicularis groenlandica Pedicularis racemosa Penstemon
Penstemon confertus Penstemon pinetorum Penstemon procerus Petasites saggittatus Phacelia heterophylla Phlox
Phlox hoodii
Polemonium delicatum Polygonum phytolaccaefolium
1.00 - 1
2.00 + 1 1.50 + 2
1.00 - 1
1.00 - 1
2.00 + 1 1.00 - 1
1.00 - 2 1.50+2 2.00 + 1
2.67 * 3
1.00 - 1
1.00 - 1
1.00 - 1 1.00 - 1
1.00 - 1
2.00 + 1 1.00 - 1
2.00 + 1
2.00 + 1
2.00 + 1
3.00 * 1
2.00 + 2
1.00 - 1 1 .oo - 1
1.00 - 1
1.00 - 1
2.00 + 1
2.00 + 2
2.00 + 1
2.00 * 2
1.00 - 1 1.00 - 1
3.00 * 1
1.00 - 1
3.00 * 1
2.00 + 1
1.00 - 1
2.00 + 1
2.00 + 1
2.00 + 1
2.00 + 2 3.00 * 1
3.00 * 1
2.00 + 2
1.00 - 1 1.50 + 2
1.00 - 3
1.00 - 1
2.00 + 1 1.00 - 1 1.50 + 2 2.43 * 7 2.00 + 1
2.00 + 1
3.00 * 1
2.00 * 1 1 .oo - 2 2.00 + 1
2.00 + 1
2.00 + 1 1 .oo - 1 1.00 - 1
2.00 + 1
3.00 * 1
2.00 + 1
2.00 + 1
2.00 + 1 1 .oo - 1
2.00 + 1
2.00 + 1 1.00 - 7 3.00 * 1
2.00 + 1
3.00 * 1
2.50 * 2 3.00 * 1 1.00 - 2
1.00 - 1
3.00 * 1
3.00 * 1
3.00 * 2
1.00 - 1
2.00 + 1
2.00 + 1
2.00 + 1
3.00 * 1 1.00 - 1 1 .oo - 1
2.00 + 1
2.50 * 2
2.00 + 1
3.00 * 1
3.00 * 1 1.00 - 1
2.00 + 1
1.50+2
1.00 - 1 1.00 - 1 1.00 - 2
1.00 - 1
2.00 + 2
3.00 * 1
2.00 + 1 1.00 - 1
2.00 + 1 1 .oo - 1
3.00 * 1 1.00 - 1 1 .oo - 1
2.40 * 5
3.00 * 1
3.00 * 1
3.00 * 1
2.00 + 1
3.00 * 1
2.00 + 1
1.00 - 1 1.00 - 1
3.00 * 1
2.00 + 1 1.00 - 1 1.00 - 1
48 48 3 17.20
7; 48 48 20 48
4,29 23,25 17,30 18,24, 25 37 44
18, 25, 30,48 44
3 48 42
3,25, 29,30 30
17,29, 30,39,40,44,48 6
17,20
10 ’
32 29 32
7,48 48 37 44 48 48 48 9 32 32 496 5 4 30,42 37 48 48 18,42
14, 17,23,24,25,29,36,37,39,42,44,48 33
18
Potentilla
Potentilla glandulosa Potentilla gracilis Pteris aquilina Ranunculus
Ranunculus glaberrimus Rumex paucifolius Sanguisorba sitchensis Selagin ells densa Senecio
Senecio columbianum Senecio triangularis Smilacina racemosa Smilacina stellata So lidago Sonchus arvensis Sphaeralcea rivularis Stellaria
Taraxacum
Taraxacum officinale Thermopsis montana Thermopsis pinetorum Trago pogo n Tragopogon dubius lkfolium
Trifolium dasyphyllum Trifolium haydeni Tkifolium repens Trifolium rydbergi Typha
Valeriana sitchensis Veratrum eschscholtzii Vicia americana Viola nuttallii Wyethia
Xanthium strumarium Xerophyllum tenax Zizia ap tera
1.50 + 2
1.00 - 1
1.00 - 1
2.00 + 1
3.00 * 1 1.00 - 1
1 .oo - 2
1.00 - 1
2.00 + 1 1.00 - 1
1.00 - 2
1.00 - 2
2.00 + 1 1 .oo - 1
2.00 + 1
2.00 + 1
2.00 + 1 1.00 - 1
3.00 * 1
1.29 - 7 1.50+2
1.00 - 1 1.00 - 1
2.00 + 1 1.00 - 1
2.00 + 1
2.00 + 1 1.00 - 2 3.00 * 1
2.50 * 2
2.00 + 1
3.00 * 1
3.00 * 3 2.00 + 3
1.00 - 1
2100 + 1
2.00 + 3 3.00 * 1
2.00 + 1
3.00 * 1
2.00 + 1
3.00 * 1 1.00 - 1
2.00 + 1 1.00 - 1
2.50 * 2 2.00 + 1
3.00 * 1
1.50+2 2.00 + 1
3.00 * 1
2.00 + 1
2.00 + 1
3.00 * 1
3.00 * 1 1.00 - 1 1.00 - 1
1 .oo - 1
3.00 * 1
2.50 * 2
10, 17,25,29,30, 39,44 37,48
29 48 30 7 7 37 44
4, 18, 35, 39 48
37,48 48 48 18 4 48 30 17, 29,44
4,7,30 39
9 21 20, 32,42 17, 30,40
10
7 44
7 25 48 48
4, 32 7 36,39,40 32 18,48 30
‘Each entry consists of 3 parts. The first number is the computed value ranking. The second part is the value ranking symbol: - = least valuable; + = valuable; * = highly valuable. The third part is the number of references upon which the ranking is based.
*Numbers indicate references in literature cited section on which value rankings were based.
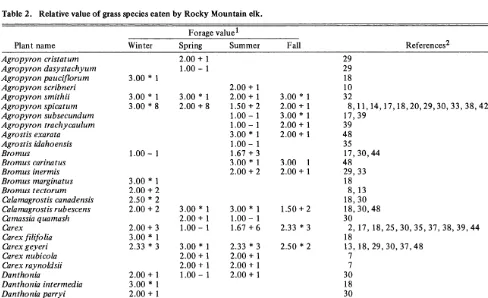
Table 2. Relative value of grass species eaten by Rocky Mountain elk.
Plant name
Forage value’
Winter Spring Summer Fall References*
Agropyron cristatum Agropyron dasystachyum Agropyron pauciflorum Agropyron scribneri Agropyron smithii Agropyron spicatum Agropyron subsecundum Agropyron trachycaulum Agrostis exarata Agrostis tdahoensis Bromus
Bromus carinatus Bromus inermis Bromus marginatus Bromus tectorum Calamagrostis canadensis Calamagrostis rubescens Grmassia quamash Ckrex
Carex filifo lia Chrex geyeri Carex nubicola Carex raynoldsii Danthonia
Danthonia intermedia Danthonia parryi Danthonia unispicata Deschampsia caespitosa Distichlis stricta
3.00 * 1
3.00 * 1 3.00 * 1 3.00 * 8 2.00 + 8
1.00 - 1
3.00 * 1 2.00 + 2 2.50 * 2 2.00 + 2 2.00 + 3 3.00 * 1 2.33 * 3
2.00 + 1 3.00 * 1 2.00 + 1 2.00 + 1 2.00 + 1
2.00 + 1 1.00 - 1
3.00 * 1 2.00 + 1 1.00 - 1 3.00 * 1 2.00 + 1 2.00 + 1 1.00 - 1
2.00 + 1 2.00 + 1 1.50 + 2 1.00 - 1 1.00 - 1 3.00 * 1 1.00 - 1 1.67 + 3 3.00 * 1 2.00 + 2
3.00 * 1 1.00 - 1 1.67 + 6 2.33 * 3 2.00 + 1 2.00 + 1 2.00 + 1
3.00 * 1
3.00 * 1 2.00 + 1 3.00 * 1 2.00 + 1 2.00 + 1
3.00 1 2.00 + 1
1.50 + 2 2.33 * 3 2.50 * 2
29 29 18 10 32
8,11,14,17,18,20,29,30,33,38,42,43,44 17,39
39 48 35 17,30,44 48 29,33 18
8, 13 18,30 18, 30,48 30
2, 17, 18,25,30,35,37,38,39,44 18
13, 18, 29,30,37,48 7
Elymus flavescens Elymus glaucus Elymus innovatus Festuca idahoensis Festuca ovina Festuca scabrella Juncotdes parviflorum Juncus balticus Jun cus parry i Koeleria cristata Melica spectabilis Muhlenbergia
Muhlenbergia cuspidata Orzyopsis hymenoides Phleum
Phleum alpinum Phleum pratense Poa
Poa alpina Poa canadensis Poa compressa Poa epilis Poa secunda Sitanion hystrix Stipa
Stipa columbiana Stipa comata Stipa viridula Trisetum spicatum Trisetum wolfii
3.00 * 1
2.00 + 1
2.56 * 9 2.40 * 5
1.60+5 1.50 +4 1.50 + 2
1.00 - 1
2.50 * 2 2.00 + 5 3.00 * 1
3.00 * 1
2.00 + 1
2.33 * 3 3.00 * 1 1.00 - 1
3.00 * 1
2.00 + 1
2.83 * 6 2.00 + 1
2.75 * 4
2.00 + 1
2.00 + 1
2.00 + 1
2.67 * 6 2.00 + 1
2.00 + 1 2.50 * 2 2.00 + 1
2.00 + 1
3.00 * 1
1.50 + 2 2.00 + 1 1.00 - 2 3.00 * 1
3.00 * 1
3.00 * 1
2.00 + 1 1.00 - 1
1.50 + 2 2.00 + 2
1.00 - 1
2.00 + 5 2.00 + 1 2.00 + 2 1.50 + 2
1.00 - 1
2.00 + 1 1.00 - 1
2.00 + 1
2.00 + 1
3.00 * 1 1.00 - 1
3.00 * 2 2.00 + 1
3.00 * 1
2.00 + 2 2.00 + 1 3.00 * 1
3.00 * 1 2.50 * 2 2.00 + 1 3.00 * 1
3.00 * 1
3.00 * 1 2.00 + 1
46 39,48 39
7, 8,11,14,17,18,20,29,30,38,39,42,43,44 7
11, 17, 18,20,29, 30,42,44 48
35 37
11, 17, 18,20,32,38,44 39
11,38 32 46
7, 44 7, 35 18,30
13, 14, 17,20,29,30,33,42,44 30
18 18,32
7, 35 7, 32 37 11,30 38 18,37 46 32 17,29 35
IEach entry consists of 3 parts. The first number is the computed value ranking. The second part is the value ranking symbol: - = least valuable; + = valuable; * = highly valuable. The third part is the number of references upon which the ranking is based.
2Numbers indicate references in literature cited section on which value rankings were based.
Table 3. Relative value of shrub species eaten by Rocky Mountain elk. Forage value 1
Plant name Winter Spring Summer Fall References2
Abies grandis Acer glabrum Acer spicatum Alnus tenuifolia I
Amelanchier alnifolia Arctostaphylos uva-ursi Artemisia cana Artemisia tridentata Artemisia tripartita Berberis repens Betula glandulosa Betula fontinalis Ceanothus velutinus Ceanothus sanguineus Cercocarpusnontanus Cercocarpus ledifolius Chrysothamus nauseosus Chryso thamus viscidiflorus Cornus stolonifera Dasiphora fruticosa Elaeagnus commutata Fraxinus
Garrya wrightii Juniperus
Juniperus communis Juniperus horizontalis Juniperus occidentalis Juniperus scopulorum Ledum groenlandicum Linnaea
Linnaea borealis Lonicera involucrata Lonicera utahensis Menziesia ferruginea Odostemon sp.
Odostemon aquifolium
1.00 - 2
2.25 * 4 1.00 - 1 1.00 - 1
2.50 * 6 1.00 - 2 2.00 + 1 1.50+8 3.00 * 1 2.00 + 2 2.00 + 2 1.00 - 1 2.40 * 5 3.00 * 3 3.00 * 2 2.00 + 1 2.00 + 3 1.25 - 4 2.20 + 5 1.00 - 1 2.50 * 2 2.00 + 1 3.00 * 1 1.50 + 2 1.00 - 3 1.00 - 3 2.00 + 1 1.50 + 2 2.00 + 1
2.00 + 2 1.00 - 1 1.25 -4 2.00 + 1 1.25 - 4
3.00 * 1 2.00 + 1 1.50 + 2 2.50 * 2
3.00 * 1 2.00 + 1 2.33 * 3 1.50 + 2 1.67 + 3 1.80 + 10
1.00 - 1 3.00 * 1
1.00 - 1 1.00 1
1.00 - 2 1.00 - 1 3.00 * 1 3.00 * 1 3.00 * 1
3.00 * 1
1.00 - 1 2.00 + 1
1.00 - 1 1.00 - 1
2.00 + 1 3.00 * 1 3.00 * 1
2.00 + 2 3.00 * 1 3.00 * 1 2.00 + 2 2.00 + 1
1.00 - 1 1.00 - 1
l.OO- 1 1.00 1
1.00 - 1
18,45
18, lg., 27, 30,48 4
5, 18,48
1,4,5, 18, 19,26,27,30,42,48 4,29,42
32
5,6, 13, 19,21,22,25,27,32,37, 39,43,46 39
1,2,6,21,23,24,25,28,29,30,36,39,45 18,30
18
13, 18, 19, 30, 33,47,48 18,45,47,48
27,31 1,13 12, 13,43,46 12,20,32,43,46
4, 18, 19,27,45,48 18
18,30 26 31 24,31 18, 29,42 11, 30,42 13 18,32
Opulaster malvaceus Pachistima myrsinites Philadelphus lewisii Pinus
Pinus conterta Pin us flexis Pinus ponderosa Populus balsamifera Populus tremuloides Populus trichocarpa Potentilla sp. Potentilla fruticosa Prunus virginiana Prunus emarginata Prunus pensylvanica Pseudotsuga menziesii \
1.00 - 1
1.50 + 2 3.00 * 1 1.00 - 3 1.33 - 3
1.00 2
2.00 + 1
2.50 * 8 3.00 * 1 1.00 - 1
2.38 * 8 2.00 + 1
‘ar.glauca 1.27 - 11
Purshia tridentata - Quercus gambellii
Rhamnus purshiana Ribes
Ribes cereum Ribes cognatum Ribes montigenum Ribes petiolare Ribes viscosissimum Rosa
Rosa acicularis Rubus
Rubus idaeus ’
Rubus parviflorus Salix
Salix bebbiana Mix exigua Salix geyeriana Salix lutea Salix melanopsis Salix scouleriana Salix subcoerulea Sambucus sp. Sambucus caerulea Sambucus melanocarpa Sericotheca discolor Shepherdia canadensis Sorbus americana Sorbus occidentalis Spirea
Spirea betulifolia Spirea lucida Spirea menziesii Symphoricarpos Symphoricarpos albus Symphoricarpos occidentalis Symphoricarpos utahensis Tetradymia canescens Thuja plicata Vaccinium
Vaccinium membranaceum Vaccinium scoparium
3.00 * 4 3.00 * 3
1.00 - 1
1.50+2
1.00 - 2
2.11 +9 3.00 * 1
2.00 + 1
2.00 + 1
3.00 * 1
2.00 + 1
1.50 + 2 3.00 * 1 3.00 * 1 1.00 - 1
2.00 + 1
2.00 + 1 1.00 - 1
2.00 + 1 3.40 - 5 3.00 * 1 1.00 - 1
1.50 + 2 2.00 + 1
2.00 + 2
1.00 - 1 1.00 - 1
2.25 * 4
2.00 + 3
1.00 - 3 2.00 + 1
2.00 + 1
1.00 - 1
2.00 + 1
1.74 + 4
2.00 + 2 3.00 * 1
1.00 - 1
1.00 - 1
3.00 * 1
3.00 * 1 1.00 - 1
3.00 * 1
3.00 * 1
3.00 * 1 2.00 + 1 3.00 * 1
1.71 + 7
3.00 * 1
3.00 * 1
3.00 * 1
2.00 + 1 1.00 - 1
3.00 * 1
1.00 - 1
2.00 + 1
2.00 + 1
1.50 + 2 3.00 * 1 1.00 - 1
1.00 - 3 3.00 * 1 1 .oo - 1
1.00 - 1
2.33 * 3
1.00 - 1
1.50 + 2
1.00 - 1
2.50 * 8
1.00 - 1
1.50 + 2 3.00 * 1
2.00 + 1
3.00 * 1
2.00 + 1 1.00 - 1
2.00 + 1
2.00 * 1
3.00 * 1 1 .oo - 1
2.00 + 1 2.29 * 7
3.00 * 1
3.00 * 1
l.OO- 1
2.00 + 1
3.00 * 1 1.00 - 1
2.00 + 1
2.00 + 1
1.83 + 6 2.00 + 2 1.50 + 2
1.00 - 2 1.33 - 3
1.00 - 3
48
2, 13, 18,28,31 18
6,24,39,45 18,21,25,30,42 36
13,18 4
2,4,5,6,9, 18, 25, 27, 30, 31, 36,42,48 18
9 30
4, 12,18,21, 26, 27,30, 32,39,42,46,48 48
4
5,6, 13, 15, 18,21,24, 25,29,32,42,45 2, 12, 13, 27,46
5, 26, 27 48
18
c
4; 37 48 48
18,42,48 4, 38 25
4 48
4,6,13,19,21,22,25,29,30,33,36 39,42,44,47,48 18
18 18 18 18 18,45 18
3 48 18,48 47,48 25, 33,42 48 18 18,29 42 48 48
13,23,25,27,29,32,33, 36,42,47 4,18,48
39 5 46,39 45
6, 13, 25, 30, 36,44 18,29, 33,48
9, 18, 29, 31,48
‘Each entry consists of 3 parts. The first number is the computed value ranking. The second part is the value ranking symbol: - = least -valuable; + = valuable; * = highly valuable. The third part is the number of references upon which the ranking is based.
‘Numbers indicate references in literature cited section on which value rankings were based.
Forbs having the best documented highly valuable rankings as summer forage were Agoseris glauca and Geranium vis-
cossimum. Lupinus spp. was rated as highly valuable fall forage on the basis of five studies. Aster spp. was frequently mentioned and was considered a valuable plant throughout the year.
Highly valuable grasses or grasslikes having the best documented rankings were Agropyron spicatum, Carex sp.,
Carex geyeri, Festuca idahoensis, Festuca Ceanothus velutinus, Populus tre- scabrella, and Poa sp. Highly valuable m uloides, Prunus virginiana, Purshia ratings were seasonal for most of these triden tata, Quercus gam bellii and Salix species. Only Carex geyeri was rated spp. Like forbs and grasses, these shrubs highly valuable throughout the year. were highly valuable during only certain
Koeleria cristata was well documented as portions of the year. Most were highly a valuable species on an annual basis. valuable during the fall or winter.
Among shrubs, the highly valuable species with rankings based on a relatively large number of references were Amelan-
chier alnifolia, Ceanothus sanguineus,
Discussion
various strains of the same species can differ in palatability. Palatability may also vary with differences in climate, soil conditions, and topography. However, the impact of these factors on rankings cannot be assessed until their effects on palatability of all elk forage species have been researched extensively.
Relative abundance and availability are two other factors which may have in- fluenced value rankings. Some species may have received least valuable rankings because they were not abundant or because they were relatively unavailable due to some factor such as snow cover. Thus, they were only minor contributors to the diet. They may be highly valuable when they are more abundant or avail- able. However, unless the normal abun- dance or availability of such species can be increased through management, their assigned rankings must stand as indica- tions of their value as elk forage under natural conditions.
It must be remembered that rankings contained herein are averages for all studies where the species were eaten. Thus, some elk managers working where food habits have been studied extensively may feel that certain ratings are too high or low for their particular area. In such instances, questionable rankings may be adjusted up or down to fit the circum- stances. However, the real benefits from these rankings should be realized by managers who lack sufficient data to determine the relative forage value of plants in their area and by managers who want to revegetate their ranges with plant species known to be good elk forage.
Literature Cited
1. Anderson, Chester C. 1958. Reconnais- sance of deer habitat in special problem areas. Wyo. Fish and Game Comm. Fed. Aid Compl. Rep. Proj. W-27-Rl l, WP-4, J-7 and 8. 29 p.
2. Anderson, C. C., W. I. Crump, and T. C. Baker. 1956. Food habits of antelope, elk, , deer and moose. Wyo. Game and Fish Comm. Fed. Aid Compl. Rep. Proj. W-27-R- 9, WP-1, J-l. p. 8-31.
3. Baker, Theodore C., Chester Anderson, and William I. Crump. 1953. Food habits study of game animals. Wyo. Wild. f?(l1):24-31. 4. Blood, Donald A. 1966. Range relation-
ships of elk and cattle in Riding Mountain National Park, Manitoba. Canadian Wildl. Serv. Wildl. Manage. Bull., Series 1, No. 19. 62 p.
5. Boyd, Raymond J. 1970. Elk of the White River Plateau, Colorado. Colo. Div. Game, Fish and Parks. Tech. Bull. No. 25. 126 p. 6*. Boyd,Raymond .I. 1972. Stomach contents
data from the Rio Grande elk herd in south- western Colorado. Colo. Div. Game, Fish and Parks, Fort Collins, (Unpublished).
7. Brazda, A. R. 1953. Elk migration patterns and some of the factors affecting move- ments in the Gallatin River drainage, Mon- tana. J. Wildl. Manage. 17:9-23.
8. Buechner, Helmut K. 1952. Winter-range utilization by elk and mule deer in south- eastern Washington, J. Range Manage. 5 :76-80.
9, Burt, Theo. Jr., and Gerald H. Gates. 1959. Pecos elk reproductive and food habits studies. New Mex. Dep. of Game and Fish. Fed. Aid Compl. Rep. Proj. W-93-R-1, WP-3, J-6.19 p.
10. Capp, John C. 1967. Competition among bighorn sheep, elk and deer in Rocky Moun- tain National Park, Colorado. M.S. Thesis. Colo. State Univ., Fort Collins. 132 p. 11. Casgranda, Lloyd, and Reuel G. Janson.
1957. Wildlife investigations (Dist. 4): Big Game Surveys and Investigations. Montana Dep. of Fish and Game. Fed. Aid Compl. Rep. Proj. W-74-R-2, J-Al, Pt. 3. 19 p. 12. Chadwick, Howard William. 1960. Plant
succession and big game winter movements and feeding habits in a sand dune area in Fremont County, Idaho. M.S. Thesis. Univ. of Idaho, Moscow. 121 p.
13. Cliff, Edward P. 1939. Relationship be- tween elk and mule deer in the Blue Moun- tains of Oregon. Trans. N. Am. Wildl. Conf. 4:560-569.
14. Constan, Kerry John. 1967. Bighorn sheep range use, food habits and relationships to mule deer and elk in Gallatin Canyon. M.S. Thesis, Montana State Univ., Bozeman. 43 p. 15. Cowan, I. MC T. 1947. Range competition
between mule deer, bighorn sheep and elk in Jasper Park, Alberta. Trans N. Amer. Wildl. Conf. 12:223-227.
16. De Nio, R. M. 1938. Elk and deer foods and feeding habits. Trans N. Amer. Wildl. Conf. 3:421-427.
17. Eustace, C. D. 1967. Food habits, range use and relationships between elk and live- stock in the Gravelly Mountains, Montana. MS. Thesis. Montana State Univ., Bozeman. 55 p.
18. Gaffney, W. D. 1941. The effects of winter elk browsing, south fork of the Flathead River, Montana. J. Wildl. Manage. 5:427. 19. Geis, A. F. 1954. The food requirements
and relative digestibility of a variety of winter diets fed to elk (Cerrus camdensis nelsoni) under controlled conditions. M.S. Thesis. Montana State Univ., Missoula. 68 p. 20. Gordon, Floyd A. 1968. Range relation-
ships of elk and cattle on elk winter range, Crow Creek, Montana. M.S. Thesis. Montana State Univ., Bozeman. 52 p.
21. Greer, Kenneth R. 1959. Analysis of 68 samples from the 1956 Gallatin Canyon elk “Hunter kill.” In Wildlife investigations- State: Wildlife investigations laboratory. Montana Dep. of Fish and Game. Fed. Aid Compl. Rep. Project W-83-R-2. All jobs. p. 5-6.
22. Greer, Kenneth R. 1959. Analysis of 23 elk rumen samples collected during 1957 from the vicinity of Gardiner, Montana. In Wild- life investigations-State: Wildlife investiga- tions laboratory. Montana Dep. of Fish and Game. Fed. Aid Compl. Rep. Proj. W-83-R-2. All jobs. p. 8.
23. Greer, Kenneth R. 1960. Analysis of twenty-one elk rumens collected from the 1956 hunter-kill at Boyd Ranch, Missoula County. In Wildlife investigations-State:
Wildlife investigations laboratory. Montana Dep. of Fish and Game. Fed. Aid Compl. Rep. Proj. W-83-R-3. All jobs. p. 14. 24. Greer, Kenneth R. 1960. Analysis of
twenty-nine elk rumens collected during 1956-57 from the Sun River Game Range- Lewis and Clark County, Montana. In Wild- life investigations-State: Wildlife investiga- tions laboratory. Montana Dep. of Fish and Game. Fed. Aid Compl. Rep., Proj. W-83-R- 3. Alljobs. p. 16-17.
25. Greer, Kenneth R., John B. Kirsch, and Harley W. Yeagher. 1970. Seasonal food habits of the northern Yellowstone elk (Wapiti) herds during 1957 and 1962-1967 as determined from 793 rumen samples. Montana Dep. of Fish and Game. Fed. Aid Final Rep. Proj. W-83-R-12, J-B-l. 76 p. 26. Greffenius, R. J. 1938. Results of the
Copper Ridge Basin elk study. U. S. Forest Serv., Rocky Mountain Region. Bull. 21(4):14-15.
27. Harris, John T. 1958. Analysis of elk win- ter range, south fork of the White River, Colorado. M.S. Thesis. Colo. State Univ., Fort Collins. 136 p.
28. Hoskins, Leonard Wayne. 1952. Browse utilization studies on the Pocatello winter big game range. M.S. Thesis. Univ. of Idaho, Moscow. 87 p.
29. Kirsch, John B. 1963. Range use, relation- ships to logging, and food habits of the elk in the Little Belt Mountains, Montana. M.S. Thesis. Montana State Univ., Bozeman. 44 p. 30. Knight, Richard R. 1970. The Sun River
elk herd. Wildl. Monogr. No. 23. 66 p. 31. Lang, E.M. 1958. Elk of New Mexico. New
Mexico Dep. of Game and Fish. Bull. No. 8. 33 p.
32. Mackie, Richard J. 1970. Range ecology and relations of mule deer, elk and cattle in the Missouri River Breaks, Montana. Wildl. Monogr. No. 20. 79 p.
33. Martinka, C. J. 1969. Population ecology of summer resident elk in Jackson Hole, Wyoming. J. Wildl. Manage. 33:465-481. 34. Morris, M. S., and J. E. Schwartz. 1957.
Mule deer and elk food habits on the Nation- al Bison Range. J. Wildl. Manage. 21: 189- 193.
35. Nichols, Lyman, Jr. 1957. Forage utiliza- tion by elk and domestic sheep in the White River National Forest. M.S. Thesis. Colo. State Univ., Fort Collins. 92 p.
36. Peek, James M. 1963. Wildlife investiga- tions (Dist. 3): Big game survey and investi- gation-summer of 1956-1960, Gravelly- Snowcrest rumen collections. Montana Dept. of Fish and Game. Fed. Aid Compl. Rep. Proj. W-73-R-8, J-A-l. 11 p.
37. Pickford, G. D., and Elbert H. Reid. 1943. Competition of elk and domestic livestock for summer range forage. J. Wildl. Manage. 7:328-332.
38. Picton, Harold D. 1960. A comparison of the results of feeding site examinations with the vegetative composition of the sites in the Sun River Game Range.In Wildlife inves- tigations (Dist. 4): Big game surveys and in- vestigations. Montana Dep. Fish and Game. Fed. Aid Compl. Rep. Proj. W-74-R-5, J-A-l. p. 9.
39. Rouse, R. A. 1957. Elk food habits, range use and movements. Gravelly Mountains, Montana. M.S. Thesis, Montana State Univ., Bozeman. 29 p.
(Dist. 3): Elk investigations (elk-livestock relationships). Montana Dep. of Fish and Game. Fed. Aid Compl. Rep. Proj. W-73-R-3, J-A-2. 3 p.
41. Rush, W. M. 1932. Northern Yellowstone elk study. Montana Fish and Game Comm., Helena. 131 p.
42. Schallenberger, Allen. 1965. Big game for- age competition in Sun River Canyon. MS. Thesis. Montana State Univ., Bozeman. 43 p. 43. Snyder, Roy. 1969. Forage competition
between cattle and elk in the Gird Creek drainage of western Montana. M.S. Thesis. Univ. of Montana, Missoula. 86 p.
44. Stevens, David R. 1966. Range relation- ships of elk and livestock, Crow Creek drain- age, Montana. J. Wildl. Manage. 30: 349-363. 45. Trout, Lester C., and Thomas A. Leege.
1971. Are the northern Idaho elk herds doomed? Idaho Wildl. Rev. 24( 3): 3-6.
46. Wing, Larry Dean. 1962. Big game and livestock browse utilization and feeding
habits on a sandy range in southeastern Idaho. M.S. Thesis. Univ. of Idaho, Moscow. 89 p.
47. Young, Vernon A. 1938. The carrying ca- pacity of big game range. J. Wildl. Manage. 2131-134. - -
48. Young, Vernon A., and W. Leslie Robinette. 1939. A study of the range habits of elk on the Selway Game Preserve. Univ. of Idaho, School of Forestry, Bull. No. 9.47 p.
Seasonal
Changes
in Trans-Aconitate
and
Mineral
Composition
of Crested
Wheatgrass
in Relation
to Grass Tetany
D. M. STUART, H. F. MAYLAND, AND D. L. GRUNES
Highlight: Grass tetany (hypomagnesemia) frequently occurs from March through June in cattle grazing crested wheatgrass in western United States. High levels of trans- aconitate and/or citrate, K, KI(Ca + Mg) ratios and low Mg in the grass are implicated in the etiology of the disease. In the moist 1967 season, during periods of ‘flush ” growth following warming trends, transaconitate and K increased while Ca and Mg decreased in crested wheatgrass. These characteristics may explain the incidence of grass tetany during periods of “flush ” growth. During the dry 1968 season, these trends were not observed. Growth chamber studies confirmed some of the reasons for changes in crested wheatgrass composition observed in 1967 and 1968.
Grass tetany (hypomagnesemia), a metabolic disorder of ruminants, fre- quently occurs from March through June on pastures of crested wheatgrass (Agropyron desertorum) and other grasses in the western United States (Grunes et al., 1970). In the last 10 years at least 470 known cases of tetany and many suspected cases were noted in northern Nevada, mainly in the extreme
The authors are soil scientists, Agricultural Research Service, U. S. Department of Agri- culture, located at, respectively, Soil and Water Research Division, Reno, Nevada; Snake River Conservation Research Center, Kimberly, Idaho; and U. S. Plant Soil and Nutrition Laboratory, Ithaca, New York.
The paper is a contribution of the Soil and Water Conserv. Res. Div., Agr. Res. Serv., U. S. Dep. Agr., in cooperation with the Nevada Agricultural Experiment Station, Reno, as jour- nal Series No. 136.
Manuscript received February 28, 1972.
northeastern part of the state (unpub- lished Nevada State Office, BLM Report). Most reported cases were on crested wheatgrass, but losses also happened on native grasses, Tetany occurs in north- eastern Nevada in early spring or late winter when cows are fed grass hay. Hjerpe (1964) reports tetany to be a major problem in California, with losses estimated at 4,000 to 6,000 head during the winter of 1963-64 and sporadic losses reported annually. Losses also oc- cur in Idaho and Utah. Tetany may be prevalent during the autumn month , especially on regrowth after late summ 1 r showers.
Induction of the disorder involves many factors. Among factors that pro- mote tetany are low temperatures or a change from low to high temperatures
with rapid growth when moisture is ade- quate (Kemp and ‘t Hart, 1957). During dry years incidence of tetany is much lower. High rates of K and N fertilization and low forage Mg are also involved (Kemp, 1958, 1960). The Mg content of grass tetany-prone pastures is between 0.07% and 0.20% dry weight basis, with averages of 0.17% for the Netherlands (Kemp and ‘t Hart, 1957) and 0.145% for Scotland (Butler, 1963). The critical level is controlled by the relative availability of Mg to the animal. Ratios of K/Ca t Mg) (expressed as meq/kg) greater than 2.2 have been related to the occurrence of tetany (Kemp and ‘t Hart, 1957).
More recently, trans-aconitate of 1% or more in grass has been associated with tetany (Bun& and Stout, 1965; Stout et al., 1967). Also, the dietary intake of 1% citric acid, as sodium citrate, reduced the Mg concentration in the blood*serum of ruminants (Burt and Thomas, 1961). Bohman et al. (1969) induced tetany in cows by giving citric or trans-aconitic acid and KC1 as an oral drench. For a compre- hensive review of grass tetany, the reader ’ is referred to the article by Grunes et al. (1970). The objective of this study was to