High-Quality Location Based Wireless Sensor
Networks
Lakshmanarao Battula 1, Dr.P.Vamsikrishna Raja 2 1
Asst.Professor, 2 Professor,
Dept of Computer Science and Engineering1, Dept of Computer Science and Engineering2,
1,2
Dept. of CSE, Kakinada Institute of Technology & Sciences., Divili, Peddapuram (M), E.G.DT., AP,India
Abstract— Location monitoring refers to the system wherethe wireless sensor network odes counts the number of sensors which are capable of detecting the objects present in their sensing areas. Third party always monitor the personal location which is becoming a privacy threat. To over come this we have proposed a method by using a series of routers to hide the client’s IP address from the server. We propose a privacy-preserving location monitoring system for wireless sensor networks. In our system, we design two in-network location anonymization algorithms, namely, Cloaked Area Determination Algorithm and quality enhanced histogram algorithm that will help the system to enable and provide high-quality location monitoring services for system users, while preserving personal location privacy. The Cloaked Area determination algorithm aims to minimize communication and computational cost, A quality enhanced histogram approach is used that estimates the distribution of the monitored persons based on the gathered aggregate location information. Then, the estimated distribution is used to provide location monitoring services through answering range queries
Keywords— monitoring algorithm, privacy threar, anonymization, histogram approach.
I. INTRODUCTION
In the present world, use of internet is increasing increasingly. User data and other vital data flows through the internet. This data is prone to be misused by external entities. Even though there are several policies to prevent data misuse, these aren’t foolproof. The proposed system aims to hide data that is vital to preserve the privacy of any user. System proposes to use k-anonymity concept to achieve this task. System proposes to use a sensor node network to trace the people.
Wireless Sensor Networks
A large collection of densely deployed, spatially distributed, autonomous devices (or nodes) that communicate via wireless and cooperatively monitor physical or environmental conditions. The sensor nodes such networks are deployed over a geographic area by aerial scattering or other means. Each sensor node can only detect events within a very limited distance, called the sensing range.
Location Monitoring System
Location monitoring systems are used to detect human activities and provide monitoring services. We consider an aggregate location monitoring system where wireless sensor nodes are counting sensors that are only capable of detecting the number of objects within their sensing areas.
Location Privacy
Location monitoring systems are used to detect human activities and provide monitoring services. We consider an aggregate location monitoring system where wireless sensor nodes are counting sensors that are only capable of detecting the number of objects within their sensing areas. Location privacy is a particular type of information privacy. It is defined as the ability to prevent other parties from learning one's current or past location [1]. Usually position is computed and maintained by an external source, such as the underlying network [2]. In a mobile communications network, this is necessary in order to route calls to and from subscribers within the network.
II.EXISTING SYSTEM
Existing location monitoring systems. In an identity-sensor location monitoring System, since each sensor node reports the exact location information of each monitored object to the server, the adversary can pinpoint each object's exact location. On the other hand, in a counting-sensor location monitoring system, each sensor node reports the number of objects in its sensing area to the server. The adversary can map the monitored areas of the sensor nodes to the system layout. If the object count of a monitored area is very small or equal to one.
III.PROPOSED SYSTEM
determination algorithm. System also uses a Quality Enhancing histogram approach to enhance the location-monitoring quality.
The external agency, needing location data of any particular individual, sends a query to the server. The server, in turn transfers this query to the WSN, comprising all the sensor nodes. Sensor nodes, on receiving this query, work independently, to obtain the aggregate location information of a group of k persons. Each sensor node obtains aggregate information of k persons in its area and finally reports this information to the server [15], [18], [16]. The server finallytries to enhance the quality of location monitoring by using a Quality Enhancing histogram and sends the aggregate information to the external agency. So, even the server has no access to the exact concerned individual location information, as it receives aggregate location of k persons from each sensor node. System aims this purpose since` the server is untrusted and can be misused by several attacks, some of them being eavesdropping, hacking, sending malicious codes, etc. [1] We design two in-network location anonymization algorithms, namely, cloaked area determination algorithm and quality-aware algorithm that will help the system to enable and provide high-quality location monitoring services for system users, while preserving personal location privacy. Cloaked Area Determination Algorithm
This algorithm is executed by all the sensor nodes, on receiving query from the server, for particular individual location information [6], [7]. This algorithm aims to minimize the communication and the computation cost of the system. This algorithm follows the following steps:
a. Helps each sensor node to find adequate no. of persons in its area
In our sy stem, few sensor nodes are connected to each other and can directly communicate with each other, while few cannot. Sensor nodes who can directly communicate with each other are called neighbors. During the reporting period, each sensor node tries to determine adequate no. of persons in its area. On determining, each sensor nodes sends a notification to its neighbours. Notification comprises sensor node name, its area and the no. of persons in its area. So, to help them find adequate no. of persons in their areas, their neighbouring sensor nodes forward all the notifications they have received, to these sensor nodes[10],[11]. However, this notification forwarding procedure is followed only when sensor nodes are unable to determine adequate no. of persons in their areas. This approach helps to minimize the communication cost.
b. Helps each sensor node to blur its sensing area into a cloaked area
When this step begins, each sensor node has found out adequate no. of persons in their areas. To reduce the computational cost, algorithm follows a greedy approach.
Using this approach, each sensor node is able to determine their cloaked areas, containing at least k persons. Each sensor nodes has received adequate notifications from their neighbours. Now, a score value is computed by every sensor node, for all the notifications it has received. Let us consider 3 nodes: A, B and C.For sensor node A, Score value is computed by the following formula:
Score = No. of persons under (B or C) / Euclidian distance between A and (B or C)
Euclidian distance is the distance between any two sensor nodes. Proposed system assumes the Euclidian distance between all the sensor nodes.When all the score values are obtained (i.e. for A & B and A &C), the highest value is considered. Suppose if A & B has the highest value. Then, we design a Minimum Bounding Rectangle (MBR), to compute the cloaked area of sensor node A.
In this case, the MBR will contain the areas under sensor nodes A and B. This obtained MBR is nothing but the cloaked area of sensor node A. Similarly, other sensor nodes B and C, compute their cloaked areas.
c. Selecting cloaking set
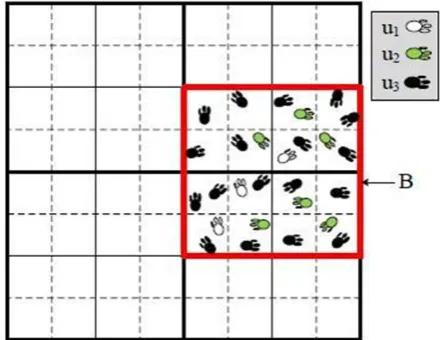
It may first appear that we can determine the cloaking set, denoted as S, by finding the set of users who have footprints closest to the starting point of the service user. This simple solution minimizes the size of the first cloaking box. However, as the service user moves, the users in S may not have footprints that are close to her current position. As a result, the size of the cloaking boxes may become larger and larger, making it difficult to guarantee the quality of LBS. Thus, when selecting the cloaking set, we should consider its affect on the cloaking of not only the user’s first but all footprints spanning the entire region B, it will help generate a PPT with a fine resolution.
It also shows a travel bound B and the footprints inside it. The footprints in different colors belong to different users. u1, u2, and u3 are three 2-popular users within B because they have footprints in the two cells at level 2 of the pyramid which overlap with B; u2, u3 are two 3-popular users within B since they have footprints in all four cells at level 3 that overlap with B; only u3 is 4-popular since she is the only one who has footprints in all the sixteen cells at level 4 that overlap with B.
Figure 2: A travel bound and footprints inside Cloaking Area determination algorithms location updates in the LBS.
But the challenge is that the service user’s route is not predetermined, and thus the LDS cannot figure out whose footprints will be closer to the service user during her travel. To address this challenge, our idea is to find those users who have visited most places in the service user’s travel bound B and use them to create the cloaking set. As these users have Computing cloaking boxes
During a service session, the service user updates a time-series sequence of locations. For each location update p, the LDS computes a cloaking box b using the footprints of users in the cloaking set U. We develop a heuristic algorithm which computes the cloaking box b as small as possible, and ensures that P U (b) ≥ P(R). The pseudo code is given in Algorithm 2. Given a location update p, the LDS first initializes the cloaking box b to p which is the smallest cloaking box only containing the service user herself.
The LDS also initializes a searching box b’ to the cell that contains p at level l where the cloaking set U is selected in Algorithm 1, since it contains footprints of all users in the cloaking set. Then, for each user in U, the LDS gets the set of her footprints Fu which are inside b’ but outside b, and in Fu the LDS finds the closest one to p (line 7-8). Next, the LDS collects.
Fig. 3 The search space S of sensor node A.
grouped into the same partition P = {R1,R2,……R|P |} if their cloaked areas are not overlapping with each other, which means that for every pair of aggregate locations Ri and Rj in P, Ri.Area ∩ Rj.Area=Φ. Then, for each partition P, we update its entire set of aggregate locations to the Quality Enhancing histogram and at the same time, for each aggregate location R in P, we record the estimation error, which is the difference between the sum of the estimators within R.Area, R.N^, and R.N, and then R:N is uniformly distributed among the estimators within R.Area; hence, each estimator within R.Area is set to R.N divided by the total number of grid cells within R.Area .[12],[13],[14] After processing all the aggregate locations in P, we sum up the estimation error of each aggregate location in P. Thus the estimator in the histogram is updated as shown in the algorithm
Quality Enhancing Histogram Algorithm [10]
1. Function HISTOGRAM(AggregateLocationSet R) for each aggregate location r € R do
2:if there is an existing partition P = {r…..r|P|}such that r.Area∩ r
Rk:Area = ; for every Rk.Area ={ } for every rk € P then
4.Add R to P 5.else
6.Create a new partition for R 7.End if
8.End for
9.each partition P do
10.for each aggregate location Rk€ P do 11
12 for every cell g(i,j) € Rk.Area 13.
14 End for
15. P.Area R1.Area U..U R|p|.Area 16 for every cell g(i,j) € p.area
17END FOR
IV PERFORMANCE AND RESULTS:
The resilience of our system to the attacker model with respect to the anonymity level and the number of objects. In the _gure, the performance of the resource- and quality-aware algorithms is represented by black and gray bars, respectively. Figure 4a depicts that the stricter the anonymity level, the larger the attacker model error will be encountered by an adversary. When the anonymity level gets stricter, our algorithms generate larger cloaked areas, which reduce the accuracy of the aggregate locations reported to the server. Figure 4b shows that the attacker model error reduces, as the number of objects gets larger.
The privacy protection and the quality of our location monitoring system with respect to increasing the query region size ratio from 0.001 to 0.256, where the query region size ratio is the ratio of the query region area to the system area and the query region size ratio 0.001
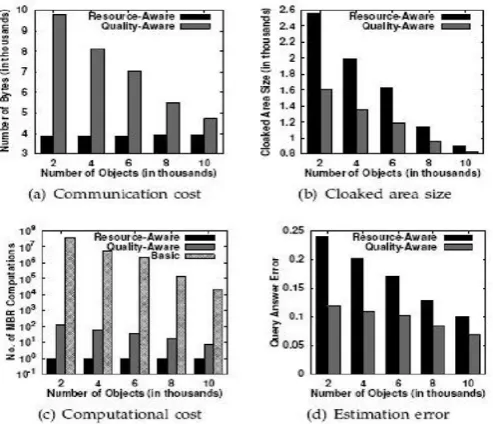
corresponds to the size of a sensor node's sensing area. The performance of our system with respect to increasing the number of objects from 2,000 to 10,000. Figure 9a shows that when the number of objects increases, the communication cost of the resource-aware algorithm is only slightly affected, but the quality-aware algorithm signi_cantly reduces the communication cost.
Fig. 4: Query region size.
The broadcast step of the resource-aware algorithm effectively allows each sensor node to _ nd an adequate number of objects to blur its sensing area. When there are more objects, the sensor node _nds smaller cloaked areas that satisfy the k-anonymity privacy requirement, as given in Figure 9b. Thus the required search space of a minimal cloaked area computed by the quality-aware algorithm becomes smaller; hence the communication cost of gathering the information of the peers in such a smaller required search space reduces.
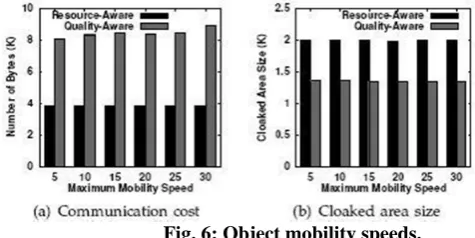
Figure 6 gives the performance of our system with respect to increasing the maximum object mobility speed from [0; 5] and [0; 30]. The results show that increasing the object mobility speed only slightly affects the communication cost and the cloaked area size of our algorithms, as depicted in Figures 6a and 6b, respectively. Since the resource-aware cloaked areas are slightly affected by the mobility speed, the object mobility speed has a very small effect on the required search space computed by the quality-aware algorithm.
Fig. 6: Object mobility speeds. V.CONCLUSION
Thus, the proposing system aims to provide privacy preserving location - monitoring services using WSN. Location monitoring is done using in-network location anonymisaton algorithms, namely Cloaked Area Determination Algorithm & Quality Aware Algorithm. Individual privacy will be preserved using k-anonymity principle. Quality of location – monitoring will be enhanced using Quality Enhancing Histogram approach. This system will be evaluated using simulated experiments. This approach will help the system to preserve location privacy of concerned individuals and at the same time, their location information released will be fruitful to the external agency. We have completed literature survey, Analysis, Design phases for developing our project. This will help us to implement our proposed system in stage – II of our project.
REFERENCES
[1] A. Harter, A. Hopper, P. Steggles, A. Ward, and P. Webster, “The Anatomy of a Context-Aware Application,” Proc. ACM MobiCom,1999.
[2] N.B. Priyantha, A. Chakraborty, and H. Balakrishnan, “The Cricket Location-Support System,” Proc. ACM MobiCom, 2000.
[3] B. Son, S. Shin, J. Kim, and Y. Her, “Implementation of the Real-Time People Counting System Using Wireless Sensor Networks,” Int’l J. Multimedia and Ubiquitous Eng., vol. 2, no. 2, pp. 63-80, 2007.
[4] Onesystems Technologies, “Counting People in Buildings,” http://www.onesystemstech.com.sg/index.php?option=com_ content&task=view&id=10, 2009.
[5] Traf-Sys Inc., “People Counting Systems,” http://www.trafsys. com/products/people-counters/thermal-sensor.aspx, 2009.
[6] M. Gruteser, G. Schelle, A. Jain, R. Han, and D. Grunwald, “Privacy-Aware Location Sensor Networks,” Proc. Ninth Conf. Hot Topics in Operating Systems (HotOS), 2003.
[7] G. Kaupins and R. Minch, “Legal and Ethical Implications of Employee Location Monitoring,” Proc. 38th Ann. Hawaii Int’l Conf. System Sciences (HICSS), 2005.
[8] Location Privacy Protection Act of 2001, http://www.
techlawjournal.com/cong107/privacy/location/s1164is.asp, 2010. [9] Title 47 United States Code Section 222 (h) (2), http://frwebgate.
access.gpo.gov/cgi-bin/getdoc.cgi?dbname=browse_usc&docid= Cite:+47USC222, 2009.
[10]D. Culler and M.S. Deborah Estrin, “Overview of Sensor Networks,” Computer, vol. 37, no. 8, pp. 41-49, Aug. 2004.
[11]A. Perrig, R. Szewczyk, V. Wen, D.E. Culler, and J.D. Tygar, “SPINS: Security Protocols for Sensor Networks,” Proc. ACM MobiCom, 2001.
[12]J. Kong and X. Hong, “ANODR: Anonymous on Demand Routing with Untraceable Routes for Mobile Ad-Hoc Networks,” Proc. ACM MobiHoc, 2003.
[13]P. Kamat, Y. Zhang, W. Trappe, and C. Ozturk, “Enhancing Source-Location Privacy in Sensor Network Routing,” Proc. 25th IEEE Int’l Conf. Distributed Computing Systems (ICDCS), 2005.
[14]S. Guo, T. He, M.F. Mokbel, J.A. Stankovic, and T.F. Abdelzaher, “On Accurate and Efficient Statistical Counting in Sensor-Based Surveillance Systems,” Proc. Fifth IEEE Int’l Conf. Mobile Ad Hoc and Sensor Systems (MASS), 2008.
[15]K. Bohrer, S. Levy, X. Liu, and E. Schonberg, “Individualized Privacy Policy Based Access Control,” Proc. Sixth Int’l Conf. Electronic Commerce Research (ICECR), 2003.
[16]E. Snekkenes, “Concepts for Personal Location Privacy Policies,” Proc. Third ACM Conf. Electronic Commerce (EC), 2001.
[17]L. Sweeney, “Achieving k-Anonymity Privacy Protection Using Generalization and Suppression,” Int’l J. Uncertainty, Fuzziness and Knowledge-Based Systems, vol. 10, no. 5, pp. 571-588, 2002.
[18]H. Kido, Y. Yanagisawa, and T. Satoh, “An Anonymous