Advances and Applications in Bioinformatics and Chemistry
Dove
press
R e v i e w
open access to scientific and medical research
Open Access Full Text Article
Tools for visualization and analysis of molecular
networks, pathways, and -omics data
Jose M villaveces Prasanna Koti
Bianca H Habermann
Max Planck institute of Biochemistry, Research Group Computational Biology, Martinsried, Germany
Correspondence: Bianca H Habermann Max Planck institute of Biochemistry, Research Group Computational Biology, Am Klopferspitz 18, 82152 Martinsried, Germany email [email protected]
Abstract: Biological pathways have become the standard way to represent the coordinated reactions and actions of a series of molecules in a cell. A series of interconnected pathways is referred to as a biological network, which denotes a more holistic view on the entanglement of cellular reactions. Biological pathways and networks are not only an appropriate approach to visualize molecular reactions. They have also become one leading method in -omics data analysis and visualization. Here, we review a set of pathway and network visualization and analysis methods and take a look at potential future developments in the field.
Keywords: biological networks, reactions, proteins, genes, signaling, protein-protein interac-tions, organisms
Introduction
The study of biological pathways is a key to understand the different processes inside a cell: proteins exert their function not in isolation but in a tightly controlled network of interactions and reactions. Activation of a pathway typically leads to a change of state in the cell: as examples, a set of genes is transcribed, new molecules are assembled, molecules are secreted, or new signals are recognized. Pathways come in different flavors, depending on their functions in the cell – the three main types are metabolic pathways, gene regulatory pathways, and signaling pathways.
Biological pathways are generally derived from experimental work in cell culture or model organisms. Many different studies are collected and integrated over time by initiatives like KEGG,1 Reactome,2 PANTHER pathway,3 BioCyc,4 or the user-curated WikiPathways5 (Table 1). The KEGG pathway database was first published in the year 1997 and has since been updated regularly. It is to our knowledge the largest pathway resource, with metabolic and signaling pathways from a pleiotropy of organisms. Reactome has pathways for a selected number of organisms, representing mostly the commonly used model organisms. BioCyc has a large collections of metabolic and regulatory pathways for ∼5,500 organisms, with components such as EcoCyc and MetaCyc,6 or HumanCyc. PANTHER pathway is a rather small resource, with currently 176 primarily signaling pathways. PANTHER pathway, however, encourages user-curation and user-creation of novel pathways. WikiPathways works under the same principles: users can contribute to the open-source pathway resource by suggesting new pathways to be added or by creating novel pathways. WikiPathways offers a good selection of organisms. Its largest organism-specific pathway resource is the one for Homo sapiens, with currently 633 available pathways.
Defining novel pathways is however a very labor- and time-intensive task. Furthermore, we cannot assume that currently existing pathway definitions are complete: over time,
Advances and Applications in Bioinformatics and Chemistry downloaded from https://www.dovepress.com/ by 118.70.13.36 on 19-Aug-2020
For personal use only.
Number of times this article has been viewed
Dovepress
villaveces et al
it has rather become clear that pathways are much more com-plicated than initially believed. They form a tightly regulated network of reactions, with many cross-reactions between our simpler definitions of individual biological pathways.
A possible solution to circumvent incomplete pathway definitions is the usage of curated protein–protein interac-tion networks. Biological networks typically contain data from protein interaction studies in addition to curated biological pathways. They are believed to represent a more complete view of the complex, biological network within a cell. Integrated biological network resources include, for instance, Pathway Commons,7 ConsensusPathDB,8 or similar meta-databases. However, interaction networks do typically not provide information on known biological pathways. Therefore, either the network has to be enriched for biological pathways or its structure has to be analyzed for more tightly connected node clusters.
Pathways are a fundamental part of interpreting -omics data, as they provide the biological context for a given observation. Hardly any -omics study is published nowa-days without integrating the data with pathway or network information. A general application of biological pathways or networks in -omics data analysis is to integrate them with numerical data from an -omics screen. To select relevant pathways for visualization, users commonly perform pathway enrichment analysis on their hit lists.
The integrative analysis of -omics data, however, increases the complexity, since it adds different dimensions to the data. Moreover, integrating -omics data boosts data size. With
growing complexity emerges the problem on how to make the data digestible for the human mind. Visual reprocessing is still one of the most forward ways to comprehend highly complex data, and thus the importance of scientific visualization, since it enhances our understanding of biological data.
A vast variety of different pathway and network visualiza-tion and analysis tools exist. In this review, we introduce a few concepts and tools that are in our view useful for analyzing and visualizing pathway and molecular network data. We further discuss general problems and future directions of biological data visualization.
Pathway-based visualization
and analysis
In principle, two categories of pathway visualizations exist: first, those that allow a simple and static representation of pathways (such as static images or pdf files), which many pathway resources already offer. Though practical for provid-ing pathway information “at a glance”, their use is limited for -omics data analysis.
The second type of pathway visualization allows users to integrate different data types with pathways by rendering user data on top of pathway maps (Table 2). The KEGG pathway web interface (http://www.genome.jp/kegg/tool/ map_pathway2.html),9 provides the possibility to color code
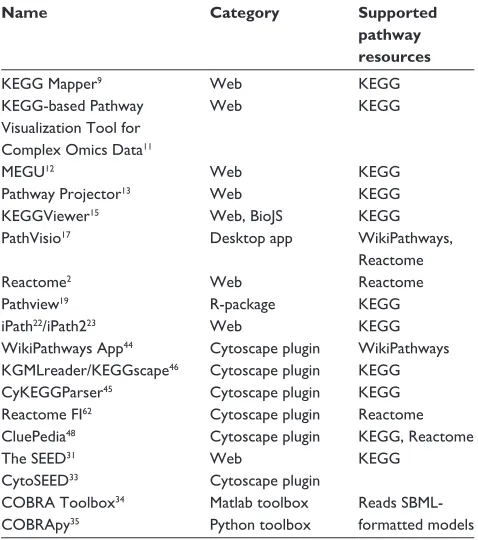
Table 2 Pathway and network visualization and analysis software
Name Category Supported
pathway resources
KeGG Mapper9 web KeGG
KeGG-based Pathway visualization Tool for Complex Omics Data11
web KeGG
MeGU12 web KeGG
Pathway Projector13 web KeGG
KeGGviewer15 web, BioJS KeGG
Pathvisio17 Desktop app wikiPathways,
Reactome
Reactome2 web Reactome
Pathview19 R-package KeGG
iPath22/iPath223 web KeGG
wikiPathways App44 Cytoscape plugin wikiPathways
KGMLreader/KeGGscape46 Cytoscape plugin KeGG
CyKeGGParser45 Cytoscape plugin KeGG
Reactome Fi62 Cytoscape plugin Reactome
CluePedia48 Cytoscape plugin KeGG, Reactome
The SeeD31 web KeGG
CytoSeeD33 Cytoscape plugin
COBRA Toolbox34 Matlab toolbox Reads SBML-
formatted models
COBRApy35 Python toolbox
Abbreviations: KeGG, Kyoto encyclopedia of Genes and Genomes; BioJS,
BioJavaScript; Reactome Fi, Reactome Functional interaction.
Table 1 Pathway resources
Name URL Formats
KeGG1 http://www.genome.jp/kegg/ BioPAX, png, KGML
Reactome2 http://www.reactome.org/ BioPAX, png, pdf
Pathway Commons7
http://www.pathwaycommons. org/
BioPAX, Sif, png
PANTHeR pathway3
http://www.pantherdb.org/ pathway/
BioPAX, SBML
wikiPathways5 http://www.wikipathways.org/ BioPAX, svg, png, pdf,
gpml Nature/NCi
Pathway interaction Database63
http://pid.nci.nih.gov/ BioPAX, jpg, svg
BioCyc4 http://biocyc.org/ BioPAX, png, SBML
iNOH84 http://inoh.hgc.jp/ BioPAX, iNOH (xml)
Netpath85 http://www.netpath.org/ BioPAX, SBML, PSi-Mi
PharmGKB86 http://www.pharmgkb.org/ BioPAX, pdf, gpml
Abbreviations: BioPAX, Biological Pathway exchange; KGML, KeGG Markup
Language; PSi-Mi, Proteomics Standards initiative Molecular interaction; SBML, Systems Biology Markup Language; NCi, National Cancer institute; iNOH, integrating Network Objects with Hierarchies; PharmGKB, Pharmacogenomics Knowledge Base; KeGG, Kyoto encyclopedia of Genes and Genomes.
Advances and Applications in Bioinformatics and Chemistry downloaded from https://www.dovepress.com/ by 118.70.13.36 on 19-Aug-2020
Dovepress Molecular networks, pathways, and -omics data
individual nodes within a pathway. The TrED database,10 for instance, has implemented the KEGG Mapper in its database to visualize metabolic pathways.
The KEGG-based Pathway Visualization Tool for Complex Omics Data11 is another practical, user-friendly method to visualize expression data on KEGG pathways. Its functionality is more complex than the pathway viewer offered by KEGG. Proteins, as well as substrates, can be shaded according to a numerical value for more than one condition. The reader might turn to the website of this visualization tool, http://www.g-language.org/data/mar-ray/,11 where a comprehensive analysis of expression data in Escherichia coli using the software has been performed and which gives a very good impression on the software’s potential.
MEGU is a web-based visualization applica-tion that allows users to map multiple layers of -omics data simultaneously.12 MEGU, in addition, provides integrated pathways by combination of several individual pathways. The MEGU website also demonstrates its usability on a comprehensive analysis of E. coli expression data. Visual-ization is, in this case, more plastic; however it is also more crowded, as several gene names are sometimes provided per node.
BioCyc4 offers a collection of pathways in a variety of organisms for analyzing and visualizing metabolic pathways. It allows the user to overlay experimental data on a pathway map by uploading a file or importing datasets from different databases. BioCyc offers in general a comprehensive tool set for genome analysis and comparison, which goes beyond most of the other pathway resources.
Pathway Projector (http://ws.g-language.org/g4/),13 another web-based visualization software, allows users to explore the network of biological pathways in a cell: the user can zoom into the network, render pathways with experimen-tal data, or predict the enriched pathways for a set of user-provided genes. Pathway Projector was, for instance, used to visualize metabolic changes upon nitrogen deficiency of the oil-rich algae Pseudochoricystis ellipsoidea.14
Finally, with KEGGViewer,15 users can integrate expres-sion data with KEGG pathways and create a web-based visualization using the open-source JavaScript library BioJS.16 KEGGViewer is purely web based. Visualization of differential expression can be done for a series of experi-ments or time points, as the tool enables users to loop over several uploaded conditions. It is so far the only web-based viewer that allows an animation of differential expression events overlaid on pathways.
Further examples include the stand-alone application PathVisio17 and the web front end of Reactome (http://www.
reactome.org/PathwayBrowser/#TOOL=AT),2 where the user can upload expression data and color a target pathway accordingly. Furthermore, PathVisio offers the possibility to fully customize the looks of a given pathway. PathVisio was, for instance, applied by Fijten et al18 to construct a custom-ized, liver-specific ligand-activated nuclear receptor pathway. The R-package Pathview19 finally has a broader approach and creates pathway visualizations from additional data types like genomic variation, literature record, and metabolite level. Pathview has, for instance, been applied by Arthur et al,20 for pathway mapping or by Gorvel et al,21 to render pathways using experimental data. Pathview depends on KEGG for pathway information. PathVisio works with WikiPathways, and for human, also with Reactome data.
Besides permitting users to make queries based on format-ted text files, the web tool iPath22 and iPath223 allows users to define visual properties like color or transparency for various nodes, similar to PathVisio. iPath/iPath2 has been extensively used for customized pathway rendering and visualization of experimental data and can conveniently be employed to visu-alize differential usage of pathways in a global pathway map (for typical applications of iPath2, see, for instance, Navid and Almaas24 and Erickson et al25). Wisecaver et al26 used iPath2 for comparative pathway analysis, and Creek et al27 used the software to model metabolic data obtained by liquid chromatography–mass spectrometry. Dutilh et al28 used iPath2 for interpreting microbial Genome-Wide Association Studies (GWAS) studies, and Guzman et al29 employed it to map microRNA sequencing data on metabolic maps.
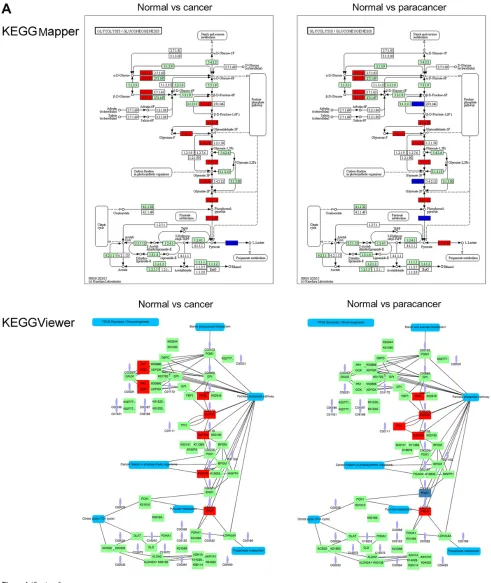
To demonstrate the usability of some of the above-mentioned tools, we selected four software packages that can render expression data on pathways from KEGG, WikiPathways, or Reactome (Figure 1). We used RNA-seq data of colon cancer patients and compared expression val-ues from control and paracancerous and cancer tissue.30 The resulting log 2 fold changes were overlaid on the Glycolysis pathway.
In Figure 1A, we used KEGG Mapper and KEGGViewer as web-based visualization tools for KEGG pathways. KEGG Mapper creates a static image, whereas KEGGViewer allows users to loop over different conditions, making it potentially easier to spot differential events between several conditions or a time series. KEGG Mapper on the other hand visual-izes the directionality of reactions, which are omitted in KEGGViewer. For metabolic pathways, the labels in KEGG Mapper are by default EC numbers, while KEGGViewer
Advances and Applications in Bioinformatics and Chemistry downloaded from https://www.dovepress.com/ by 118.70.13.36 on 19-Aug-2020
Dovepress
villaveces et al
Figure 1 (Continued)
provides gene names. However, the user can interactively use the pathway map in KEGG Mapper to retrieve detailed information on an individual gene by clicking on its node.
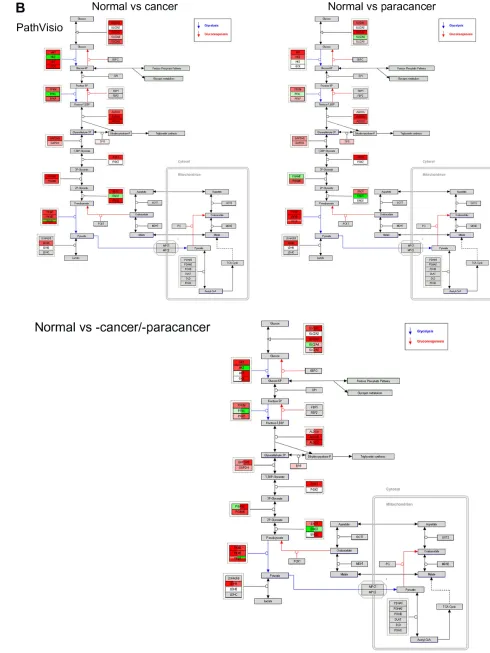
The WikiPathways version of the Glycolysis pathway was created using PathVisio (Figure 1B). PathVisio is a
very powerful method to visualize differential events in several conditions on the same map. It keeps directionality of reactions and is able to combine more than one pathway, whereby the edges (= reactions) from different pathways are color coded.
Advances and Applications in Bioinformatics and Chemistry downloaded from https://www.dovepress.com/ by 118.70.13.36 on 19-Aug-2020
Dovepress Molecular networks, pathways, and -omics data
Figure 1 (Continued)
Advances and Applications in Bioinformatics and Chemistry downloaded from https://www.dovepress.com/ by 118.70.13.36 on 19-Aug-2020
Dovepress
villaveces et al
Figure 1 visualization of differential expression data on the Glycolysis pathway using different software packages.
Notes: (A) KeGG Mapper and KeGGviewer were used to render -omics data on the KeGG Glycolysis pathway. Upregulated genes are shown in yellow, and downregulated
genes are highlighted in blue. (B) Pathvisio was used to visualize -omics data on the Glycolysis pathway from wikiPathways. Upregulated genes are colored in red shades,
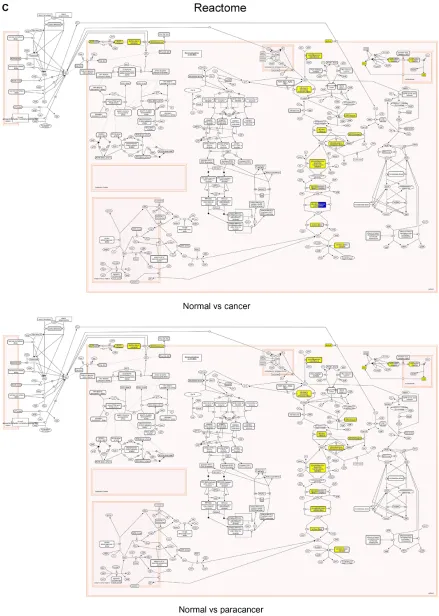
and downregulated genes are shown in green shading. Pathvisio is able to combine two datasets on the same pathway map. (C) The Reactome analysis toolbox was used to
visualize -omics data on the Glycolysis pathway. Upregulated genes are highlighted in yellow, and downregulated genes are highlighted in blue.
Advances and Applications in Bioinformatics and Chemistry downloaded from https://www.dovepress.com/ by 118.70.13.36 on 19-Aug-2020
Dovepress Molecular networks, pathways, and -omics data
Finally, we used the Reactome analysis tool to visualize differential expression of our gene set on the Glycolysis pathway (Figure 1C). Reactome gives quite a different picture of the pathway, embedding it within its neighbors. This extended visualization can be very useful in providing a more complete picture of differential expression events. It, however, can also be distracting, if the pathway map gets too large, and therefore, too crowded.
The handling of KEGG Mapper, as well as Reactome, was very easy and straightforward. The input format is simple, and KEGG Mapper accepts several identifiers; Reactome even does identifier conversion on the fly. Reac-tome moreover offers a variety of additional information on genes, such as the expression of a gene in different tissues. Both tools are easy to use for beginners and thus represent a good starting point for rendering expression data on pathways. PathVisio and KEGGViewer require more sophisticated handling. PathVisio is a desktop appli-cation, and KEGGViewer requires some knowledge of JSON (JavaScript Object Notation) and JavaScript. While the learning curves for the latter programs are steeper, both tools offer useful functionalities, such as looping over conditions (KEGGViewer) or mapping several conditions on the same pathway map (PathVisio).
In general, each pathway visualization tool has advan-tages and disadvanadvan-tages. While we give examples only for a very small collection of available pathway mapping tools, we recommend to try out several methods and to regularly look for novel developments in the field of pathway visualization.
It is noteworthy to mention that many software pack-ages for in silico metabolic modeling also allow users to visualize and analyze molecular pathways and networks with -omics data. These include, for instance, SEED (http:// seed-viewer.theseed.org/),31 and the COBRA project.32 SEED has a web-based user interface and allows to read in SEED models in Cytoscape using the plugin CytoSEED.33 COBRA can be used via Matlab34 or Python.35 We predict again a steep learning curve, as the tools are tailored for metabolic modeling applications. Depending on the complexity of the research question, however, such tools might offer more functionality.
Molecular networks analysis
Other than pathways, which contain information on direc-tionality of reactions, as well as on small compounds, protein interaction networks are a collection of nodes (proteins) connected to each other (via edges). Biological interaction
networks are typically created for one organism and contain information on all known biological interactions within the cell, whereby genetic and physical interactions are collected separately. Biological networks, though being less detailed in information than pathways, are nevertheless useful for analyzing and visualizing -omics data.
The most popular tools for network analysis are Cytoscape36 and Gephi.37 Both are open source and aid net-work exploration, manipulation, and analysis by providing filtering, layout, coloring, and clustering capabilities.
Cytoscape’s network analysis package38 and Gephi facilitate network analysis by calculating complex network parameters like average clustering coefficients, shortest paths, and node degrees, as well as centrality measures like stress centrality,39,40 betweenness centrality,39 and closeness centrality.41 The calculated parameters can be visualized as histograms and mapped as visualization attributes on the network in the form of node size and color.
Cytoscape and Gephi are able to handle diverse data-sets, which can be biological or not. However, Cytoscape tends to be biased toward biological data analysis. It is able to fetch data from I) molecular interaction data-bases, II) Biomart, and III) different ontologies out of the box. Additionally, Cytoscape is extendible via community developed plugins42 that range from Gene Ontology enrichment43 to clustering to pathway visual-ization and analysis. For instance, the Cytoscape plugins WikiPathways,44 and CyKEGGParser45 parse and visu-alize WikiPathways and KEGG pathways, respectively. KGMLReader and KEGGScape46 are plugins provided by KEGG for pathway import and visualization in Cytoscape versions 2 and 3, respectively. Similarly, the Reactome FI (Functional Interaction) plugin47 finds pathways and network patterns related to cancer and other diseases using Reactome data. Its handling is very easy and comparable to the web-based visualization application of Reactome. CluePedia48 is a search tool for new mark-ers potentially linked to known pathways. It is one of the tools that offer the potential to extend our existing pathway definitions.
Gephi, on the other hand, tends to focus on network visualization. It is based on the principle What You See Is What You Get. It is therefore able to generate powerful visualizations. Like Cytoscape, Gephi can be extended via plugins.
To illustrate the visualization capabilities of both, Cytoscape and Gephi, we collected molecular interactions from VirHostNet 2.0,49 a knowledge base dedicated to network-based exploration
Advances and Applications in Bioinformatics and Chemistry downloaded from https://www.dovepress.com/ by 118.70.13.36 on 19-Aug-2020
Dovepress
villaveces et al
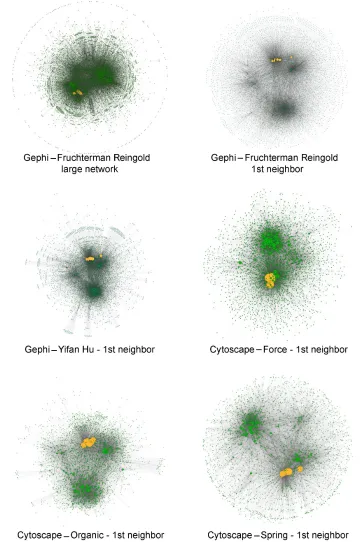
of molecular virus–host interactions. We created a network of 7,318 nodes and 296,659 edges composed of human and influ-enza A virus proteins. We further created a subnetwork with influenza A interactors and their first neighbors, which resulted in a network of 3,362 nodes and 19,352 edges. We applied several force-directed layout algorithms to those networks
(Figure 2). We chose force-directed layouts as they rely on the structure of the network and thus do not require domain-specific information. These layout types furthermore are visually more appealing as they reduce edge crossing and reveal symmetries within the graph. To visualize a large network is generally problematic. We found the Fruchterman Reingold layout as Figure 2 Network visualization using Gephi and Cytoscape using different layout algorithms.
Notes: The entire human and influenza A interactomes are shown, as well as the first neighbors of the influenza A proteins. Influenza A proteins are colored in orange, and
human nodes are shown in green. The size of the nodes indicates the connectivity of the individual proteins.
Advances and Applications in Bioinformatics and Chemistry downloaded from https://www.dovepress.com/ by 118.70.13.36 on 19-Aug-2020
Dovepress Molecular networks, pathways, and -omics data
the most appealing, as it provides some form of structure for very large networks. All chosen layout options are separating the small network in several, more tightly connected clusters, with the Spring layout performing best with respect to visual separation of subclusters.
While Cytoscape and Gephi are popular tools, there is a broad spectrum of alternatives available. For example, sigma. js50 and Cytoscape.js51 are JavaScript libraries for network visualization on the web. Additionally, software packages such as iGraph52 and NetworkX53 further support network analysis and visualization.
Pathway standardization
Pathway resources are annotated and curated separately. It is due to this fact that heterogeneous data models, formats, and application programming interfaces (APIs) are used. This makes the development of pathway visualization and analysis tools as well as the aggregation of pathway data an arduous task. Fortunately, the community using the pathway resources came together and launched the Biological Pathway Exchange (BioPAX) project54 with the aim to define a stan-dard for sharing pathway information.
BioPAX supports I) metabolic and signaling pathways, II) molecular and genetic interactions, and III) gene regu-lation data. It encapsulates the semantics related to path-ways by using controlled vocabularies such as the Gene Ontology55 and the Proteomics Standards Initiative Molecular Interaction56 vocabularies, as well as its own community-defined constructs.
Several tools have been developed to read and pro-cess BioPAX files. These include libraries like paxtools,57 rBiopaxParser,58 and BioPAX-pattern,59 and visualization and analysis tools like Cytoscape and cyPath2,60 among others.
However useful, the primary goal of BioPAX is not to satisfy data visualization but to coordinate its forces with the Systems Biology Graphical Notation (SBGN, http://www. sbgn.org/),61 community and to ensure that BioPAX can be visualized through SBGN.
SBGN is a community-developed, standard graphical lan-guage for unambiguously representing diverse biochemical and cellular events. One of the key aspects of SBGN is to minimize the effort needed to understand a pathway. It does so by limiting the number of symbols and reusing them when possible. Data providers such as Reactome and PANTHER pathway support SBGN. Additional tools supporting SBGN are listed in http://www.sbgn.org/SBGN_Software.
However, the current standards are still maturing and so not fully adopted. For example, KEGG provides
BioPAX- formatted pathways through their FTP server only. Additionally, KEGG does not follow the SBGN specification but rather uses its own graphical representation format KEGG Markup Language (http://www.kegg.jp/kegg/xml/).
Application programming interfaces
An API is a particular set of guidelines and specifications that software applications can follow to communicate with each other. It provides an interface between different applications facilitating their interaction. The combination of different APIs allows developers to create new applications, visualiza-tions, and services9,44,46,62 with use cases beyond the scope of a given data type or data source.
Most pathway data sources1–3,5,7,44,63 provide data access methods such as I) return relevant information about a given pathway (list of participants, list of complexes, etc), II) search for a keyword or pathway in a given database, III) convert identifiers from one format to another, and IV) fetch pathway maps as plain bitmap images or, in some cases, as XML files.
Additionally, a few APIs provide methods for data analysis. For example, through the PANTHER pathway API, it is possible to run an overrepresentation test: by compar-ing a list of genes to a reference list, the statistical over- or underrepresentation of selected categories is determined (eg, function, process, cellular location, protein class, or pathway). Similarly, Reactome recently developed an API devoted solely to data analysis.
With regard to the retrieval of molecular interaction data, the Proteomics Standard Initiative Common QUery InterfaCe64 provides a standardized web service to access mul-tiple interaction resources such as IntAct65 and STRING.66
Discussion
The amount of data produced by the different -omics fields is rapidly growing, mainly due to the constant development of high-throughput methods. Given the fast rate at which vast amounts of data are produced, the need for new data visualiza-tion and analysis methods is undisputed. There are, however, a series of challenges that need to be overcome.
Standard formats allow biological data to be easily exchanged, manipulated, aggregated, and analyzed. Different communities, like the Proteomics Standard Initiative67 and BioPAX, are addressing that need, for proteomics and biologi-cal pathways, respectively. However, data integration is still challenging. For instance, mapping between different identi-fiers such as protein, gene, transcript, or clone is perhaps the most common operation a bioinformatician has to perform.
Advances and Applications in Bioinformatics and Chemistry downloaded from https://www.dovepress.com/ by 118.70.13.36 on 19-Aug-2020
Dovepress
villaveces et al
Though there are several tools for mapping identifiers,68–70 significant manual effort is still required. Further develop-ment of tools and models able to link and aggregate datasets from various sources and types is crucial to enable detailed analysis and rich visualizations.
Traditionally, networks or graphs are visualized in node-link diagrams, where nodes represent entities and edges represent relationships. Such a representation is intuitive and works well for small networks, but as soon as the network size increases, so does the visualization complexity. Different techniques have been developed to try and enhance such visualizations: node filtering, edge bundling,71,72 different layout algorithms,72–75 and edge lenses are currently available in the toolbox. However, the traditional node-link visualiza-tion is limited when applied to large networks.
Alternative network visualizations such as matrix diagrams74,75 and 3D models76–79 are exiting steps towards a hairball-free visualization and may lead to much more interesting visualization techniques than the traditional node-link diagrams.
Matrix-based visualization
Matrix diagrams80,81 are based on the adjacency matrix of a given graph. The main advantage of this kind of visualization is that line crossings are impossible, which leads to a clear visualization. However, the effectiveness of a matrix diagram is heavily dependent on the order of rows and columns. There-fore, patterns may be hidden due to a nonoptimal clustering or ordering algorithm.
3D visualization
Adding an additional dimension enhances the under-standing of the topology of a large network. It increases the possibilities of layout elements avoiding undesirable visualization objects, like line crossings. 3D visualiza-tions have been used to analyze biological networks72,73 (aided by BioLayout Express3D) as well as biological pathways.78,79
virtual reality
Virtual reality offers the possibility of fully exploring com-plex datasets by using powerful interactive visualizations. For example, Redgraph82 allows users to visualize semantic social networks in a virtual reality-based environment sup-ported by the Computer-Assisted Virtual Environment83 (CAVE). Users can interact with the visualization in order to contextualize graph nodes by clicking on them in order to fetch relevant data.
Other interesting CAVE visualizations permit users to see the world at the molecular level. For example, the gold particle visualization explores the self-assembly of a ligated gold nanoparticle and proteins inside an ionic solution, while another initiative explores a glass fissure computed in nanoscale simulation. Similar approaches could be directed toward the exploration and understanding of diverse biologi-cal datasets, such as pathways, gene regulatory networks, and molecular interactions.
Acknowledgments
JMV and PK were supported by BMBF-Project 0315759 (The Virtual Liver Network, http://www.virtual-liver.de/). This work was supported by the Max Planck Society.
Author contributions
PK analyzed the RNA-seq data. JMV and BHH wrote this manuscript. All authors contributed toward data analysis, drafting and revising the paper and agree to be accountable for all aspects of the work.
Disclosure
The authors report no conflicts of interest in this work.
References
1. Goto S, Bono H, Ogata H, et al. Organizing and computing metabolic pathway data in terms of binary relations. Pac Symp Biocomput. 1997: 175–186.
2. Joshi-Tope G, Gillespie M, Vastrik I, et al. Reactome: a knowledgebase of biological pathways. Nucleic Acids Res. 2005;33(Database issue): D428–D432.
3. Mi H, Thomas P. PANTHER pathway: an ontology-based pathway database coupled with data analysis tools. Methods Mol Biol. 2009;563: 123–140.
4. Caspi R, Altman T, Billington R, et al. The MetaCyc database of metabolic pathways and enzymes and the BioCyc collection of pathway/genome databases. Nucleic Acids Res. 2014;42(Database issue):D459–D471.
5. Pico AR, Kelder T, van Iersel MP, Hanspers K, Conklin BR, Evelo C. WikiPathways: pathway editing for the people. PLoS Biol. 2008;6(7): e184.
6. Karp PD, Riley M, Saier M, Paulsen IT, Paley SM, Pellegrini-Toole A. The EcoCyc and MetaCyc databases. Nucleic Acids Res. 2000;28(1): 56–59. 7. Cerami EG, Gross BE, Demir E, et al. Pathway commons, a web resource
for biological pathway data. Nucleic Acids Res. 2011;39(Database issue):D685–D690.
8. Kamburov A, Wierling C, Lehrach H, Herwig R. ConsensusPathDB – a database for integrating human functional interaction networks. Nucleic
Acids Res. 2009;37(Database issue):D623–D628.
9. Kanehisa M, Goto S, Sato Y, Furumichi M, Tanabe M. KEGG for inte-gration and interpretation of large-scale molecular data sets. Nucleic
Acids Res. 2012;40(Database issue):D109–D114.
10. Yang J, Chen L, Wang L, Zhang W, Liu T, Jin Q. TrED: the Trichophyton
rubrum expression database. BMC Genomics. 2007;8(1):250.
11. Arakawa K, Kono N, Yamada Y, Mori H, Tomita M. KEGG-based pathway visualization tool for complex omics data. In Silico Biol. 2005; 5(4):419–423.
Advances and Applications in Bioinformatics and Chemistry downloaded from https://www.dovepress.com/ by 118.70.13.36 on 19-Aug-2020
Dovepress Molecular networks, pathways, and -omics data
12. Kono N, Arakawa K, Tomita M. MEGU: pathway mapping web-service based on KEGG and SVG. In Silico Biol. 2006;6(6):621–625. 13. Kono N, Arakawa K, Ogawa R, et al. Pathway projector: web-based
zoomable pathway browser using KEGG atlas and Google Maps API.
PLoS One. 2009;4(11):e7710.
14. Ito T, Tanaka M, Shinkawa H, et al. Metabolic and morphological changes of an oil accumulating trebouxiophycean alga in nitrogen-deficient conditions. Metabolomics. 2013;9(Suppl 1):178–187. 15. Villaveces JM, Jimenez RC, Habermann BH. KEGGViewer, a BioJS
component to visualize KEGG pathways. F1000Res. 2014;3:43. 16. Gómez J, García LJ, Salazar GA, et al. BioJS: an open source
JavaScript framework for biological data visualization. Bioinformatics. 2013;29(8):1103–1104.
17. van Iersel MP, Kelder T, Pico AR, et al. Presenting and exploring bio-logical pathways with PathVisio. BMC Bioinformatics. 2008;9:399. 18. Fijten RR, Jennen DG, van Delft JH. Pathways for ligand activated
nuclear receptors to unravel the genomic responses induced by hepa-totoxicants. Curr Drug Metab. 2013;14(10):1022–1028.
19. Luo W, Brouwer C. Pathview: an R/Bioconductor package for pathway-based data integration and visualization. Bioinformatics. 2013;29(14):1830–1831.
20. Arthur JC, Gharaibeh RZ, Mühlbauer M, et al. Microbial genomic analysis reveals the essential role of inflammation in bacteria-induced colorectal cancer. Nat Commun. 2014;5:4724.
21. Gorvel L, Textoris J, Banchereau R, et al. Intracellular bacteria interfere with dendritic cell functions: role of the type I interferon pathway. PLoS
One. 2014;9(6):e99420.
22. Letunic I, Yamada T, Kanehisa M, Bork P. iPath: interactive exploration of biochemical pathways and networks. Trends Biochem Sci. 2008; 33(3):101–103.
23. Yamada T, Letunic I, Okuda S, Kanehisa M, Bork P. iPath2.0: interactive pathway explorer. Nucleic Acids Res. 2011;39 (Web Server issue): W412–W415.
24. Navid A, Almaas E. Genome-level transcription data of Yersinia pestis analyzed with a new metabolic constraint-based approach. BMC Syst
Biol. 2012;6(1):150.
25. Erickson AR, Cantarel BL, Lamendella R, et al. Integrated metagenomics/ metaproteomics reveals human host-microbiota signatures of Crohn’s disease. PLoS One. 2012;7(11):e49138.
26. Wisecaver JH, Slot JC, Rokas A. The evolution of fungal metabolic pathways. PLoS Genet. 2014;10(12):e1004816.
27. Creek DJ, Chokkathukalam A, Jankevics A, Burgess KE, Breitling R, Barrett MP. Stable isotope-assisted metabolomics for network-wide metabolic pathway elucidation. Anal Chem. 2012;84(20):8442–8447. 28. Dutilh BE, Backus L, Edwards RA, Wels M, Bayjanov JR, van Hijum SA.
Explaining microbial phenotypes on a genomic scale: GWAS for microbes. Brief Funct Genomics. 2013;12(4):366–380.
29. Guzman F, Almerão MP, Körbes AP, Loss-Morais G, Margis R. Identification of microRNAs from Eugenia uniflora by high-throughput sequencing and bioinformatics analysis. PLoS One. 2012;7(11): e49811. 30. Wu Y, Wang X, Wu F, et al. Transcriptome profiling of the cancer,
adjacent non-tumor and distant normal tissues from a colorectal cancer patient by deep sequencing. PloS One. 2012;7(8):e41001.
31. Henry CS, DeJongh M, Best AA, Frybarger PM, Linsay B, Stevens RL. High-throughput generation, optimization and analysis of genome-scale metabolic models. Nat Biotechnol. 2010;28(9):977–982. Accessed March 31, 2015.
32. The openCOBRA Project [homepage on the Internet]. Available from: http://opencobra.sourceforge.net/openCOBRA/Welcome.html. Accessed.
33. DeJongh M, Bockstege B, Frybarger P, Hazekamp N, Kammeraad J, McGeehan T. CytoSEED: a Cytoscape plugin for viewing, manipu-lating and analyzing metabolic models created by the Model SEED.
Bioinformatics. 2012;28(6):891–892.
34. Schellenberger J, Que R, Fleming RM, et al. Quantitative prediction of cellular metabolism with constraint-based models: the COBRA Toolbox v2.0. Nat Protoc. 2011;6(9):1290–1307.
35. Ebrahim A, Lerman JA, Palsson BO, Hyduke DR. COBRApy: constraints-based reconstruction and analysis for python. BMC Syst
Biol. 2013;7(1):74.
36. Shannon P, Markiel A, Ozier O, et al. Cytoscape: a software environment for integrated models of biomolecular interaction networks. Genome
Res. 2003;13(11):2498–2504.
37. Bastian M, Heymann S, Jacomy M. Gephi: an open source software for exploring and manipulating networks. In: International AAAI Conference on Weblogs and Social Media; Palo Alto, California; 2009.
38. Doncheva NT, Assenov Y, Domingues FS, Albrecht M. Topological analysis and interactive visualization of biological networks and protein structures. Nat Protoc. 2012;7(4):670–685.
39. Brandes U. A faster algorithm for betweenness centrality. J Math Sociol. 2001;25(2):163–177.
40. Shimbel A. Structural parameters of communication networks. Bull
Math Biol. 1953;15(4):501–507.
41. Newman MEJ. A measure of betweenness centrality based on random walks. Soc Networks. 2005;27(1):39–54.
42. Saito R, Smoot ME, Ono K, et al. A travel guide to Cytoscape plugins.
Nat Methods. 2012;9(11):1069–1076.
43. Maere S, Heymans K, Kuiper M. BiNGO: a Cytoscape plugin to assess overrepresentation of gene ontology categories in biological networks.
Bioinformatics. 2005;21(16):3448–3449.
44. Kutmon M, Lotia S, Evelo CT, Pico AR. WikiPathways App for Cytoscape: making biological pathways amenable to network analysis and visualization. F1000Res. 2014;3:152.
45. Nersisyan L, Samsonyan R, Arakelyan A. CyKEGGParser: tailoring KEGG pathways to fit into systems biology analysis workflows.
F1000Res. 2014;3:145.
46. Nishida K, Ono K, Kanaya S, Takahashi K. KEGGscape: a Cytoscape app for pathway data integration. F1000Res. 2014;3:144.
47. Wu G, Stein L. A network module-based method for identifying cancer prognostic signatures. Genome Biol. 2012;13(12):R112.
48. Bindea G, Galon J, Mlecnik B. CluePedia Cytoscape plugin: pathway insights using integrated experimental and in silico data. Bioinformatics. 2013;29(5):661–663.
49. Guirimand T, Delmotte S, Navratil V. VirHostNet 2.0: surfing on the web of virus/host molecular interactions data. Nucleic Acids Res. 2015;43(Database issue):D583–D587.
50. Sigma.js [homepage on the Internet]. Available from: http://sigmajs. org/. Accessed March 31, 2015.
51. Cytoscape.js [homepage on the Internet]. Available from: https://github. com/cytoscape/cytoscape.js. Accessed March 31, 2015.
52. Csardi G, Nepusz T. The igraph software package for complex network research. Inter Journal. 2006;Complex Systems:1695.
53. Hagberg AA, Schult DA, Swart PJ. Exploring network structure, dynam-ics, and function using NetworkX. In: Proceedings of the 7th Python in Science Conference;2008;Pasadena, CA USA:11–15.
54. Demir E, Cary MP, Paley S, et al. The BioPAX community standard for pathway data sharing. Nat Biotechnol. 2010;28(9):935–942. 55. Ashburner M, Ball CA, Blake JA, et al. Gene ontology: tool for the
unification of biology. The Gene Ontology Consortium. Nat Genet. 2000;25(1):25–29.
56. Kerrien S, Orchard S, Montecchi-Palazzi L, et al. Broadening the horizon – level 2.5 of the HUPO-PSI format for molecular interactions.
BMC Biol. 2007;5:44.
57. Demir E, Babur O, Rodchenkov I, et al. Using biological pathway data with paxtools. PLoS Comput Biol. 2013;9(9):e1003194.
58. Kramer F, Bayerlová M, Klemm F, Bleckmann A, Beissbarth T. rBiopaxParser – an R package to parse, modify and visualize BioPAX data. Bioinformatics. 2013;29(4):520–522.
59. Babur O, Aksoy BA, Rodchenkov I, Sümer SO, Sander C, Demir E. Pattern search in BioPAX models. Bioinformatics. 2014;30(1): 139–140. 60. Cytoscape App Store [homepage on the Internet]. Available from: http://
apps.cytoscape.org/apps/cypath2. Accessed .
61. Le Novère N, Hucka M, Mi H, et al. The systems biology graphical nota-tion. Nat Biotechnol. 2009;27(8):735–741. Accessed March 31, 2015.
Advances and Applications in Bioinformatics and Chemistry downloaded from https://www.dovepress.com/ by 118.70.13.36 on 19-Aug-2020
Advances and Applications in Bioinformatics and Chemistry
Publish your work in this journal
Submit your manuscript here: http://www.dovepress.com/advances-and-applications-in-bioinformatics-and-chemistry-journal
Advances and Applications in Bioinformatics and Chemistry is an inter-national, peer-reviewed open-access journal that publishes articles in the following fields: Computational biomodeling; Bioinformatics; Compu-tational genomics; Molecular modeling; Protein structure modeling and structural genomics; Systems Biology; Computational Biochemistry;
Computational Biophysics; Chemoinformatics and Drug Design; In silico ADME/Tox prediction. The manuscript management system is completely online and includes a very quick and fair peer-review system, which is all easy to use. Visit http://www.dovepress.com/testimonials.php to read real quotes from published authors.
Dovepress
Dove
press
villaveces et al
62. Wu G, Feng X, Stein L. A human functional protein interaction net-work and its application to cancer data analysis. Genome Biol. 2010; 11(5):R53.
63. Schaefer CF, Anthony K, Krupa S, et al. PID: the pathway interaction database. Nucleic Acids Res. 2009;37(Database issue):D674–D679. 64. Aranda B, Blankenburg H, Kerrien S, et al. PSICQUIC and PSISCORE:
accessing and scoring molecular interactions. Nat Methods. 2011;8(7): 528–529.
65. Aranda B, Achuthan P, Alam-Faruque Y, et al. The IntAct molecular interaction database in 2010. Nucleic Acids Res. 2010;38(Database issue):D525–D531.
66. von Mering C, Jensen LJ, Snel B, et al. STRING: known and pre-dicted protein-protein associations, integrated and transferred across organisms. Nucleic Acids Res. 2005;33(Database issue):D433–D437. 67. Omenn GS, States DJ, Adamski M, et al. Overview of the HUPO plasma
proteome project: results from the pilot phase with 35 collaborating laboratories and multiple analytical groups, generating a core dataset of 3020 proteins and a publicly-available database. Proteomics. 2005; 5(13):3226–3245.
68. Côté RG, Jones P, Martens L, et al. The protein identifier referencing (PICR) service: reconciling protein identifiers across multiple source databases. BMC Bioinformatics. 2007;8:401. 69. UniProt Consortium. The universal protein resource (UniProt) in 2010.
Nucleic Acids Res. 2010;38(Database):D142–D148.
70. Huang DW, Sherman BT, Lempicki RA. Systematic and integrative analysis of large gene lists using DAVID bioinformatics resources. Nat
Protoc. 2009;4(1):44–57.
71. Zhou H, Xu P, Yuan X, Qu H. Edge bundling in information visualization.
Tsinghua Sci Technol. 2013;18(2):145–156.
72. Holten D, van Wijk JJ. Force-directed edge bundling for graph visualization. Comput Graph Forum. 2009;28(3):983–990.
73. Yee K-P, Fisher D, Dhamija R, Hearst M. Animated exploration of dynamic graphs with radial layout. In: IEEE Infovis Symposium; 2001; San Diego:43–50.
74. Dwyer T. Scalable, versatile and simple constrained graph layout.
Comput Graph Forum. 2009;1:991–998.
75. Krzywinski M, Birol I, Jones SJ, Marra MA. Hive plots – rational approach to visualizing networks. Brief Bioinform. 2012;13(5):627–644. 76. Freeman TC, Goldovsky L, Brosch M, et al. Construction, visualisation,
and clustering of transcription networks from microarray expression data. PLoS Comput Biol. 2007;3(10):2032–2042.
77. Theocharidis A, van Dongen S, Enright AJ, Freeman TC. Network visualization and analysis of gene expression data using BioLayout Express(3D). Nat Protoc. 2009;4(10):1535–1550.
78. Qeli E, Wiechert W, Freisieben B. 3D visualization and animation of metabolic networks. In: 18th European Simulation; 2004; Magdeburg. 79. Rojdestvenski I. Metabolic pathways in three dimensions. Bioinformatics.
2003;19(18):2436–2441.
80. Chen C-H, Härdle WK, Unwin A. Handbook of Data Visualization. Berlin, HD: Springer Science and Business Media; 2007.
81. Bae J, Watson B. Developing and evaluating quilts for the depiction of large layered graphs. IEEE Trans Vis Comput Graph. 2011;17(12): 2268–2275.
82. Halpin H, Zielinski DJ, Brady R, Kelly G. Exploring semantic social networks using virtual reality. In: Sheth A, Staab S, Dean M, et al., editors.
The Semantic Web – ISWC 2008. Berlin, HD: Springer; 2008: 599–614.
83. Cruz-Neira C, Sandin DJ, DeFanti TA. Surround-Screen
Projection-Based Virtual Reality: The Design and Implementation of the CAVE.
New York, NY: ACM; 1993:135–142.
84. Yamamoto S, Sakai N, Nakamura H, Fukagawa H, Fukuda K, Takagi T. INOH: ontology-based highly structured database of signal transduction pathways. Database (Oxford). 2011;2011:bar052.
85. Kandasamy K, Mohan SS, Raju R, et al. NetPath: a public resource of curated signal transduction pathways. Genome Biol. 2010;11(1):R3. 86. Whirl-Carrillo M, McDonagh EM, Hebert JM, et al. Pharmacogenomics
knowledge for personalized medicine. Clin Pharmacol Ther. 2012; 92(4):414–417.
Advances and Applications in Bioinformatics and Chemistry downloaded from https://www.dovepress.com/ by 118.70.13.36 on 19-Aug-2020