Pushing the Limit of Non-Profiling DPA using
Multivariate Leakage Model
Suvadeep Hajra
Dept. of Computer Science & Engg. Indian Institute of Technology, Kharagpur, India
Debdeep Mukhopadhyay
Dept. of Computer Science & Engg. Indian Institute of Technology, Kharagpur, India.Abstract—Profiling power attacks like Template attack and Stochastic attack optimize their performance by jointly evaluat-ing the leakages of multiple sample points. However, such mul-tivariate approaches are rare among non-profiling Differential Power Analysis (DPA) attacks, since integration of the leakage of a higher SNR sample point with the leakage of lower SNR sample point might result in a decrease in the overall performance. One of the few successful multivariate approaches is the application of Principal Component Analysis (PCA) for non-profiling DPA. However, PCA also performs sub-optimally in the presence of high noise. In this paper, a multivariate model for an FPGA platform is introduced for improving the performances of non-profiling DPA attacks. The introduction of the proposed model greatly increases the success rate of DPA attacks in the presence of high noise. The experimental results on both simulated power traces and real power traces are also provided as an evidence.
Index Terms—Differential Power Attack (DPA), Correlation Power Attack (CPA), leakage model, multivariate leakage model, non-profiling attack, multivariate distinguisher, multivariate DPA.
I. INTRODUCTION
The success rate of the Differential Power Analysis (DPA) [12],[13] attacks is largely influenced by the Signal-to-Noise Ratio (SNR) [13] of the power traces. As a consequence, in many applications, Power Analysis attacks are either preceded by various pre-processing techniques like integration (Chapter 4.5.2 of [13]), PCA [4], filtering [15] for the reduction of noise in the power traces or followed by some post-processing techniques like averaging [7],[2],[4] for the reduction of the effect of noise on the outputs of the distinguisher. These tech-niques attempt to improve the performance of the DPA attacks directly or indirectly by extracting information from multiple sample points. However, those techniques are mainly based on some heuristic approaches and do not exhibit performance improvement in many scenarios.
Various profiling attacks like Template attack [6] and Stochastic attack [16] provide optimal performance by jointly evaluating the leakages at multiple sample points. However, they use a separate profiling step for approximating the multi-variate leakage distribution [18] of the power traces. The pro-filing step requires a large number of power traces to estimate the multivariate leakage distribution with sufficient accuracy. Moreover, in most of the cases, it needs the knowledge of the secret key. Thus, optimising the performance of non-profiling DPA by considering the joint distribution of the leakages of
multiple sample points is an open issue. This work attempts to do so using a model based approach.
In this work, our goal is to gain partial information of the multivariate leakage distribution of the power traces from the overall trace statistics like mean, variance etc. which can be easily computed without knowing the secret key. It should be noted that such attempt already exists in the form of using Principal Component Analysis (PCA) [1],[17],[4] in side-channel analysis. PCA projects the data-dependent variations from all the sample points of the power traces into the first principal component by analysing its covariance matrix. However, it performs sub-optimally on noisy power traces (see Sec. VI-B). In this paper, we extend the conventional leakage model for multiple sample points which, in turn, leads us to a multivariate leakage model. The proposed multivariate leakage model, once verified for a device, can be used to predict the (relative) SNR of each sample point of the power traces. Hence, it can strengthen the existing non-profiling DPA attacks by introducing new multivariate distinguishers which can combine the results from multiple sample points according to their relative SNR. Additionally, it can be applied to improve the sub-optimal behavior of PCA (described in [4]) for low SNR power traces. The model is experimentally verified for iterative hardware architectures on the Xilinx Virtex-5 FPGA embedded in a side-channel evaluation SASEBO-GII board (see Section III). A multivariate distinguisher based on the multivariate leakage model has been introduced. We also ex-perimentally verified the effectiveness of the new distinguisher using both simulated traces with varying SNR and real traces. The results show a significant improvement in the performance of the new distinguisher for low SNR traces as compared to other existing distinguishers.
II. PRELIMINARIES
A. Notations
For the rest of the paper, we will use a calligraphic letter like
X to denote a finite set and the corresponding capital letter X to denote a random variable over the set. Corresponding small letterx is used to denote a particular realisation ofX. P(.) is used to denote the probability of the event. E[X], σX andV ar(X)are used to denote mean, standard deviation
and variance of the random variable X respectively. We also denote byCov(X, Y)andCorr(X, Y), the covariance and the Pearson’s correlation coefficient between random variablesX and Y respectively. We denote a vector {x0, x2,· · ·, xk} by {xi}0≤i≤k. Gaussian distribution with mean m and standard
deviation σis represented by N(m, σ).
B. Differential Power Analysis
We will mainly follow the formalisation of Differential Power Analysis by Standaert et al. in [18]. It is briefly described below.
Let E be an iterative block cipher with block size b and number of rounds r. LetS be a key dependent intermediate variable of E. S is called target and satisfies S = Fk∗(X),
where X be a random variable representing a part of the known plaintext or ciphertext andFk∗ :X → S be a function
determined by both the algorithm and the subkeyk∗∈ K(note that subkey is a small part of the secret key such that it is efficiently enumerable). We denote byLtthe random variable
that represents the side channel leakage of an implementation of E at time instant t,0≤t < rT whereT is the number of samples collected per round.
In DPA, the attacker collects a set of traces O = {o0,· · ·, oq−1} resulted from the encryption (or decryption)
of a sequence of q plaintexts (or ciphertexts) {p0,· · ·, pq−1}
(or {c0,· · ·, cq−1}) using the fixed but unknown key with
subkeyk∗∈ Kin a physical implementation ofE. It should be noted that each oi is a vector of sizerT i.e.oi={oi,j}rTj=0−1
where oi,j be the leakages of the jth time instant during the
ithencryption (or decryption). Then, a distinguisherDis used
which by taking the leakage vector {o0,· · · , oq−1} and the corresponding input vector {x0,· · · , xq−1}as inputs, outputs a distinguishing vectorD ={dk}k∈K. For a successful attack,
k∗=argmax
k∈K dk holds with a non-negligible probability.
C. Leakage Model and Univariate Distinguisher
In DPA, it is assumed that the power consumption of a CMOS device at a time instant is dependent on the interme-diate value manipulated at that point. Suppose thetargetS is manipulated at time instantt∗(call itinterestingtime instant). According to the conventional leakage model [5]:
Lt∗= ˜Ψ(S) +N (1)
= ˜Ψ(Fk∗(X)) +N (2)
where the function Ψ :˜ S → R maps the target S to the
deterministic part of the leakage and N ∼N(m, σ) accounts for the independent noise.
At the time of attack, the attacker chooses a suitable predic-tion modelΨ :S →Rand computes the hypothetical leakage
vector denoted by random variablePk = Ψ(Sk) = Ψ(Fk(X))
for each key hypothesisk∈ K. Inunivariate DPA, the attacker is provided with the leakage of the interesting time instant t∗, Lt∗ = ˜Ψ(Fk∗(X)) +N. On receiving the leakage, she
computes the distinguishing vector D = {dk}k∈K such that
dk =D(Lt∗, Pk) =D( ˜Ψ(Fk∗(X)) +N,Ψ(Fk(X))) using a
distinguisherD.
When the hardware leakage behavior follows a well known leakage model like Hamming weight model or Hamming distance model, some known prediction model Ψ closely approximates Ψ˜ i.e. Ψ(˜ s) ≈ a·Ψ(s) holds for some real constantaand for alls∈ S. Then, Eq. 1 can be approximated as
Lt∗=a·Ψ(S) +N (3)
Thus, the actual leakage vector Lt∗ is linearly related to
the hypothetical leakage vector for the correct key Pk∗ = Ψ(Fk∗(X)). On the other hand, there is no such relation
betweenLt∗ and the hypothetical leakage vector for a wrong
key Pk = Ψ(Fk(X)) since Fk∗(X) and Fk(X) are almost
independent fork6=k∗. In Correlation Power Analysis (CPA) [5], Pearson’s correlation is used to detect the linearity be-tweenLt∗andPk by computingdk =Corr(a·Ψ(Fk∗(X)) +
N,Ψ(Fk(X))) for all k ∈ K. Since, Pearson’s correlation
detects the linear relation between two variables, it performs better than other attacks like Mutual Information Analysis (MIA) [8], Difference of Mean (DoM) [12]. When the hard-ware leakage model is not sufficiently known, ‘generic’ attacks like MIA perform better than CPA. In the rest of the paper, we will consider only the scenarios where the hardware follows a well known leakage behavior.
D. Multivariate DPA
In most of the practical scenarios, the point of interest t∗ is not known before hand. Thus in practice, DPA attacks are multivariate in nature i.e. they take the leakages of multiple sample points as the inputs and generate the output. Most common form of multivariate DPA attacks applies a univariate distinguisher on each of the sample points independently and then, simply chooses the best result among those. However, in a different strategy, the attacker sometimes uses multivari-ate distinguishers which produce results based on the joint evaluation of the leakages at multiple sample points. Such multivariate distinguishers are common in profiling attacks like Template attack [6] and Stochastic attack [16].
Though multivariate distinguishers on unprotected imple-mentations are rare in non-profiling context (example exists in [19]), there have been several attempts to improve the success rates of non-profiling DPA attacks by integrating
integration of the output of a high SNR sample point to that of low SNR sample point. Thus, a successful integration of the leakages of multiple sample points requires the successful determination of the relative SNR of each sample point. We take a step in this direction in the next section.
III. PROFILING THEPOWERTRACES OFAES In this section, we investigate the behaviour of the leakages of an AES implementation over a wide range of sample points due to the computation of an intermediate variable. We start with an unprotected AES which is implemented using parallel iterative hardware architecture on GII. SASEBO-GII [11] is a standard side-channel evaluation board which consists of FPGA device Virtex-5 xc5vlx50 for implementing cryptographic algorithms. The traces acquired using this setup are not vertically aligned. The vertical alignment of the traces are performed by subtracting the DC bias from each sample point of the trace. The DC bias of each trace is computed by averaging the leakages of a window taken from a region where no computation is going on.
We choose the target S to be the128-bit input to the last round which is computed from the ciphertext using the secret key. Consequently, predicted leakage P = Pk∗ is calculated
using Hamming distant model i.e. by computing the Hamming distance of the target S and the ciphertext. To examine how the dependency between the actual leakageLtand the correct
predicted leakage P varies over a range of sample points, we estimate the following metrics over300sample points around the register update of the last round of AES using 20,000
power traces.
1) Squared Pearson’s Correlation between Data Dependent Leakage and Predicted Leakage (SCDP): It is defined as follows:
SCDPt=Corr2(E[Lt|P], P)
It reveals the linear dependency between the determinis-tic leakageE[Lt|P]at sample pointtand the predicted leakage P. It should be noted that if the leakage of a sample point t follows Eq. 3, then the empirical estimation of SCDPt using a finite number of traces
will be close to one. On the other hand, if no such relation holds for a sample point t, SCDPt will be
almost zero.
2) Variation of Data Dependent Leakage (VDL):
V DLt=V ar(E[Lt|P])
It reveals the variations in leakage due to the predicted leakage P at sample point t. Sometimes, it is used to quantify the signal in the leakage. On the other hand, noise is quantified byV ar(Lt−E[Lt|P]).
3) Squared Mean Leakage (SML):
SM Lt=E2[Lt]
It has been included to study the behavior of the other metrics in relation with the mean leakage.
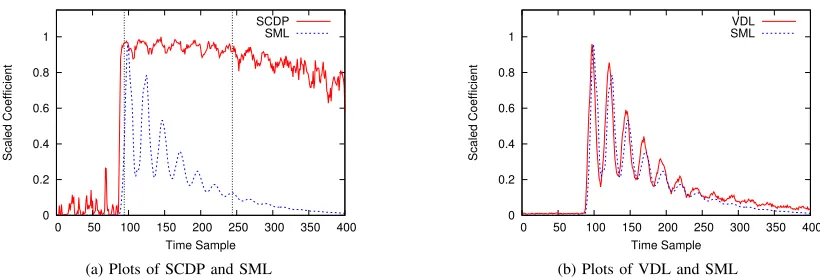
Fig. 1a shows that as the cycle begins, with the mean leak-age (SML), SCDP also rises rapidly, remains almost constant for about150sample points and then it decreases slowly. The slight fluctuations in the curve are due to the presence of small amount of noise after averaging a limited number of power traces. This leads us to the following observation:
Observation 1: The deterministic part of the leakages at a
largenumber of sample points show high linear dependencies with the correct predicted leakage P.
Various profiling attacks also take advantage of the data de-pendency of multiple leakage points. However, they are more generic since they can consider different prediction model for different sample points at the cost of expensive profiling step. From figure 1b, we see that VDL almost superimposes on SML i.e. VDL is highly correlated to SML. This leads us to the following observation:
Observation 2: The variation in the deterministic part of the leakages is correlated to the square of the mean leakages. In other words, the second observation states that the mag-nitude of the variation at a sample point due to target S is proportional to the mean value (strength) of the leakage at that sample point. It should be noted that a similar kind of observation can be found in Chapter 4.3.2 of [13] for the leakages of a micro-controller. The authors have also suggested several trace compression techniques based on the observation and have shown their usefulness to attack software implementation of AES. However, to the best of the authors’ knowledge, no attempt has been made to incorporate these observations into the conventional leakage model. In the next section, we extend the conventional leakage model by using these two observations.
IV. INTRODUCINGMULTIVARIATELEAKAGEMODEL In [12], Kocher et al. mentioned the possibility of using the leakages of multiple sample points by the attacker in higher-order DPA. Later in [14], Messerges formalized the notion of nth-order DPA as an attack mechanism which exploits the leakages of ndifferent sample points corresponding to n
different intermediate values calculated during the execution of the algorithm. In this paper, we are interested in n-variate
DPA which can exploit the leakages of n different sample points related to asingleintermediate value calculated during the execution of the algorithm. Motivated by the observations of Sec. III, we definen-variate leakage model as follows.
Definition 1: In n-variate leakage model, leakages of n distinct sample points are assumed to be dependent upon a single intermediate value calculated during the execution of an algorithm.
Note that sinceCorr(E[Lt|P], P)≈1fort0≤t < t0+τ,
0 0.2 0.4 0.6 0.8 1
0 50 100 150 200 250 300 350 400
Scaled Coefficient
Time Sample SCDP
SML
(a) Plots of SCDP and SML
0 0.2 0.4 0.6 0.8 1
0 50 100 150 200 250 300 350 400
Scaled Coefficient
Time Sample VDL SML
(b) Plots of VDL and SML Fig. 1: Plots of the chosen metrics in the last round of unprotected implementation of AES
A. A Multivariate Leakage Model for Iterative Hardware Architecture on FPGA Platform
Observation 1 and 2 immediately extend the conventional leakage model given by Eq. (3), into the following multivariate leakage model:
Lt=at·Ψ(S) +Nt
=at·P+Nt, t0≤t < t0+τ (4)
where at ∈ R and the random vector {Nt0,· · · , Nt0+τ−1} follows a multivariate Gaussian distribution with zero mean vector. It should be noted that the linear relation in Eq. (4) is a consequence of Observation 1 while Observation 2 enforces mean vector of the multivariate Gaussian distribution to be a zero vector. In a parallel iterative hardware architecture, a single round consists of several parallel S-boxes and the attacker targets only a part of it (usually a single S-box). Thus, in addition to the predicted leakageP due to the computation of the targetS=Fk∗(X), leakage due to the computation of
the other parallel bits adds to it. This is known as algorithmic noise and we denote it byU. It should be noted that for a fully serialized architecture, U takes the value zero. Leakages due to the key bits and the control bits is denoted by c. Since key scheduling and the controlling operations are fixed for a fixed round in all the encryptions, cis constant for all the inputs.
Thus, we can adopt Eq. 4 to incorporate these new variables as follows:
Lt=at·(P+U+c) +Nt, t0≤t < t0+τ (5)
=at·(I+c) +Nt (6)
where I = P+U. We are interested in the leakages of the above window namely {t0, t0+ 1,· · ·, t0+τ−1} that can
be roughly determined by the clock cycle in which the target operation is being performed (see Section VI-C). We denote this time span by{0,1,· · ·, τ−1}and in the rest of the paper, power trace is referred by the sample points of this time span only.
Next section demonstrates how this model can be useful for predicting the relative SNR of each sample point of a power trace in low SNR scenarios.
V. APPLICATION OF THEMULTIVARIATELEAKAGE MODEL TOESTIMATE THESNROF THESAMPLEPOINTS
Mangard et al. quantifies the information leakage for each sample point of a trace using signal-to-noise ratio (SNR) [13]. In our context, it can be defined as
SN Rt=
V ar(E[Lt|I])
V ar(Lt−E[Lt|I])
(7)
Here,V ar(E[Lt|I])quantifies the signal part of the leakage andV ar(Lt−E[Lt|I])quantifies the electronic noise.
There are several existing techniques to compute the SNR of the sample points. They are mostly used to compress the traces in profiling attacks. But, most of them such as sosd,
sost [9] assume the key to be known. Other techniques like PCA perform sub-optimally in the presence of high noise [4]. However, the multivariate leakage model provides a way to estimate the relative SNR (i.e. SNR of a sample point with respect to the SNR of the other sample points instead of the absolute value of the SNR) of each sample point without the knowledge of the secret key, hence, makes it applicable to non-profiling setup also. Letα(t),µ2
L(t)andσ2L(t)be the functions
over time such thatα(t) =SN Rt,µ2L(t) =SM Lt=E2[Lt]
andσ2
L(t) =V ar(Lt). Then, the multivariate leakage model
given in Eq. (6) leads us to Proposition 1.
Proposition 1: Suppose that the power traces are following the multivariate leakage model described in Eq. (6). If the variance of the electronic noise at each sample point is signif-icantly higher than the signal variance i.e. V ar(E[Lt|I])
V ar(Lt−E[Lt|I])for 0≤t < τ, then the SNR of a sample
pointt,α(t)is proportional to Squared Mean to Variance Ratio (SMVR) µ
2 L(t)
σ2 L(t)
.
Proof:By taking the expectation of both sides of Eq. (6), we get
E[Lt] =at·(E[I] +c)
or, at=
E[Lt]
E[I] +c (8)
α(t) = V ar(E[Lt|I])
V ar(Lt−E[Lt|I]),
= V ar(at·(I+E[U]+c))
V ar(Lt)−V ar(E[Lt|I]), from Eq. (5) and
indepen-dent noise assumption
≈ V ar(atI)
V ar(Lt), since V ar(E[Lt|I])
V ar(Lt − E[Lt|I]) <
V ar(Lt)
= a2tV ar(I)
V ar(Lt),
= E2[Lt]V ar(I)
(E[I]+c)2V ar(L
t), from Eq. (8)
= µ2L(t)
σ2 L(t)
×(E[I]+c)V ar(I)2 from the definition ofµ2L(t)
andσL2(t)
It should be noted that both µL(t) and σL(t) can be
computed without knowing the correct key. Thus, Proposition 1 can be used to determine the relative SNR of a sample point in the presence of high noise. Next, we will see how it can be useful for designing multivariate distinguishers in non-profiling DPA attacks.
VI. DESIGNING NEWMULTIVARIATEDISTINGUISHERS The performances of many univariate distinguishers in-cluding CPA and classical DPA are susceptible to the level of SNR. Their performances get better at a sample point with higher SNR and become worse at a sample point with lower SNR [13]. We can adopt a univariate distinguisher for multivariate DPA by applying the univariate distinguisher on each sample point of the power traces separately and combining the result of each sample point using a second level distinguisher according to their relative SNR.
To elaborate the above approach, let us consider D to be a univariate distinguisher and we apply it to each sample point t,0≤t < τ, of the power traces independently. At the end,D outputs τ distinguishing vectors {D(t)}τ−1
t=0 where eachD(t)
is a vector of |K|elements i.e.D(t) ={dk(t)}k∈K. Thus, the vector {dk(0),· · ·, dk(τ −1)} represents the distinguishing
values for the key hypothesis k at all the τ sample points. Since the correct key hypothesis k∗ can compute the target
S correctly, the distinguishing values for the correct key at time t,dk∗(t)depends on the SNR at t, and thus on SMVR
µ2 L(t)/σ
2
L(t) (thanks to Proposition 1). In other words, the
vector {dk∗(0),· · · , dk∗(τ−1)} will be strongly ‘correlated’
to the SMVR vector{µ2L(0)
σ2 L(0)
,· · · ,µ2L(τ−1)
σ2 L(τ−1)
}. On the other hand, since a wrong key hypothesis k 6= k∗ wrongly guesses the value of S i.e. S 6= Fk(X), there is almost no correlation
between{dk(0),· · · , dk(τ−1)}and the SMVR vector. Thus,
we can deploy a second level distinguisher D˜ to detect the correlation between the vectors {µ2L(t)
σ2 L(t)
}τt=0−1 and {dk(t)}τt=0−1
for all key hypothesis k∈ K and returnk as the correct key for which the correlation is maximum.
To summarise, a univariate distinguisherDcan be extended for multivariate DPA as follows:
1) Apply the distinguisherD for each sample pointt,0≤
t < τ, of the power traces independently. At the end,D outputsτ distinguishing vectors{D(t)}τt=0−1 where each D(t)is a vector of|K|elements i.e.D(t) ={dk(t)}k∈K. 2) Construct|K|vectors{dk(t)}τt=0−1 for each key
hypoth-esis k ∈ K. And also construct the SMVR vector
{µ2L(t)
σ2 L(t)
}τ−1 t=0.
3) Employ a second univariate distinguisher D˜ which outputs a distinguishing vector D =˜ {d˜k}k∈K where
˜
dk = ˜D({dk(t)}τt=0−1,{ µ2
L(t)
σ2 L(t)
}τt=0−1).
4) Returnk as the correct key for whichd˜k is maximum.
We will now explore this approach in several contexts in the following sections.
-0.2 0 0.2 0.4 0.6 0.8 1 1.2
1600 1800 2000 2200 3000
Scaled Value
Sample Point Target Clock Cycle
Mean Leakage / SD Correlation
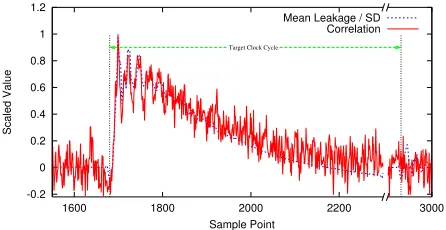
Fig. 2: Plots of the mean leakage normalised by the standard deviation and correlation of the correct key during the last round register update during AES encryption.
A. Extending CPA for Multivariate Leakage Model
In order to construct an effective multivariate distinguisher, we choose CPA as the first level univariate distinguisher since it is well accepted as one of the best performer when the hardware leakage follows a standard leakage model [3],[20]. To choose a proper second level distinguisher, we compute the Pearson correlationρk∗(t)between the leakage at sample
pointtand the predicted leakage for the correct key hypothesis P = Ψ(S) = Ψ(Fk∗(X))using Eq. (5).
ρk∗(t) =
Cov(Lt, P)
p
V ar(Lt)V ar(P)
=Cov(pat(P+U+c) +Nt, P)
V ar(Lt)V ar(P)
=patCov(P, P)
V ar(Lt)V ar(P)
=p atV ar(P)
V ar(Lt)V ar(P)
=µL(t)
σL(t)
× σP
E[I] +c, from Eq. 8 (9)
According to Eq. (9), not only the magnitude of ρk∗(t) is
proportional to µL(t)
σL(t) but the sign ofρk
by the sign ofµL(t). Moreover, the relation no more depends
on the high noise condition as in Proposition 1, thus, is applicable to power traces with all SNR levels.
Fig 2 plots the mean leakage µL(t)
σL(t) and the correlation ρk∗(t)between leakage Lt and the correct key guess for the
first S-box at200sample points during the last round of the en-cryptions. To generate it, we have used32,000traces collected from parallel iterative implementation of AES on SASEBO-GII (please refer to Section III. The figure clearly indicates that the correlation curve has high positive correlation with the mean leakage curve.
To exploit the above knowledge of the relation between ρk∗(t)and µL(t)
σL(t), we propose the following distinguisher:
Scalar Product It takes the scalar product of the vectors
{ρk(t)}t=0τ−1 and {m(t)} τ−1
t=0 i.e. d˜k = P
τ−1
t=0 ρk(t)m(t)
where m(t) = sgn(µL(t))µ2L(t)/σL2(t). Here function
sgn(µL(t)) takes the value 1 for µL(t) ≥ 0 and −1
otherwise.
In other words, the distinguisher takes the sum of the outputs of CPA at all the sample points weighted by the ‘signed’ SMVR of each sample point.
B. Improving the Performance of PCA for low SNR Traces
PCA is a well known statistical technique for dimensionality reduction based on variations of data. It converts a set of interrelated observations (variables) into a set of new variables called principle components (PCs) such that the PCs are uncorrelated to each other and they are ordered decreasingly by their variance. Thus, first few PCs contain most of the variations in data while the later components capture a small amount of variations which are assumed to be caused by noise. Thus, the removal of the later components (which have lower variance) while preserving the first few components is a common noise reduction technique.
PCA was first introduced in the context of SCA by Archam-beau et al. [1] where they used it to reduce the dimensions of the traces for Template attack. Later, in [17], Sylvain et al. introduced it as a non-profiling distinguisher and in [4], Batina et al. introduced it as a pre-processing technique. For low noise traces, the PCA on the power traces (represented as matrix with rows containing different traces and columns containing different sample points) projects the variations caused by the target S into the first PC (since it is the largest component). Thus, univariate DPA on the first PC yields better result.
However in [4], Batina et al. also mentioned the limitation of PCA in high noise scenarios. Since, in high noise scenarios, the larger part of the variations is caused by the noise rather than the signal, the SNR’s of the first few PCs are in fact quite low. Thus, univariate distinguishers on the first PC perform badly. Moreover, it is difficult to identify the sample points with higher SNR. However, based on some empirical observations, [4] has suggested a new distinguisher, namely
CPA Abs-Avg distinguisher, which takes the average of the absolute value of the correlations of each sample points to compute the final output.
We suggest to use the multivariate model to find the princi-pal components (PCs) having more information. Since PCA is a linear transformation, the principal component decomposi-tion of the power trace matrixO ={oi,j}
(q−1,τ−1)
(i,j)=(0,0)(recall that,
oi,jstands for the leakage ofjthsample point of theithtrace) is
given by theq×τmatrixO = OW˜ whereW is aτ×τmatrix. Thejthcolumn ofWrepresents the eigenvector corresponding
to the jth largest eigenvalue of the covariance matrix of O.
Each column of O˜ represents a single PC and each row represents an observation or a trace. Due to the linearity of the transformation, the principal component decomposition traces
˜
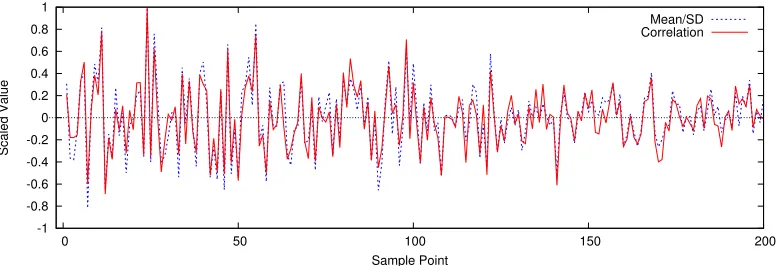
O also follows the multivariate model given by Eq. 5 and 6 . Thus, we can apply Proposition 1 on O˜. Fig 3 validates Eq. 9 (a consequence of the multivariate leakage model) by plotting the correlation of the correct key and the mean leakage normalised by the standard deviation at each sample points of the principal component decomposition of the set T8
sim. A
consequence of this observation is thatScalar Productcan be directly applied to the principal component decomposition of the power traces.
It should be noted that most of the tools like MATLABR
removes the mean of each sample point of the original traces as the first step of the transformation. Thus, we computed the mean vector µL = {µL(t)}τt=0−1 of the observation matrix O
before applying the transformation. And after the transforma-tion, we multipliedµL by the eigenvector matrixWobtained
from the MATLABR
function ‘princomp’ to getµL˜ =µLW,
the mean vector of the principal component decomposition traces.
C. Determination of Window
For an iterative hardware architecture, the window can be set to the whole period of the clock cycle in which the target operation is being performed. However, to reduce the compu-tational complexity resulting from performing computations on all points in the clock period, other measures can be taken based on SMVR. For our experiments, we have roughly chosen the window from the beginning of the target clock cycle up to a sample point for which the SMVR is slightly greater than zero.
VII. ATTACKS ONSIMULATEDTRACES WITH DIFFERENT SNRLEVELS
To test the effectiveness of the new approaches, we collected a set of 20,000 power traces: Torg of the encryptions of
AES implemented on the setup described in Section III using parallel iterative hardware architecture. We then removed the noises of all the traces (using the correct key) and created a set of noise-less traces:Tnl. Next, we created4sets of simulated
traces each having20,000traces:T1
sim,Tsim2 ,Tsim4 andTsim8
by adding a Gaussian noise to each sample point ofTnlhaving
standard deviation 1, 2,4 and8 times the standard deviation of the noise at the same sample point ofTorg respectively. It
should be noted that the average noise variance ofT2 sim,Tsim4
and T8
sim are respectively 22, 42 and 82 times the average
noise variance ofT1
-1 -0.8 -0.6 -0.4 -0.2 0 0.2 0.4 0.6 0.8 1
0 50 100 150 200
Scaled Value
Sample Point
Mean/SD Correlation
Fig. 3: Plots of the mean leakage normalised by the standard deviation and the correlation of the correct key at the first 200
PCs of the principal component decomposition of the set T8 sim.
signal variances. Thus, average SNR of T2
sim,Tsim4 andTsim8
are 1/22,1/42and1/82 times the SNR ofT1
sim respectively.
We appliedScalar Product, classical CPA [5] andCPA Abs-Avg[4] to attack the above4sets of simulated traces. We also applied the above three distinguishers on the principal com-ponent decomposition of the four sets by transforming them using MATLABR
function ‘princomp’ (refer to Sec. VI-B). For CPA on PCs, we tested both CPA on first PC and standard multivariate CPA on all the PCs. However, CPA on first PC yields better results. Profiling phase of Stochastic attack also determines the correct key as a byproduct of estimating the deterministic leakages. We also implemented that as a distinguisher. In the rest of the paper, we refer to this distinguisher as Stochasticdistinguisher.
To compare the performances of the distinguishers, we have used average guessing entropy as a metric. The guessing entropy [18] of a distinguisher is given by the average rank of the correct key. Thus, it decreases as the attack becomes better and reaches one if it can find the correct key in all the trials. Average guessing entropy is computed by taking the average of the guessing entropy’s of all the16S-boxes. To compute the guessing entropy of the above distinguishers, we divided each set of 20,000 simulated traces among four groups of 5,000
traces and applied the distinguishers on each group separately and took the average of their results.
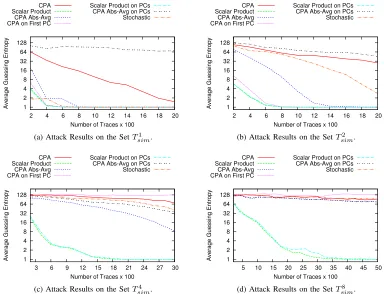
Average guessing entropy of the attacks on the four sets of simulated traces are shown in Fig. 4. From this figure, we can summarise the following observations:
1) Scalar Product performs far better than the other dis-tinguishers on both the original traces and the principal component decomposition of the traces. Moreover, the differences of the performances are more if the average noise level of the trace-set is more.
2) When the average noise level is comparatively low i.e. for the trace-sets T1
sim and Tsim2 , CPA on first PC
performs almost equally well toScalar Product. This is due to the fact that most of the data dependent variations (signal part of the leakage) have been projected to the first PC by PCA. Thus Scalar Product does not get any extra advantage overCPA on first PCby extracting
information from multiple sample points. 3) The average noise levels of the trace-setsT4
simandTsim8
are high enough to make PCA unable to project all the data dependent variations into the first PC. Rather, in Fig. 3, we can see that data gets correlated to multiple sample points of the principal component decomposition traces of Tsim8 . As a result, Scalar Product on PCs
performs far better thanCPA on first PC.
4) Scalar Producton the original traces andScalar Product on PCs perform similarly though the later requires PCA as a pre-processing step which is computationally intensive.
5) The performance of CPA Abs-Avg on the principal component decomposition degrades for high SNR traces also. This is due to the fact that for high SNR traces most of the data variations are captured by the first few PCs only. Thus, CPA Abs-Avg reduces the effective SNR of the first few PCs by averaging them with rest of the low SNR sample points.
6) Though the non-profiling Stochastic attack performs quite well for Tsim1 , it performs badly for other sets of traces.
VIII. ATTACKS ONREALTRACES
To verify the effectiveness of the proposed distinguisher on real traces, we collected 20 sets of 2,000 traces of an AES implementation on SASEBO-GII (please refer to Section III). The implementation is based on parallel iterative architecture. The S-boxes are implemented using Xilinx device primitive: distributed ROM. Using our setup, the maximum SNR of the obtained power traces is close to0.42which is quite high.
Average Guessing entropy’s of Scalar Product along with classical CPA, CPA Abs-Avg and non-profiling Stochastic
attacks are shown in Fig. 5. It should be noted that the obtained power traces contain some correlated noise (noises in multiple sample points are correlated among themselves). As a result, the third PC instead of the first PC shows the maximum SNR in the principal component decomposition of the traces. Thus,
1 2 4 8 16 32 64 128
2 4 6 8 10 12 14 16 18 20
Average Guessing Entropy
Number of Traces x 100 CPA
Scalar Product CPA Abs-Avg CPA on First PC
Scalar Product on PCs CPA Abs-Avg on PCs Stochastic
(a) Attack Results on the SetT1
sim.
1 2 4 8 16 32 64 128
2 4 6 8 10 12 14 16 18 20
Average Guessing Entropy
Number of Traces x 100 CPA
Scalar Product CPA Abs-Avg CPA on First PC
Scalar Product on PCs CPA Abs-Avg on PCs Stochastic
(b) Attack Results on the SetT2
sim.
1 2 4 8 16 32 64 128
3 6 9 12 15 18 21 24 27 30
Average Guessing Entropy
Number of Traces x 100 CPA
Scalar Product CPA Abs-Avg CPA on First PC
Scalar Product on PCs CPA Abs-Avg on PCs Stochastic
(c) Attack Results on the SetT4
sim.
1 2 4 8 16 32 64 128
5 10 15 20 25 30 35 40 45 50
Average Guessing Entropy
Number of Traces x 100 CPA
Scalar Product CPA Abs-Avg CPA on First PC
Scalar Product on PCs CPA Abs-Avg on PCs Stochastic
(d) Attack Results on the SetT8
sim.
Fig. 4: Plots of the average guessing entropy of various distinguishers with the increase in the number of power traces on the four trace-sets having different average SNR.
Stochastic attack is performed on 160 sample points while other attacks are performed on300 sample points.
1 2 4 8 16 32 64 128
2 4 6 8 10 12 14 16 18 20
Average Guessing Entropy
Number of Traces x 100 CPA
Scalar Product CPA Abs-Avg
CPA on PCs CPA Abs-Avg on PCs Stochastic
Fig. 5: Average Guessing Entropy of various attacks on the real traces of a parallel iterative implementation of AES on Xilinx FPGA device Virtex-5.
It is clear from Fig. 5 that Scalar Product is performing better than all the other attacks. It takes about 400 traces to bring down the average guessing entropy below two, while all other attacks take more than 1,000 traces for the same.
IX. CONCLUSION
In this paper, we have introduced a multivariate leakage model for iterative hardware architecture on FPGA device Virtex-5. The introduced model allows an attacker to predict the relative SNR of each sample point of the power traces with-out even knowing the correct key. We have further discussed how existing univariate distinguishers can be strengthened by extending it tomultivariatedistinguishers with the help of the relative SNR of the sample points. We have also introduced and empirically verified one multivariate distinguisher namely
Scalar Product using both simulated power traces and real power traces. The results show that Scalar Product performs far better than the classical CPA as well as the recently introducedCPA Abs-Avg Distinguisheron low SNR scenarios which are more likely in future devices.
Several advanced DSP techniques like Wavelet transforms have been recently introduced in side-channel literature. How-ever, optimal application of such techniques either requires the knowledge of the correct key or depends on some heuristically chosen parameters such as ‘scale level’. It can be an interesting study to see the applicability of the proposed multivariate leakage model in those situations.
based on multivariate leakage model on such other platforms could be worthy.
REFERENCES
[1] C. Archambeau, E. Peeters, F.-X. Standaert, and J.-J. Quisquater. Tem-plate Attacks in Principal Subspaces. In Goubin and Matsui [10], pages 1–14.
[2] L. Batina, B. Gierlichs, and K. Lemke-Rust. Differential Cluster Analysis. In C. Clavier and K. Gaj, editors,CHES, volume 5747 of
Lecture Notes in Computer Science, pages 112–127. Springer, 2009. [3] L. Batina, B. Gierlichs, E. Prouff, M. Rivain, F.-X. Standaert, and
N. Veyrat-Charvillon. Mutual Information Analysis: a Comprehensive Study.J. Cryptology, 24(2):269–291, 2011.
[4] L. Batina, J. Hogenboom, and J. G. J. van Woudenberg. Getting More from PCA: First Results of Using Principal Component Analysis for Extensive Power Analysis. In O. Dunkelman, editor,CT-RSA, volume 7178 ofLecture Notes in Computer Science, pages 383–397. Springer, 2012.
[5] E. Brier, C. Clavier, and F. Olivier. Correlation Power Analysis with a Leakage Model. In M. Joye and J.-J. Quisquater, editors,CHES, volume 3156 ofLecture Notes in Computer Science, pages 16–29. Springer, 2004.
[6] S. Chari, J. R. Rao, and P. Rohatgi. Template Attacks. In B. S. K. Jr., C¸ etin Kaya Koc¸, and C. Paar, editors,CHES, volume 2523 ofLecture Notes in Computer Science, pages 13–28. Springer, 2002.
[7] C. Clavier, J.-S. Coron, and N. Dabbous. Differential Power Analysis in the Presence of Hardware Countermeasures. In C¸ etin Kaya Koc¸ and C. Paar, editors, CHES, volume 1965 of Lecture Notes in Computer Science, pages 252–263. Springer, 2000.
[8] B. Gierlichs, L. Batina, P. Tuyls, and B. Preneel. Mutual Information Analysis. In E. Oswald and P. Rohatgi, editors,CHES, volume 5154 of
Lecture Notes in Computer Science, pages 426–442. Springer, 2008. [9] B. Gierlichs, K. Lemke-Rust, and C. Paar. Templates vs. Stochastic
Methods. In Goubin and Matsui [10], pages 15–29.
[10] L. Goubin and M. Matsui, editors. Cryptographic Hardware and Em-bedded Systems - CHES 2006, 8th International Workshop, Yokohama, Japan, October 10-13, 2006, Proceedings, volume 4249 ofLecture Notes in Computer Science. Springer, 2006.
[11] T. Katashita, A. Satoh, T. Sugawara, N. Homma, and T. Aoki. De-velopment of side-channel attack standard evaluation environment. In
Circuit Theory and Design, 2009. ECCTD 2009. European Conference on, pages 403–408, 2009.
[12] P. C. Kocher, J. Jaffe, and B. Jun. Differential Power Analysis. In M. J. Wiener, editor,CRYPTO, volume 1666 of Lecture Notes in Computer Science, pages 388–397. Springer, 1999.
[13] S. Mangard, E. Oswald, and T. Popp.Power analysis attacks - revealing the secrets of smart cards. Springer, 2007.
[14] T. S. Messerges. Using Second-Order Power Analysis to Attack DPA Resistant Software. In . K. Ko and C. Paar, editors,CHES, volume 1965 ofLecture Notes in Computer Science, pages 238–251. Springer, 2000. [15] T. S. Messerges, E. A. Dabbish, and R. H. Sloan. Investigations of power analysis attacks on smartcards. InProceedings of the USENIX Workshop on Smartcard Technology on USENIX Workshop on Smart-card Technology, WOST’99, pages 17–17, Berkeley, CA, USA, 1999. USENIX Association.
[16] W. Schindler, K. Lemke, and C. Paar. A Stochastic Model for Differential Side Channel Cryptanalysis. In J. R. Rao and B. Sunar, editors,CHES, volume 3659 ofLecture Notes in Computer Science, pages 30–46. Springer, 2005.
[17] Y. Souissi, M. Nassar, S. Guilley, J.-L. Danger, and F. Flament. First Principal Components Analysis: A New Side Channel Distinguisher. In K. H. Rhee and D. Nyang, editors,ICISC, volume 6829 ofLecture Notes in Computer Science, pages 407–419. Springer, 2010.
[18] F.-X. Standaert, T. Malkin, and M. Yung. A Unified Framework for the Analysis of Side-Channel Key Recovery Attacks. In A. Joux, editor,
EUROCRYPT, volume 5479 of Lecture Notes in Computer Science, pages 443–461. Springer, 2009.
[19] C. Whitnall and E. Oswald. A Comprehensive Evaluation of Mutual In-formation Analysis Using a Fair Evaluation Framework. In P. Rogaway, editor,CRYPTO, volume 6841 ofLecture Notes in Computer Science, pages 316–334. Springer, 2011.