© 2018, IRJET | Impact Factor value: 6.171 | ISO 9001:2008 Certified Journal | Page 181
Advanced method of Epileptic detection Using EEG by Wavelet
Decomposition
MANASA B K
1, AVINASH
L R
2, CHANDRASHEKAR
H N
31,2,3Assistant Professor, College of Agriculture, Hassan, Karnataka, India
---***---
Abstract
-
Detection of the epileptic seizures activity helps the epileptic people have a convenient life, hence identifying Inter-Ictal state is a major challenge. Discriminating between seizures caused by delirium, febrile seizures etc. would be a great help in treating the disorders. The study aims at developing a scheme to differentiate Normal, Inter-Ictal, Ictal or Epileptic EEG signals, using various features of EEG transformed into wavelet domain, with a good degree of accuracy.Present scheme for using kNN classifier to serve as decision support system to detect and predict the onset of epileptic seizures that was successfully carried out and tested with two benchmarked databases. Needless to say the focus needs to be on increasing the prediction accuracy, such that the epileptic foci may be localized and the seizure onset be predicted with time likelihood.Key words:Electroencephalogram (EEG), Ictal, Inter-Ictal , Features Extraction, Epileptic Seizure.
1.INTRODUCTION
Epilepsy is a neurological disorder typified by impaired brain activities resulting in recurrent, involuntary, seizure activity. Electroencephalogram (EEG) is a diagnostic tool for investigation of various brain states in neurological disorders. It is a graphical representation of the electrical activity in the brain through electrodes placed on the scalp or within the cranium. It is deemed to be safe and a painless procedure; however recording may necessitate activation procedures to induce abnormal EEG pattern and or seizures by way of photic or other stimulation or chemical stimulants. Adult human surface EEG signal varies from a few micro volts to milli volts in amplitude [1]. Each electrode is connected to a differential amplifier the other lead of which is connected to a reference. Montage refers to the representation of the EEG channels.
Seizure patterns vary from one subject to another, requiring trained professionals to separate pathological events from the normal EEG patterns. Convulsive seizures are the most common types of seizures while non-convulsive or absence seizures form a minority [2]. In the convulsive seizures, most begin as focal seizures and become generalized seizures. Interesting is the existence of an aura phase previous to the ictal state or the epileptic fit in most focal seizures. This phase is indicative of an imminent attack giving epileptic people a time window that may from a few seconds up to an hour. The study shall try to focus on identifying this state.
2. MATERIALS AND METHODS
2.1Trends identified in features used for classification
It has been found that for the task undertaken, most studies have adopted techniques that are either entropy estimator based nonlinear methods or such features fed to classifiers or have used spectral features fed to classifiers. The review studies documented by Sriram Ramgopalet al [3], Aarabiet al [4] and U Rajendra Acharya et al [5], do a detailed study on algorithms and techniques used so far for prediction of seizures. They detail the various trends in research methodologies in the field. It has been found that the features of the data selected are often based on
1. Statistical features
2. Transform domain Approach
3. Nonlinear methods 4. Power in frequency bands
2.1.1 Statistical features
© 2018, IRJET | Impact Factor value: 6.171 | ISO 9001:2008 Certified Journal | Page 182 Variance: EEG signal is segmented into rectangular sections and the variance calculated, the segment is considered as having a seizure if the variance is larger when compared with a constant threshold, else, is deemed normal.
Component analysis: Component analysis involves mapping the data to a feature set. Most commonly principal component, linear discriminant, and independent component analyses have been successfully used in epilepsy diagnosis.
Spectral Measures: The semi periodic behavior that is characterized by peaks in the power spectrum at certain frequencies can be used to identify seizures. Spectral analysis maybe carried out in two different ways. The Nonparametric method estimates autocorrelation from a given data set which when Fourier transformed yields the power spectrum. The Parametric approach models the system / process to estimate the power spectrum from which the necessary analysis of the EEG can be done [6].
2.1.2 Transform domain Approach
Transform domain approach by Fourier and Wavelet transforms both continuous and discrete have been seen in the literature to yield very good results. In [7], EEG is analyzed with different wavelet filters and classified using probabilistic Neural Networks and Gaussian mixture model and Support Vector Machine classifier with nonlinear features and statistical features as input to yield very good results in classification accuracy.
2.1.3 Nonlinear methods
Frequency domain methods can capture the quasi periodic oscillations and the frequency contents however they are unable to detect the relation between the phase locking and the nonlinear relations among the frequency contents in the band they occupy. Nonlinear analysis applied to semi periodic signals enables one to study the dynamics of the complex underlying behavior and quantify the degree of complexity of the time series. In studies documented by papers [7], [8] Higher Order Spectral (HOS) cumulants, and entropy estimators like Renyi, Approximate and Sample Entropy and Recurrence Quantification Analysis (RQA) etc are used however techniques as Fractal Dimension (FD), Correlation Dimension (CD), Largest Lyapunov Exponent (LLE), Hurst Exponent (HE) are also popular. Various entropy measures in the above mentioned studies clearly denote higher values for normal EEG as opposed to the lower values computed for the ictal EEG.
2.1.4 Power in frequency Bands
The key findings of studies in discrimination between subjects with Epilepsy and neuro typical subjects using coherence measures with respect to alpha, beta, theta and mu rhythms was found to be distinct [9],[10]. The ratios of the power in brain waves such as delta, alpha, beta, gamma, theta and mu are found to be sensitive to dysfunctions in neuronal regulation thereby characterizing epileptic brain or rather epileptic seizures much better. It may be noted that only some sub bands show marked changes and not all during ictus.
3. METHODOLOGY
The scheme for the study is as illustrated below, which has been greatly impressed by the study documented in [11].
© 2018, IRJET | Impact Factor value: 6.171 | ISO 9001:2008 Certified Journal | Page 183
4. EEG Samples
The four entropy estimators used in the study are explained briefly.
1. Shannon Entropy 2. Renyi Entropy 4. Approximate Entropy 5. Sample Entropy
4.1.1 Shannon Entropy
The Shannon entropy of a discrete random variable with probability distribution P is given as.
4.1.2 Renyi Entropy
Renyi Entropy comes under the family of entropies introduced by Alfred Renyi. Shannon entropy, Hartley entropy, Min-entropy and the collision Min-entropy can be generalized using this expression. The Renyi Min-entropy of order
[14] as:
Where is a discrete random variable is the Probability of the event . Higher values of
, give values that are largely determined by the events with highest probability of occurrence. Lower values of , approaching zero, give Renyi entropies which increasingly weigh all possible events more equally, regardless of their probabilities. The intermediate case gives Shannon entropy.
4.1.3 Approximate Entropy
The expression for approximate entropy [15] is given as:
where
=Tolerance window =Number of sampling points in the sequence =Run length.
4.1.5 Sample Entropy:
In practice, it has been found that approximate entropy is lower than expected for short records. The sequence length is largely determines the value of This drawback and some others are overcome in sample entropy. Sample entropy is defined as the negative natural logarithm of the conditional probability, that has two sequences for point and remain similar at the next point. Self-matches are excluded from probability calculations. is given by[14]
where
&
-© 2018, IRJET | Impact Factor value: 6.171 | ISO 9001:2008 Certified Journal | Page 184
5. Power Ratios
[image:4.595.87.509.161.301.2]The EEG signals are commonly decomposed into five EEG sub-bands: delta, theta, alpha, beta and gamma differentiated by their frequencies which range from low to high are tabulated in Table 2.1 given below.
Table 2.1 EEG Bands adapted from [1]
Band Frequency Description
Delta waves
Up to 4 Hz Related to deep sleep or with tasks requiring continuous attention
Theta Waves 4 to 8 Hz. Associated with repression of responses or actions
Alpha waves 8 to 13 Hz. Reflects movement with inhibitory activity. Indicates the relaxation level of the person.
Beta waves 13-30 Hz. Indicate ‘fast’ activity, active thinking, etc.
Gamma
waves mainly up to 45 Hz 30 Hz and above Short-term memory matching of somato sensory stimulations etc.
5.1 Classification
Classification assigns data for accurate prediction of labels into target categories and classes. The shortlisted classifier based on some design parameters used to decide the suitability of the system for clinical application and employed for testing with cross validation. In the proposed system, the selected features are used as inputs to K Nearest Neighbor (KNN) classifier, based on the selected feature vector; the signals are classified as normal or ictal or inter ictal. The kNN algorithm finds a group of objects in the training set that are closest to the test object and bases. The labels are assigned based on the predominance of a particular class in its neighborhood. This classifier was selected as comprehensive and simple working to reduce the training time and increases the classifier performance [15].
6. RESULTS AND DISCUSSION
This section discusses in detail how the study was carried out to yield the results and also goes on to substantiate the claims made by the results by appropriate analysis.
The entire section can be brought in to four divisions:
1. Generating the entropy features along with wavelet decomposition 2. Training of the processed features extracted from the data.
3. Validation (Testing and re-iteration of the training/ testing scheme) to standardize the results. 4. Analysis
6.1 Data set
The data used in any research is of prime importance, it needs to be artifact free and reliable preferably annotated by a doctor / specialist and devoid of personal information. Publicly available bench marked data is very much sought after as not only can one compare results got by applying different algorithms on the common platform of a common database used but also verify whether some algorithms are feasible.
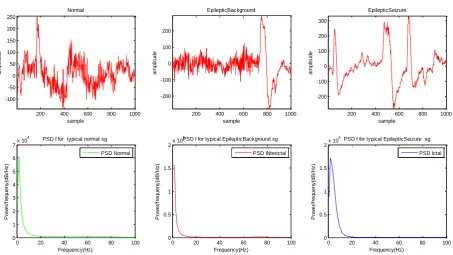
Typical ictal, inter ictal and normal data were first analyzed for their frequency spectra and scheme for wavelet decomposition. Typical time series and frequency spectrum plots of the three classes of data from the two databases are plotted in Figure 1.2 and Figure 1.3. The Power Spectral Density (PSD) was plotted using Burg’s method.
© 2018, IRJET | Impact Factor value: 6.171 | ISO 9001:2008 Certified Journal | Page 185
1000 2000 3000 4000
-50 0 50 100 EpilepticBackground sample a m p li tu d e
1000 2000 3000 4000
-1500 -1000 -500 0 500 1000 EpilepticSeizure sample a m p li tu d e
1000 2000 3000 4000
-150 -100 -50 0 50 100 150 200 Normal sample a m p li tu d e
0 20 40 60 80 100 120
0 0.5 1 1.5 2 2.5 3 3.5x 10
4
PSD f for typical EpilepticBackground sg
Frequency(Hz) P o w e r/ fr e q u e n y (d B /H z ) PSD INterictal
0 20 40 60 80 100 120
0 1 2 3 4 5 6x 10
5
PSD f for typical EpilepticSeizure sg
Frequency(Hz) P o w e r/ fr e q u e n y (d B /H z ) PSD Ictal
0 20 40 60 80 100 120
0 0.5 1 1.5
2x 10
4
PSD f for typical normal sg
[image:5.595.73.523.75.334.2]Frequency(Hz) P o w e r/ fr e q u e n y (d B /H z ) PSD Normal
Figure 1.2 PSD of typical Normal, Ictal, Inter-Ictal signals from Bonn University Data set
200 400 600 800 1000
-200 -100 0 100 200 EpilepticBackground sample a m p li tu d e
200 400 600 800 1000
-200 -100 0 100 200 300 EpilepticSeizure sample a m p li tu d e
200 400 600 800 1000
-100 -50 0 50 100 150 200 250 Normal sample a m p li tu d e
0 20 40 60 80 100
0 0.5 1 1.5
2x 10
5
PSD f for typical EpilepticBackground sg
Frequency(Hz) P o w e r/ fr e q u e n y (d B /H z ) PSD INterictal
0 20 40 60 80 100
0 0.5 1 1.5
2x 10
5PSD f for typical EpilepticSeizure sg
Frequency(Hz) P o w e r/ fr e q u e n y (d B /H z ) PSD Ictal
0 20 40 60 80 100
0 1 2 3 4 5 6 7x 10
4 PSD f for typical normal sg
[image:5.595.73.527.370.625.2]Frequency(Hz) P o w e r/ fr e q u e n y (d B /H z ) PSD Normal
Figure 1.3 PSD of typical Normal, Ictal, InterIctal signals taken from CHB-MIT Data set
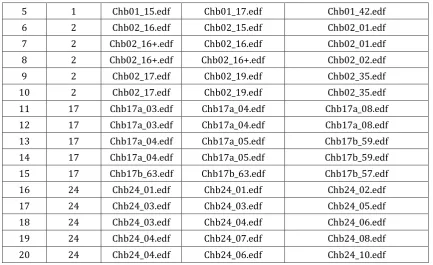
Table 2.2 Data set used for the proposed work
SL .NO SUBJECT SEIZURE FILE INTER-ICTAL FILE NORMAL RECORDING FILE
1 1 Chb01_03.edf Chb01_03.edf Chb01_01.edf
2 1 Chb01_04.edf Chb01_04.edf Chb01_06.edf
3 1 Chb01_04.edf Chb01_04.edf Chb01_06.edf
© 2018, IRJET | Impact Factor value: 6.171 | ISO 9001:2008 Certified Journal | Page 186
5 1 Chb01_15.edf Chb01_17.edf Chb01_42.edf
6 2 Chb02_16.edf Chb02_15.edf Chb02_01.edf
7 2 Chb02_16+.edf Chb02_16.edf Chb02_01.edf
8 2 Chb02_16+.edf Chb02_16+.edf Chb02_02.edf
9 2 Chb02_17.edf Chb02_19.edf Chb02_35.edf
10 2 Chb02_17.edf Chb02_19.edf Chb02_35.edf
11 17 Chb17a_03.edf Chb17a_04.edf Chb17a_08.edf
12 17 Chb17a_03.edf Chb17a_04.edf Chb17a_08.edf
13 17 Chb17a_04.edf Chb17a_05.edf Chb17b_59.edf
14 17 Chb17a_04.edf Chb17a_05.edf Chb17b_59.edf
15 17 Chb17b_63.edf Chb17b_63.edf Chb17b_57.edf
16 24 Chb24_01.edf Chb24_01.edf Chb24_02.edf
17 24 Chb24_03.edf Chb24_03.edf Chb24_05.edf
18 24 Chb24_03.edf Chb24_04.edf Chb24_06.edf
19 24 Chb24_04.edf Chb24_07.edf Chb24_08.edf
20 24 Chb24_04.edf Chb24_06.edf Chb24_10.edf
6.1 Feature extraction
From the data plotted above the entropy and the power ratio features need to be extracted.
The following routines for entropy estimators Shannon Entropy, Renyi Entropy, Approximate Entropy and Sample Entropy were executed on MATLAB®2007b, yielding 8 entropy features, calculation of which were based on values
[image:6.595.82.516.75.340.2]tabulated in Table 2.3 shown below.
Table 2.3 Typical values used for entropy Estimation
Shannon Entropy Renyi Entropy Approximate Entropy Sample Entropy
Tolerance Parameter r=0.2
Embedding Factor m=1,5,6 Tolerance Parameter r = 0.2
Embedding Factor m=1,5,6 Tolerance Parameter r = 0.2
As a norm, before proceeding with classification one needs to determine the statistical significance of the features by conducting a hypothesis test (to get a clear indication of the proximity of the distributions of the three classes). In [11], [14] and [15] as the same data set was used and ANOVA test was conducted yielding ‘ ’ value as zero. To enhance accuracy of statistical significance, assigned values to ‘ ’.
The wavelet families used for decomposition of the signals were as listed before yielding a total of 53 wavelets from the 7 families:
1. Haar Wavelet
2. Discrete approximation of Meyer wavelet: dmey
3. Biorthogonal wavelets (15): bior1.1, 1.3,1.5, 2.2,2.4, 2.6, 2.8, 3.1, 3.3, 3.5, 3.7, 3.9, 4.4, 5.5, 6.8 4. Reverse Biorthogonal (15): rbio1.1, 1.3,1.5, 2.2,2.4, 2.6, 2.8, 3.1, 3.3, 3.5, 3.7, 3.9, 4.4, 5.5, 6.8 5. Coiflet Wavelets (5): Coif 1, 2, 3, 4, 5.
6. Symlet Wavelets (7):Sym 2, 3, 4, 5, 6, 7, 8.
© 2018, IRJET | Impact Factor value: 6.171 | ISO 9001:2008 Certified Journal | Page 187
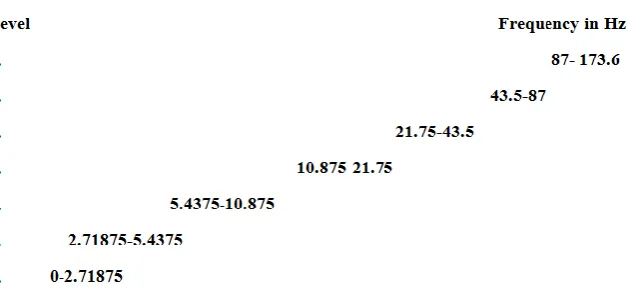
Figure 1.4 Illustration showing the frequency band break up of 7 level wavelet decomposition.
Thus the approximate coefficients in Levels 7, and detail coefficients in levels 6, 5, 4, 3 correspond to the frequency bands containing delta, theta, alpha, beta and gamma waves. Three power ratios taken were:
1. Power _Alpha / Power_ Gamma
2. Power _Theta/Power_Beta
3. (Power _Delta + Power _Theta +Power_Alpha) /( Power_Beta + Power_Gamma + 1Power_D1+ Power_D2 )
A total of eight features were taken from powers in the above mentioned 5 bands and their ratios.
6.2 Training, Testing and Cross validation
Cross-Validation is a means to evaluate / compare learning algorithms by segregating data into learning (training) segment to learn the model with the remainder used to validate the model. In -fold cross validation, the data is first partitioned into (equal or nearly equal sized) segments, in subsequent iterations of training and validation that are performed, with each iteration a different data / feature segment is held-out for validation while the remaining
folds are used for learning.
For signals, the number of data sequences each of 1000 sample length selected from 4 subjects (5 files each for the 3
classes) was 460 each from samples each for Normal,Inter-ictal and Ictal . For 3 fold cross validation the training set hence
constitutes of 322 sequences for each class and 138 sets for the testing. The signals from Bonn University were further windowed each segment of length 1000 samples was chosen. Thus the training set constituted of 700 and 300 testing sequences for each class. Segmenting the signal for 5 second duration, the samples were given to K-NN classifier.
The parameters such as Sensitivity, Specificity and Accuracy Positively Predicted Value provide means to assess the performance of the experimental setup, the parameters used may be interpreted as follows.
Table 2.4 Test Metrics and their meanings2
1Foot note:
Power in higher level frequencies (corresponding to detail coefficients in levels one and two respectively)
2True positives (TP) Seizures identified by the automated system and by the EEG experts.
False positives (FP): Total number of seizures identified by classifier but not experts.
False negatives (FN): Seizures missed by the automated system.
True Negatives (TN): Events identified as non-seizures by the experts classified as such by the system as well.
Measure Formula Description
Precision (TP)/(TP+FP) Percentage of correct positive predictions.
Recall/Sensitivity (TP)/(TP+FN) Percentage of positive labelled instances that
were predicted as positive.
Specificity (TN)/(TN+FP) Percentage of negative labelled instances that
were predicted as negative.
© 2018, IRJET | Impact Factor value: 6.171 | ISO 9001:2008 Certified Journal | Page 188
Selection of wavelets and the number of decomposition levels play an important role in the analysis of the signals. The number of decomposition levels chosen depends on the highest frequency component present in the signal. In the present work, the number of decomposition levels was chosen to be 6. Post classification of the best case results from the two different bench marked databases are tabulated in Table 2.5.
Table 2.5 Best Results obtained from the Data Base.
Data Base Used Wavelet Family Sensitivity
%
Specificity %
PPV
%
Accuracy
%
Bonn University Reverse Biorthogonal 3.1 98.33 66.15 79.42 100
CHB-MIT Reverse Biorthogonal 3.3 94.56 66.48 76.01 95.54
6.3 Analysis
Table 2.5 shows the two separate benchmark databases performing similarly to the process. It has been found that the results obtained fare reasonably well with that obtained from a few choice studies that adopted the same databases, as is evident in Table 2.6
Table 2.6 Performance comparison
Method(Feature-Classifier) Authors Data Base Accuracy
Nonlinear features of Biorthogonal 3.3 - kNN Ashwini V R Aparna P[11] Bonn 99.6
PCA of Nonlinear features of Biorthogonal 3.3 -
Knn Ashwini V R et al [14] Bonn 99.8
PNN,SVM,C4.5,KNN,GMM U Rajendra Acharya et al [7] Bonn 88.1–95.9
ANFIS S. A. Hosseini[18] Bonn 96.9
MME Ubeyli, E.D[16] Bonn 98.00
SVM Shoib [17] CHB-MIT 96
Statistical features (from frequency bands) Fergus et al [9] CHB-MIT 93.0
KNN Current study CHB-MIT
Bonn 95.5 100
Good results can be attributed to the use of wavelet decomposition and the sensitivity of the neural regulation mechanism as manifested in change in alpha and theta sub bands.
7. CONCLUSION AND FUTURE SCOPE
The analysis of EEG signal for the detection of brain abnormalities is a difficult process. Bonn University or CHB-MIT standardized protocol using kNN classifier as benchmarked databases to detect and predict the onset of epileptic seizures. Earlier studies used one of the benchmarked databases with kNN classifier with varied accuracy and precision. Present study was successfully carried out and tested a program for both of the benchmarked databases for kNN classifier with consistent accuracy and precision to serve as decision support system to detect and predict the onset of epileptic seizures accurately. The methods used have been compared with recently published papers as well.
Present work shows some promise as a useful tool in studying normal and epileptic subjects with due modifications making it feasible.
7.1 Scope for further enhancement
After diligent studies the authors propose following points for consideration in enhancing the scope of the project undertaken in order to improve on the results and its validity etc:
© 2018, IRJET | Impact Factor value: 6.171 | ISO 9001:2008 Certified Journal | Page 189
It is also seen that the system described is not patient specific - adult seizures are more stabilized and easier to detect unlike neonatal seizures which are difficult to characterize. A system that can be used for both adults and children alike can be more specific and robust as a decision support system in diagnostics.
The current literature allows no definite conclusion as to whether seizures are predictable by prospective algorithms. Hence, future studies need to rely on sound and strict methodology and include a rigorous statistical validation.
ACKNOWLEDGEMENTS
The authors acknowledge the Department of Electronics and Communication, Visvesvaraya Technological University, Canara Engineering College, Mangalore, Karnataka for providing scope for research in this particular topic. This work was initiated by Mrs. Manasa B K for fulfilment of Master’s dissertation. The authors also acknowledge Avinash L.R and Chandrashekar H.N (UAS, Bangalore) for his support in preparing paper and an anonymous reviewer for their useful and valuable comments which will improve the paper.
Further I declare that the work not carried out from any financial support or any expenditure from guide or others and not having any relation in respect of the work, but used the available facilities of my institution.
REFERENCES
[1] Misra M, Kalitha U, Clinical Encephalography, 1st edition, Elsivier India Publishers,2005 ISBN: 8131207439,
9788131207437.
[2] Wikipedia contributors, 'Epileptic seizure', Wikipedia, The Free Encyclopedia, 1 May 2015, 19:40UTC, from the URL: http://en.wikipedia.org/wiki/Epileptic_seizure.html, last accessed 17 May 2015, 20.30 IST
[3] Sriram R, Sigride T, Michele J, Navah E , Iván S, , Jacquelyn K, William B, Claus ,Steven S, Tobias L “Seizure Detection, Seizure Prediction, And Closed-Loop Warning Systems In Epilepsy”, Epilepsy & Behavior , Vol 37 , 291 – 307, 2014, Elsevier Inc.
[4] Aarabi, A.; Fazel-Rezai, R.; Aghakhani, Y., "EEG seizure prediction: Measures and challenges," in Engineering in Medicine and Biology Society, 2009. EMBC 2009. Annual International Conference of the IEEE , pp.1864-1867, 3-6 Sept. 2009, doi: 10.1109/IEMBS.2009.5332620
[5] U. RajendraAcharya, S. VinithaSree, G. Swapna, Roshan Joy Martis, Jasjit S. Suri, “Automated EEG analysis of epilepsy:
A review”, Knowledge-Based Systems, vol.45, pp147–165, 2013, Elsevier B V,
http://dx.doi.org/10.1016/j.knosys.2013.02.014
[6] Oliver Faust, U. Rajendra Acharya, Lim Choo Min and Bernhard H. C. Sputh, “Automatic Identification of Epileptic and Background EEG Signals Using Frequency Domain Parameters”, Int J Neural Syst.vol. 20(2), pp. 195-176, 2010, World Scientific Publishing DOI: 10.1142/S0129065710002334.
[7] U.Rajendra Acharya, S. VinithaSree, J.S. Suri, “Automatic detection of epileptic EEG signals using higher order cumulant features”, Int. J. Neural Syst. 21 (5), pp21–32, 2011.
[8] Kannathal N, Lim C.M, U. Rajendra Acharya, SadasivanP.K, “Entropies for detection of epilepsy in EEG ”, J.Computer Methods and Programs in Biomedicine, Dec. 2005, Vol. 80, Issue 3, pp. 187-19 4.
[9] Paul Fergus, David Hignett, AbirHussain, Dhiya Al-Jumeily, and Khaled Abdel-Aziz, “Automatic Epileptic Seizure Detection Using Scalp EEG and Advanced Artificial Intelligence Techniques,” BioMed Research International, vol. 2015, Article ID 986736, 17 pages, 2015. doi:10.1155/2015/986736
[10] Sherman, D., Zhang, N., Garg, S., Thakor, N. V., Mirski, M. A., White, M. A., andHinich, M. J“Detection Of Nonlinear Interactions Of EEG Alpha Waves In The Brain By A New Coherence Measure And Its Application To Epilepsy And Anti-Epileptic Drug Therapy ”, International Journal of Neural Systems, 21(2), 115–126. 2011.
© 2018, IRJET | Impact Factor value: 6.171 | ISO 9001:2008 Certified Journal | Page 190
[12] Goldberger AL, Amaral LAN, Glass L, Hausdorff JM, IvanovPCh, Mark RG, Mietus JE, Moody GB, Peng C-K, Stanley HE. PhysioBank, PhysioToolkit, and PhysioNet: Components of a New Research Resource for Complex Physiologic Signals. Circulation 101(23):e215-e220 [Circulation Electronic Pages; http://circ.ahajournals.org/cgi/content/full/101/23/e215]; 2000 (June).
[13] Andrzejak, R. G.,Lehnertz K, Rieke C, Mormann F, David P, Elger CE, “Indications of nonlinear deterministic and finite dimensional structures in time series of brain electrical activity: Dependence on recording region and brain state”,
Physical Review E, 64, 061907 2001.The repositories can be accessed via the URL: http://www.meb.uni-bonn.de/epileptologie/science/physik/eegdata.html
[14] Ashwini V R Holla, Mohan A R, AmrithaBaliga, Jyothika B, Divyashree M and AswathiSurendran, “Epilepsy Prediction Based On PCA of Non Linear Features of DWT of Epileptic EEG”, Proc. of Int. Conf. on Recent Trends in Signal Processing, Image Processing and VLSI, ICrtSIVDBIT, pp 389-395. Association of Computer Electronics and Electrical Engineers, 2014. DOI: 03.AETS.2014.5.371.
[15] Ashwini V R Holla, AkshathaKamath, SandeepPrabhu, “Epilepsy Prediction Using Entropies”, Special Issue of International Journal of Computer Applications vol 0975 – 8887, pp 33-37,IJCA Journal 2013.
[16] Ubeyli, E.D., “Modified Mixture of Experts for Analysis of EEG Signals,” Engineering in Medicine and Biology Society, EMBS 2007. 29th Annual International Conference of the IEEE , pp.1546-1549, 22-26 Aug. 2007.
[17] Ali Shoeb, “Application of Machine Learning to Epileptic Seizure Onset Detection and Treatment”, PhD Thesis, Massachusetts Institute of Technology, September 2009.
![Table 2.1 EEG Bands adapted from [1]](https://thumb-us.123doks.com/thumbv2/123dok_us/8143256.800099/4.595.87.509.161.301/table-eeg-bands-adapted.webp)