analysis of individual virions
Anush Arakelyan, … , Leonid Margolis, Jean-Charles Grivel
J Clin Invest.
2013;
123(9)
:3716-3727.
https://doi.org/10.1172/JCI67042
.
While flow cytometry has been used to analyze the antigenic composition of individual cells,
the antigenic makeup of viral particles is still characterized predominantly in bulk. Here, we
describe a technology, “flow virometry,” that can be used for antigen detection on individual
virions. The technology is based on binding magnetic nanoparticles to virions, staining the
virions with monoclonal antibodies, separating the formed complexes with magnetic
columns, and characterizing them with flow cytometers. We used this technology to study
the distribution of two antigens (HLA-DR and LFA-1) that HIV-1 acquires from infected cells
among individual HIV-1 virions. Flow virometry revealed that the antigenic makeup of
virions from a single preparation is heterogeneous. This heterogeneity could not be
detected with bulk analysis of viruses. Moreover, in two preparations of the same HIV-1
produced by different cells, the distribution of antigens among virions was different. In
contrast, HIV-1 of two different HIV-1 genotypes replicating in the same cells became
somewhat antigenically similar. This nanotechnology allows the study of virions in bodily
fluids without virus propagation and in principle is not restricted to the analysis of HIV, but
can be applied to the analysis of the individual surface antigenic makeup of any virus.
Technical Advance
AIDS/HIV
Find the latest version:
Nanoparticle-based flow virometry
for the analysis of individual virions
Anush Arakelyan, Wendy Fitzgerald, Leonid Margolis, and Jean-Charles Grivel
Program in Physical Biology, Eunice Kennedy-Shriver National Institute of Child Health and Human Development, NIH, Bethesda, Maryland, USA.
While flow cytometry has been used to analyze the antigenic composition of individual cells, the antigenic
makeup of viral particles is still characterized predominantly in bulk. Here, we describe a technology, “flow
virometry,” that can be used for antigen detection on individual virions. The technology is based on binding
magnetic nanoparticles to virions, staining the virions with monoclonal antibodies, separating the formed
complexes with magnetic columns, and characterizing them with flow cytometers. We used this technology
to study the distribution of two antigens (HLA-DR and LFA-1) that HIV-1 acquires from infected cells among
individual HIV-1 virions. Flow virometry revealed that the antigenic makeup of virions from a single
prepa-ration is heterogeneous. This heterogeneity could not be detected with bulk analysis of viruses. Moreover, in
two preparations of the same HIV-1 produced by different cells, the distribution of antigens among virions was
different. In contrast, HIV-1 of two different HIV-1 genotypes replicating in the same cells became somewhat
antigenically similar. This nanotechnology allows the study of virions in bodily fluids without virus
propaga-tion and in principle is not restricted to the analysis of HIV, but can be applied to the analysis of the individual
surface antigenic makeup of any virus.
Introduction
About 50 years ago, flow cytometry revolutionized biology and medicine in general, and immunology in particular, by making possible the distinction of individual cells by their antigenic spec-tra (1, 2). As a result of this technology, where once we saw only two types of lymphocytes, T and B, we can now recognize dozens of types and hundreds of their states, gaining unprecedented new insights into mechanisms of immunity, including responses to infection by viruses.
Unlike lymphocytes, viruses themselves are still characterized predominantly in bulk, despite the idea that viral particles are probably as individualized as lymphocytes.
Because of its high mutation rate, HIV-1 is one of the most diverse human viruses. Its diversity was recently emphasized by the discovery that only one or several among billions of HIV-1 par-ticles in the seminal fluid of an infected individual are sexually transmitted and start infection in the recipient (3), implying that this transmittable virus is somewhat different from other viral particles, particularly in the composition of its envelope. In order to target these particular viral particles with a new generation of antiviral drugs, one has to be able to characterize these particles individually. Moreover, it appears that the contribution of vari-ous infected cells to HIV-1 production depends on the stage of HIV disease and on the presence of opportunistic infection (4). The exact tracing of virions to the cells that have produced them also requires the analysis of individual viral particles. Currently, the envelope composition of viruses is studied by analyzing viral preparations in bulk, although attempts to visualize viruses using flow cytometers have been made (5–9).
The direct use of flow cytometers for viral analysis is hindered by physical limitations (10), since many viruses, especially small RNA viruses like HIV-1 with a diameter of 100 nm, are well outside the light-scattering detection range of commercial cytometers (8). To
overcome this limitation, viruses have been stained with fluores-cent nucleic dyes. However, again, small RNA viruses such as HIV could not be detected with this approach, owing to their small genome size (9). Flow cytometry has also been used to quantify viral particles attached to microbeads, which provide light-scatter-ing signal, while viruses were revealed by specific antiviral fluores-cent antibodies (11–13). In these assays, multiple viruses attach to one bead, thus such techniques constitute another bulk analysis of viruses. No technology is currently available that is capable of char-acterizing the antigenic composition of individual viral particles.
Here, we report on such a technology, “flow virometry,” which allows the detection and characterization of antigens on individ-ual virions using multicolor flow analysis. This new method is a technical advance that will help address the question of viral infec-tivity and transmissibility at the level of a single viral particle.
Results
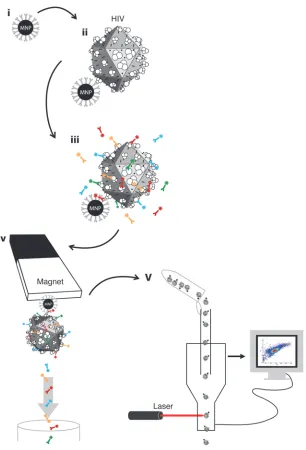
Detection of antigens on individual viral particles: the strategy. The tech-nology we developed is based on (a) attaching virions to magnetic nanoparticles (MNPs); (b) staining virions immobilized on MNPs with fluorescent antibodies against antigens of interest; (c) sepa-rating the resultant complexes from free fluorescent antibodies; and (d) detecting antigens on individual viral particles with regu-lar flow cytometers, in which the triggering event is fluorescence rather than light scattering (Figure 1).
We tested this technology by analyzing the distribution of cellu-lar proteins that previous bulk analyses have shown to be incorpo-rated into HIV-1 virions upon their budding from infected cells. We found that different sets of cellular antigens are distributed differently among individual virions released by infected cells.
Binding virions to nanoparticles and revealing them by their antigens. We used 15-nm MNPs formed from iron oxide cores derivatized with carboxyl groups. These particles were coupled to capture antibod-ies against HIV-1 gp120, either 2G12 (14) or VRC01 (Figure 1, i, and ref. 15). These antibody-coupled MNPs were incubated with HIV-1 suspension (Figure 1, ii), and captured virions were further
Conflict of interest: The authors have declared that no conflict of interest exists.
(Figure 1, iv). Then, we eluted the antibody-labeled HIV-1-MNP complexes from the column outside the magnetic field and sub-jected them to analysis with a flow cytometer (Figure 1, v).
Flow analysis of virions. We set up the flow cytometer to be trig-gered by the fluorescent label of the MNP and tested different flow rates to acquire samples. We chose a flow rate below 150 events per second, which, on the basis of earlier reports (19), we expected (and proved below) to resolve individual particles. We used a gate of fluorescence width versus height to exclude aggregates (Figure 2A). Next, we excluded microvesicles bound to MNPs based on their expression of CD45, which is excluded from viral particles (18) (Fig-ure 2B). We visualized HIV-1-MNP complexes with an Alexa Fluor 647–labeled antibody against gp120, which was different from the antibody through which the virions had been captured (Figure 2C). On average, 90.6% ± 6.3% (n = 7) of the events were positive for fluo-rescent anti-gp120 antibodies and negative for CD45.
To verify that the events we registered with the flow cytometer were indeed viral particles and that these events predominantly studied for the presence of specific antigens. In addition, to
visu-alize MNP–capture antibody complexes, we used fluorescent Fab fragments (Alexa Fluor 488) of goat anti-human IgG antibodies.
[image:3.585.52.358.79.529.2]We analyzed the presence on the viruses of two cellular antigens, HLA-DR and LFA-1. These antigens were chosen because bulk analysis of HIV-1 preparations has revealed that they are associated with HIV-1 (16, 17). To distinguish virions from microvesicles that have originated from infected cells and therefore may carry viral antigens, we used CD45, which is excluded from virions (18). We incubated HIV-1-MNP complexes with fluorescence-labeled anti-bodies against the above-mentioned antigens (Figure 1, iii) and isolated the resultant complexes. We used magnetic columns for the removal of unbound fluorescent antibodies from those bound to the HIV-1-MNP complexes, which is critical for flow analysis, as these antibodies cannot be distinguished from each other on the basis of their fluorescence. After the antibody-labeled HIV-1-MNP complexes were immobilized on the column in a magnetic field, we washed the column to remove unbound fluorescent antibodies
Figure 1
bodies was specific and revealed bound virions: (a) flow analysis showed that in a control prep-aration from which virus was omitted, only 0.9% ± 0.3% (n = 9) of the MNPs were positive for gp120 (Figure 2D); (b) when the entire procedure was performed with the ΔENV-GFP-HIV-1 vari-ant, only 1.2% ± 0.3% (n = 4) of the MNPs were positive for GFP (Fig-ure 2E); (c) isotype control stain-ing of HIV-1-MNP complexes with purified Alexa Fluor 647– labeled human IgG1 and eFluor 450–labeled IgG1 κ resulted on average in the positivity of only 0.28% ± 0.06% and 0.05% ± 0.005% (n = 3) of events, respectively, con-firming the specificity of staining for gp120 (Figure 2F) and CD45 (Figure 2G); (d) when instead of HIV-1, we used a preparation of microvesicles produced by uninfected cells, on average only 2.05% ± 0.28% (n = 2) of events negative for CD45 were positive for staining with 2G12, again con-firming the specificity of viral cap-ture and detection (Figure 2H). Together, these data confirm that about 90% of the events detected by flow analysis represent cap-tured virions. To focus on HIV-1 virions, we continued to use stain-ing for CD45 in our gatstain-ing strat-egy to exclude microvesicles.
Second, we evaluated the frac-tion of virions captured by anti-gp120-MNP complexes by com-paring the amount of HIV in the MNP’s captured-fraction with the amount of HIV in the sample prior to capture. Based on RNA quantification, in these two frac-tions, on average, 18.1% ± 2.7% (n = 4) of virions were bound to the VRC01-MNP complexes and were eluted from the column after magnetic separation. We con-firmed these results by using GFP-expressing HIV-1 virions, which can be directly visualized by flow cytometry. In this experiment, for the accuracy of viral enumer-ation, we added AccuCheck beads to measure the volume of the sample acquired in flow analysis to calculate the concentration of viruses in the samples. The amount of viruses captured by MNPs, as evaluated by GFP measurement, constituted 18.3% of the viruses in the sample before purification. corresponded to single viral particles, we performed a series of
control experiments:
First, we performed four different sets of experiments to confirm that the staining of HIV-1-MNP complexes with gp120
anti-Figure 2
Detection of HIV-1 virions immobilized on MNPs. (A) Gating strategy for flow analysis of MNP complexes: A singlet gate was defined by plotting fluorescence height versus fluorescence width. The gate excludes events with a high width and high height that represent aggregated particles (for more details on gat-ing, see Supplemental Figure 1. Supplemental material available online with this article; doi: 10.1172/ JCI67042). (B and C) 2G12-coupled MNPs labeled with Alexa Fluor 488 were incubated with HIV-1SF162
and stained with Alexa Fluor 647–labeled anti-gp120 antibody VRC01, and eFluor 450–labeled anti-CD45 antibody. CD45-positive events (B) are excluded from analysis, while gated CD45-negative MNP events positive for VRC01 (C) represent HIV-1 bound to the MNPs. (D) 2G12-coupled MNPs labeled with Alexa Fluor 488 were incubated with virus-free culture medium and stained with Alexa Fluor 647–labeled anti-gp120 antibody VRC01. Note the very low nonspecific binding of anti-anti-gp120 antibodies to MNPs. (E) 2G12-coupled MNPs labeled with Alexa Fluor 350 were incubated with Δ-ENV-GFP HIV-1. Note the low binding of Δ-ENV-GFP HIV-1 to MNPs. (F–H) 2G12-coupled MNPs labeled with Alexa Fluor 488 were incubated with HIV-1SF162 and stained with Alexa Fluor 647–labeled human IgG1 (Hu IgG1) (F) or eFluor
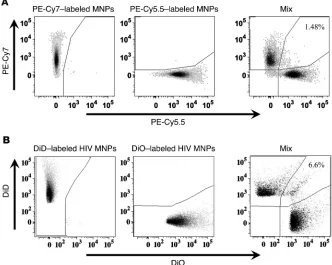
[image:4.585.42.407.82.470.2]in the course of their binding to MNPs (e.g., by being cross-linked through MNPs or antibodies), again resulting in one event rep-resenting many virions. To prove that this was not the case and to estimate swarm detection, we first tested the acquisition coin-cidence for MNPs themselves. We prepared MNP-antibody com-plexes labeled with either PE-Cy5.5 or PE-Cy7. When the mixture of these two complexes was subjected to flow analysis, less than 1.5% of events were double positive for both fluorochromes (Figure 3A). To evaluate which fraction of the events corresponds to single virions, we divided a preparation of HIV-1 into two parts: one was stained with the lipophilic fluorescent green dye DiO and the other with the lipophilic red dye DiD. Then, we mixed these two preparations and bound the virions to MNPs through their anti–gp120 capture antibodies. If the binding of MNPs to viruses resulted in their cross-linking and therefore in the formation of aggregates, then these complexes could be seen as events positive for both fluorochromes. Flow analysis showed that, on average, 5.04% ± 1.21% (n = 4) of events were double positive (Figure 3B). These results were confirmed by staining one part of the viral prep-aration with Pacific Orange and the other with Alexa Fluor 350. Flow analysis of the captured viral mixture showed that about 4% of MNPs were double positive. Thus, in our analysis, about 90% of events represent individual HIV-1 virions.
Distribution of cellular antigens on HIV-1 virions. Earlier, it was shown by bulk analysis of HIV-1 preparations that virions contain select cellular antigens acquired by the virus in the process of budding from the cell surface (21). Among the most common are LFA-1 and HLA-DR. We tested whether our technique reveals these particular antigens on virions by staining HIV-1-MNP complexes with anti– LFA-1 and anti–HLA-DR antibodies. The specificity of the staining was verified by incubating HIV-1-MNP complexes with isotype con-trols. We found that staining with a PE-Cy7–labeled mouse IgG1 κ and PE-Cy5.5–labeled IgG2a κ, and isotype controls for LFA-1 and To evaluate the percentage of virions that were recognized by
VRC01 but not retained by the magnetic columns, we collected the flow-through fraction of virions and captured it once again with VRC01-MNP complexes followed by magnetic purification and flow analysis. We found that 3% of virions not captured in the first run were bound to VRC01-MNPs.
Thus, MNPs complexed with VRC01, an antibody recognizing trimeric gp120, are able to capture 97% of virions that carry the cog-nate antigen containing the epitope recognized by this capture anti-body. To characterize further virions that were not recognized by the VRC01-MNPs and thus not retained by the magnetic column, we recaptured them with the 2G12-MNPs and subjected them again to magnetic column separation. On average, 42% ± 14% (n = 3) of those virions were recaptured. Thus, the virions in the stock that were not recognized by the VRC01-MNPs were either defective and did not express gp120, or expressed gp120 in a conformation that was not recognized by this broadly neutralizing antibody.
Third, we evaluated the infectivity of the viral preparation that was not captured by the VRC01-MNP complexes. Toward this goal, we estimated the TCID50 of this viral suspensionusing
TZM-bl cells. For HIV-1SF162 and HIV-1LAI.04, the infectivities of the
applied suspensions were 7 × 10⁴ and 1.5 × 10⁵, respectively, while
the respective infectivities of the noncaptured viruses were 8 × 10³
and 1.4 × 10⁴. Thus, the viruses that were not captured by MNPs
were approximately 36 times less infectious than the input virus. (Control experiments showed that incubation with noncapturing MNPs and passage through the magnetic column did not change viral infectivity. Data not shown.)
[image:5.585.42.374.88.353.2]Finally, we investigated whether the events representing HIV-1 bound to anti-gp120 MNPs represent single virions. This was not evident a priori; indeed, two or more MNPs can cross the laser beam simultaneously and be acquired as one event, a phenomenon referred to as “swarm detection” (20). Also, viruses could aggregate
Figure 3
Single particle detection. (A) Two prepa-rations of labeled MNPs, one complexed with PE-Cy7–labeled antibody (left panel) and the other with a PE-Cy5.5–labeled antibody (center panel) were mixed (right panel). Of the events recorded, approxi-mately 1.5% appeared to be double positive (right panel). Thus, approximately 98.5% of events represent single MNPs. Results represent one of four experiments. (B) A preparation of HIV-1SF162 was divided into
To prove that it is not because MNPs block access of the antibod-ies to HLA-DR and LFA-1 that the latter virions appear negative for these antigens, we first evaluated the amount of MNPs bound to the virions of each phenotype. In contrast to what would be expected if the MNPs blocked access of anti–LFA-1 or anti–HLA-DR to their respective antigens, the MFI of specific MNPs on virions positive for HLA-DR, LFA-1, or for both cellular antigens was not lower than the MFI of MNPs on virions that were double negative for both markers and actually was, on average, 7.0 ± 1.4 times higher (n = 12, P = 0.001). Second, to confirm that MNPs do not block access of anti–HLA-DR and anti–LFA-1 antibodies, we first incubated the viral suspension with these antibodies and then with capture VRC01-MNPs. This reversion did not significantly change (P > 0.1) the distribution of the virions according to the two cellular antigens LFA-1 and HLA-DR, which were present on 14.8% ± 0.6% (n = 7) and 13.2% ± 0.9% (n = 7) of virions, respectively (Figure 4, D and E), whereas 8.7% ± 0.4% of virions were double positive. Thus, MNPs do not block binding of HLA-DR and LFA-1 antibodies to viral surfaces, and the HIV-1 virions of the same preparation are indeed antigenically heterogeneous.
Next, we compared the distributions of LFA-1 and HLA-DR among HIV-1LAI.04 and HIV-1SF162 virions produced in PBMCs,
pre-sented above, with those among the same viruses produced in Jurkat cells. The two cellular antigens were present on 1.6% ± 1.4% (n = 3) HLA-DR, respectively, resulted on average in 0.17% ± 0.04% and
0.87% ± 0.02% (n = 3) positive events (Figure 4A). In addition, we confirmed the specificity of staining by performing the entire stain-ing procedure in the absence of HIV-1 virions (Figure 4A).
Unlike techniques reported earlier, flow virometry allows not only the demonstration of the presence of these antigens on viruses but, importantly, the analysis of the distribution of anti-gens among individual viral particles. Here, we evaluated the dis-tribution of HLA-DR and LFA-1 on two HIV-1 variants replicated in two different cell preparations.
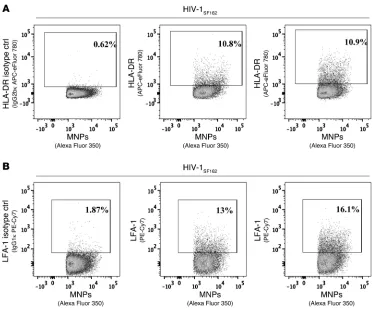
We analyzed the presence of LFA-1 and HLA-DR on individual virions of HIV-1LAI.04 and HIV-1SF162 produced in PBMCs. HIV-1
was bound to MNPs via VRC01 capture antibody against gp120. As described above, we confirmed viral binding by labeling these complexes with another gp120 antibody, 2G12. Cellular anti-gens were detected on MNP-immobilized virions, with antibodies against LFA-1 and HLA-DR labeled with different fluorochromes. Flow virometry showed that LFA-1 and HLA-DR were present, on average, on 16.7% ± 2.0% (n = 6) and 8.6% ± 0.3% (n = 3) of HIV-1LAI.04
virions, respectively, while 4.8% ± 0.6% (n = 3) of all virions carried both antigens (Figure 4B). Flow virometry of HIV-1SF162 produced
[image:6.585.41.379.82.452.2]in PBMCs revealed the presence of these antigens on 20.0% ± 4.4% (n = 6) and 10.8% ± 1.3% (n = 6) of virions, respectively, whereas 6.55% ± 0.4% of virions were double positive (Figure 4C).
Figure 4
Distribution of cellular antigens on HIV-1 virions. HIV-1LAI.04 and HIV-1SF162 produced
by PBMCs was captured by 2G12-MNPs and visualized with labeled VRC01. (A–C) Following capture, the two cellular antigens were revealed on HIV virions with labeled monoclonal antibodies against LFA-1 and HLA-DR. (A) 2G12-MNPs were incubated with virus-free culture medium and stained with anti–LFA-1–specific antibodies (left panel), anti–HLA-DR–specific antibodies (center panel), or costained for LFA-1 and HLA-DR (right panel). Plots show the posi-tions of the gates used in the gating strategy shown in Figure 2A. Note the low nonspe-cific binding of antibodies to 2G12-MNPs. (B and C) Staining of HIV-1LAI.04-2G12-MNP
complexes (B) and HIV-1SF162-2G12-MNP
makeup of two different HIV-1 preparations produced in the same cells became somewhat similar.
Flow analysis of virions in bod-ily fluids. We evaluated whether flow analysis of HIV-1 virions can be directly performed in the context of bodily fluids. Toward this goal, we first reproduced the capture protocol devel-oped for PBS-suspended virus, except that virus (HIV-1NL4.3)
was suspended in normal blood plasma. HIV-1 virions bound to VRC01-MNPs were revealed by flow virometry with labeled 2G12 antibodies. After capture of virus with VRC01-MNPs and separation on a magnetic col-umn, on average, 87.7% ± 2.6% (n = 4) of VRC01-MNPs were labeled with gp120 anti-bodies, similar to what is observed in virus suspended in PBS. Also, similarly to virus suspended in PBS, 17.8% of virions suspended in plasma were captured by VRC01-MNPs and retained by the column as evaluated by enumerating GFP-HIV-1 virions.
Similarly, we were able to visualize virions in cervico-vaginal lavage (CVL) spiked with HIV-1NL4.3. In this case,
on average, 58.8% ± 3.8% (n = 3) of VRC01-MNPs were labeled with anti–gp120 2G12 anti-bodies. In these experiments, the capture efficiency was 18.2% ± 5.8% (n = 3).
However, in patients’ plasma, the amount of virus was much lower than in the above-described model experiments (1.1 × 10⁴
to 1.6 × 10⁵ copies per milliliter, an order of magnitude lower
than that in our model experiments). Therefore, we modified our protocol to first concentrate virus using an additional magnetic concentration step. Specifically, we used 4 ml of plasma (rather than the 60 μl used in the case of viral stock) and first concen-trated plasma virions by capturing them on the VRC01-MNP complexes followed by separation on magnetic columns. The retained virus-MNP complexes were eluted, stained with the 2G12 detection antibody, and again separated on a magnetic column as described in Methods. This protocol was first used in a simulated experiment when normal plasma was spiked with HIV-1SF162 at a
concentration similar to that of the virus in patients’ plasma. In this case, the amount of beads in the final preparation was sever-al-fold larger, and thus the fraction of beads that carried virions was lower than that in our initial protocol. Nevertheless, we could reliably visualize viral particles captured by VRC01-MNPs and detected by 2G12, and as was the case in the control experiments and 1.6% ± 0.7% (n = 4) of HIV-1LAI .04 virions and on 7.2% ± 2.5%
(n = 3) and 5.6% ± 2.7% of (n = 4) of HIV-1SF162 virions produced
in Jurkat cells, respectively (Figure 5). The low expression of both antigens on Jurkat cell–produced viruses, which prevented us from reliably evaluating the fraction of virions coexpressing both anti-gens, reflects the low expression of these antigens by Jurkat cells themselves (data not shown). Thus, for the same HIV-1LAI.04 variant,
which was produced in two different cells, the antigenic makeup of the virions becomes different, at least for HLA-DR (P < 0.01) and LFA-1 (P < 0.02). A similar tendency was observed with HIV-1SF162,
but in this case it did not reach statistical significance.
Finally, the data presented above allowed us to compare the dis-tributions of LFA-1 and HLA-DR in two different HIV-1 prepara-tions, HIV-1SF162 and HIV-1LAI.04, produced in the same cells, either
PBMCs or Jurkat cells. These data (Figure 6) show that, although the fractions of LFA-1– and HLA-DR–containing HIV-1SF162 and
HIV-1LAI.04 virions produced in PBMCs are different, the ratios of
these fractions are similar (P > 0.21). The same is true for HIV-1SF162
and HIV-1LAI.04 virions produced in Jurkat cells (P > 0.21). Thus,
[image:7.585.42.420.81.391.2]at least for the two cellular antigens evaluated here, the antigenic
Figure 5
MNP binding and accessibility of cellular antigens on virions. HIV-1SF162 was produced by PBMCs,
cap-tured on MNPs via anti-gp120 antibody VRC01, visualized with labeled 2G12 antibodies, and stained for two cellular antigens with anti–HLA-DR and anti–LFA-1 antibodies. Alternatively, the same preparation of HIV-1SF162 virions was first incubated with anti–LFA-1 and anti–HLA-DR antibodies and then captured on
gens on viral particles (35), but few virions can be analyzed with this laborious technique.
Flow virometry, described here, allows for easy identification and analysis of multiple antigens on a virtually unlimited number of individual viruses. Briefly, the technique we developed consists of four major steps: (a) Immobilization of virions onto 15-nm MNPs coupled with capture antiviral antibodies. In this work, we used antibodies against gp120, a ubiquitous HIV-1 protein (36). (b) Labeling of nanoparticle-immobilized HIV-1 with a set of fluorescence-labeled monoclonal antibodies that reveal antigens on the virions. In this work, we focused on two cellular antigens that the virus acquires from the infected cells, however, our tech-nology can be used to analyze any viral surface antigen, provided that a specific fluorescent probe is available. (c) Separation of the nanoparticle-immobilized virus from unbound antibodies. Mag-netic properties of the nanoparticles allow the separation of the immobilized virus on magnetic columns. (d) Nanoparticle-immo-bilized viruses retained on the magnetic column and then eluted are subjected to flow analysis using a conventional flow cytome-ter with a modified setting. Routinely, in flow cytomecytome-ters, a cell that passes through the laser beam and scatters light constitutes an event that triggers the recording of the fluorescent spectra emitted by cell-bound fluorescent antibodies. In flow virome-try, nanoparticles themselves are labeled with a fluorescent Fab against the Fc portion of the capture antibody that is coupled to them. In this way, nanoparticle-immobilized viruses trigger the flow cytometer with their fluorescence, as they are too small to generate a light-scatter event. Indeed, fluorescence detection of submicroscopic particles is less susceptible to artifacts than light scattering (37), which is often the result of swarm detection (20). The lack of detection of double-positive events in experiments, in which beads or viruses individually stained with either of two fluorochromes are mixed, argues against swarm detection under our experimental conditions.
To confirm that the protocol described above results in HIV-1 virion immobilization on nanoparticles, we analyzed the nanopar-ticles for the presence of an HIV-1 hallmark molecule, gp120. We used an anti-gp120 antibody that recognizes an epitope different from the one recognized by the capture antibody. In the present work, we alternatively used two anti-gp120 antibodies, VRC01 and 2G12, one for capture and the other for detection. Without HIV-1, almost no nanoparticles were positive for gp120. Also, by staining with isotype control antibodies and using a preparation of microvesicles instead of virions, we were able to demonstrate the specificity of viral identification. These experiments show that not only unbound fluorochrome-labeled antibodies, but also free flu-orochromes, which contaminate most labeled antibody reagents, are removed prior to flow acquisition. Moreover, these contam-inants cannot compromise our technique, since HIV virions are recognized by colocalization of fluorescent antibodies against the capture anti-gp120 antibody of the MNP complexes and antibod-ies targeting gp120 on the virions, and by the fluorescence from antibodies targeting viral antigens of interest. Also, viruses puri-fied on MNPs were not markedly contaminated by microvesicles, as about 99% the viral particles we captured did not carry CD45, an antigen that distinguishes them from cellular microvesicles (18), while microvesicles expressing CD45 were readily identified in the same viral preparation. In our gating strategy, we excluded CD45-positive microvesicles, and the remaining 1% may represent microvesicles that carry gp120.
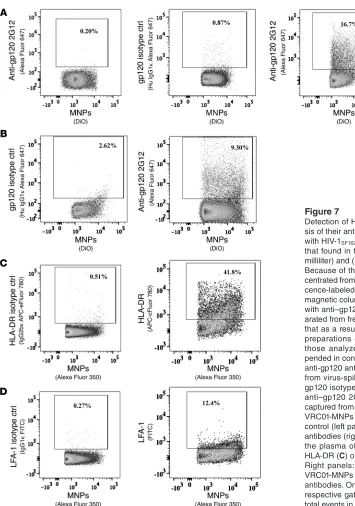
with virus-free plasma or with the isotype antibodies, the number of positive events was below 0.9% (Figure 7A).
Finally, we applied flow virometry to blood plasma that was derived from HIV-infected individuals (Figure 7B). The recovery of plasma virions by VRC01-MNPs, as evaluated by RNA concen-tration using RT-PCR, was again about 16% and was not signifi-cantly different from the recovery measured in the above-described experiments with laboratory-produced viruses suspended either in PBS or in normal blood plasma or CVL.
Finally, as a proof of concept, we verified that it was possible to perform the analysis of the distribution of the two cellular anti-gens LFA-1 and HLA-DR on patient-derived viruses (Figure 7, C and D). In a plasma sample from an HIV-1–infected individual, 12.4% of captured virions carried LFA-1, 41.8% carried HLA-DR, and 9.5% carried both antigens.
Thus, flow virometry can be applied to characterize the antigenic makeup of HIV-1 in bodily fluids.
Discussion
In this work, we describe a new technology, flow virometry, which we believe allows for the first time the evaluation of the antigenic variability of individual viral particles.
HIV-1 antigenic variability stems not only from the high muta-genicity of its genome, but also from the virus’ ability to include various cellular molecules that may significantly alter viral prop-erties. Up to now, the presence of these proteins has been studied in viral preparations either with ELISA or with flow cytometry of multiple viruses bound to microbeads (9, 12, 22–27). These studies analyzed viral particles in bulk. Individual viral particles labeled with fluorescent dyes have been observed in microscopic imaging studies (28) that addressed HIV-1 assembly (29–31) and infection (32, 33), particularly in transmission to the female lower genital tract (34), however, they did not characterize these particles genically. Immunoelectron microscopy has identified several
anti-Figure 6
Distribution of cellular antigens on HIV-1LAI.04 and HIV-1SF162 produced
in two different cell types. HIV-1LAI.04 and HIV-1SF162 were produced
[image:8.585.73.261.86.239.2]tion. These experiments showed that only 3% of the virions not bound by VRC01-MNPs, and thus not retained by the magnetic column in the first run, were recaptured. However, about 40% of these virions, which are not recognized by the VRC01-MNPs, can be captured with 2G12-MNPs.
Thus, our technique analyzes about 95% of virions that carry gp120 trimers recognizable by the capture VRC01 coupled to the MNPs. Moreover, those virions that are not captured by the VRC01-MNPs seem not only to be antigenically different, but are also 36-fold less infectious, which may in part be due to the improper conformation of their ENV, which render it incapable of being recognized by VRC01. The lower infectivity of the virions The entire identification of HIV-1 virions is based on their
recognition by MNPs that carry capture (anti-gp120) antibod-ies. No MNP-bound virions were revealed when ΔENV viral preparations were subjected to flow virometry. However, not all HIV-1 virions with ENV were bound to MNPs via anti-gp120 and thus retained by magnetic columns. It seems that VRC01-MNPs capture about 20% of virions in the viral stock. To check whether the remaining 80% of virions are just “lost” due to the inefficiency of our technique or whether they are not recognized by VRC01, we collected virions that were not retained by the magnetic column and subjected them once again to the entire procedure of recapture by VRC01-MNPs and magnetic
separa-Figure 7
Detection of HIV-1 virions in blood plasma and analy-sis of their antigenic makeup. Normal blood plasma (A) with HIV-1SF162 suspended at a concentration similar to
that found in the infected donors (104–105 copies per
[image:9.585.44.399.77.583.2]Thus, flow virometry can be applied both as a tool for analysis of individual viruses in the laboratory setting and in the clinical set-ting for analysis of samples obtained directly from HIV-1–infected patients. Direct analysis of patients’ viruses seems to be more effec-tive than some of the commonly used techniques that first require the propagation of patients’ isolates in cell culture, which may change the properties of these isolates.
Although all the viruses carry gp120 on their surface, they are heterogeneous in terms of the cellular antigens they carry. Already, the results of the first experiments with our new technol-ogy demonstrate its advantage over existing technologies. Indeed, two cellular antigens that were earlier reported to be associated with HIV-1 preparations (16, 17, 40) (and which because of this were chosen for the current analysis), HLA-DR and LFA-1, were not present on individual virions and were not equally distributed among them. Some viral particles carry one of these two antigens, while others carry both. This diversity is not explained by steric hindrance caused by bound MNPs, as staining virions for these antigens followed by MNP capture did not change the distribu-tion of these antigen-carrying virions. Also, the amount of bound MNPs on virions that were double negative for these cellular anti-gens was even smaller than the amount of MNPs bound on virions that were positive for these antigens. The latter may be explained by colocalization of ENV and cellular antigens on the viral surface. In these experiments, we used viral suspension from which free gp120 had been removed by centrifugation (see Methods). Oth-erwise, some of the LFA-1/HLA-DR double-negative events could be attributed to free gp120 molecules captured by anti-gp120 MNPs and detected by another anti-gp120 antibody. In the case of patient-derived plasma, gp120 was not removed, but the major-ity of events were HLA-DR positive and thus could not represent binding of free gp120 molecules.
In our experiments, the antigenic makeup is determined both by the HIV-1 genotype and by the cells from which the virus orig-inates, and the latter determinant seems to predominate. In the case of PBMCs, the presence of the small number of monocytes/ macrophages may affect the distribution of virions according to the cellular proteins. Different virions of a single HIV-1 variant originating from cells of two different types have different spec-tra of two cellular antigens, whereas two genotypically different viruses (one using CCR5 and another CXCR4 as a coreceptor) but originating from the same cells become similar in their cellular antigenic composition. While it is in agreement with the earlier reported bulk analysis of viral preparations that revealed these antigens (4, 21–24, 41, 42), flow virometry allows the comparison of the distributions of particular antigens on virions produced by different cells. Further studies using flow virometry will show the biological role of cellular antigens presented on HIV-1 viri-ons. Moreover, the analysis of HIV-1 produced by lymphoid tissue ex vivo revealed that the distribution of HLA-DR on virions changes in the course of infection (data not shown), probably reflecting the HIV-1–triggered upregulation of this activation marker on infected and bystander T cells (43).
Although the technique we developed has the advantage of addressing the characteristics of individual virions one at a time, it has its own limitations.
Here, in our experiments, of five colors used, only three were dedicated to analyzing cellular antigens carried by HIV-1 viri-ons. With contemporary flow cytometers, up to eighteen colors can potentially be used to identify antigens on viruses in a single that are not recognized by VRC01-MNPs is in general agreement
with the ability of VRC01 to broadly neutralize HIV.
In summary, our technique efficiently analyzes virions that are recognized by particular anti-gp120 antibodies. Using different anti-gp120 antibodies, it would be possible to probe the ENV con-formation on individual viral particles. In general, these data are in agreement with a bulk analysis of anti-gp120 antibodies bind-ing to HIV-1 that showed that VRC01 antibodies recognize about 20% of virions (R.J. Shattock, personal communication). The dif-ferential virion capture by MNPs bound to particular anti-ENV antibodies reflects the antigenic composition of this virus, and the amount of the captured virions seems to reflect the size of the fraction carrying that particular antigen. Indeed, when the above-described protocol was applied to fluorescently labeled dengue virions, all of which carry the E protein antigen (38), MNPs cou-pled to the anti–E protein antibody 3H5 (39) captured close to 95% of viruses (Supplemental Figure 2). In general, our results are in agreement with the notion that a significant fraction of virions generated in vitro and in vivo are defective. The inability of virions to be recognized by VRC01 antibodies may be one of the manifes-tations of these defects. The nature of these defects on individual viral particles can now be analyzed using MNPs that carry antibod-ies recognizing different epitopes on ENV.
To characterize virions that bind anti-gp120-MNP complexes, it is important that each fluorescent event represent one virion, rather than viral aggregates formed due to the anti-gp120-MNPs cross-linking or to the binding of two or more virions to the same nanoparticle. Also, to resolve individual virus-MNP complexes, they should not simultaneously enter the laser beam of the flow cytometer. Several control experiments showed that about 90% of events represent individual viral particles whose antigenic makeup can now be characterized.
Coupling of monoclonal antibodies to magnetic nanoparticles. One milligram of 15-nm carboxyl-terminated magnetic iron oxide nanoparticles (Ocean NanoTech) was coupled to human monoclonal antibodies against HIV-1 gp120, either VRC01 (gift of J. Mascola, VRC, NIH, Bethesda, Maryland, USA) or 2G12. Briefly, 1 mg of MNPs was incubated in 400 μl of activation buffer supplemented with 1.7 mM 1-(3-dimethylaminopropyl)-3-ethylcar-bodiimide hydrochloride (EDAC) and 0.76 mM N-hydroxysulfosuccin-imide (sulfo-NHS) for 20 minutes at room temperature. After activation, 500 μl of coupling buffer was added to the particles, immediately followed by the addition 1 mg of the purified antibody. After 2-hour coupling in a thermomixer at room temperature with gentle mixing, the reaction was stopped by adding 10 μl of quenching solution and transferred to a 12 × 75 mm tube. Two wash steps with wash/storage buffer were performed using a SuperMAG-01 magnetic separator (Ocean NanoTech) at 4°C. The coupled MNPs were suspended in 4 ml of storage buffer and stored at 4°C at an iron oxide concentration of 0.25 mg/ml.
Capture and detection of HIV with nanoparticles. HIV-1 viral stocks (60 μl; between 1.14 × 10⁷ and 2.47 × 10⁷ virions, based on the p24 content) were
incubated with 60 μl (3.9 × 10¹²) of anti-gp120–coupled MNPs for 40
min-utes at 37°C with continuous mixing. Host cell proteins incorporated into viruses were revealed with a mixture of monoclonal antibodies. In our experiments, we used 3 μl each of the following monoclonal antibodies: anti–HLA-DR PE-Cy5.5 (or anti–HLA-DR APC-eFluor 780), anti–LFA-1 PE-Cy7, anti–CD45 eFluor 450 (eBioscience), and 3 μg of VRC01 labeled in-house with Alexa Fluor 647 (Invitrogen, Life Technologies), or their matched isotype controls. Also, we performed staining control, in which one antigen-specific antibody at a time was omitted from the staining (fluorescence minus one controls) (Supplemental Figure 3). The mixtures were incubated at room temperature for 15 minutes.
In order to visualize the MNP-VRC01 complexes, 4 μg of an Alexa Fluor 488–labeled goat anti-human IgG Fab (Jackson ImmunoResearch) was then added to the mixture and incubated for 5 minutes at room temper-ature. The HIV-1-MNP complexes with bound antibodies were separated from unbound reactants on μMACS magnetic columns mounted on a high-field μMACs magnet (both from Miltenyi Biotec). The columns were washed three times with the washing buffer and the complexes were eluted off the magnet in 400 μl of PBS and fixed in 1% formaldehyde in PBS.
These purified complexes were analyzed with an LSRII (BD Biosciences) flow cytometer equipped with 355-, 407-, 488-, 532-, and 638-nm lasers. The background level of fluorescence was evaluated with 0.1 μm filtered PBS, and the threshold was set to the lowest fluorescence channel that did not generate an Alexa Fluor 488 signal with this solution. Based on running fluorescence-free PBS through the cytometer, we set the threshold value to the minimum value that does not generate a signal (~600 to 1,000 fluorescence units mea-sured on the parameter height), which is why the plots displaying the trigger parameter show a straight line in the lower boundary (Supplemental Figure 1). This thresholding allowed us to visualize the fluorescence events associ-ated with virions but not the noise present in virus-free PBS. We defined the gate-eliminating dye aggregates and bead aggregates. In addition, elimination of the high signal height ensures that the signal analyzed remains within the range of linearity of the instrument and below the signal of the compensa-tion controls (Supplemental Figure 1). Spectral compensacompensa-tion coefficients were calculated with the compensation setup feature of DIVA6.1.3 software using CompBeads (BD), either nonstained or stained with individual fluo-rochromes. When compensation controls were acquired, the threshold trigger was set to 5,000 on the FSC channel. When DiO or DiD labels were used, the compensation was set using cells stained with the corresponding dye or unstained cells. For analysis the compensation coefficients were recalculated using FlowJo software (Tree Star). Data were acquired using FACSDiva 6.3 (BD Biosciences) and were analyzed with FlowJo software v9.4.9 (Tree Star).
flow analysis. However, while we did not find evidence of steric hindrance between MNPs and the two cellular antigens revealed here, steric hindrance may restrict the number of antigens simulta-neously identified on a single virion. Irrespective of the number of identifiable markers, in the next steps of the development of this technology, virus-MNP complexes could be sorted and subjected to modern virological and molecular biological assays. Although sorting of virions itself does not seem to be a problem, whether virions bound to MNPs retain their infectivity and, if so, it remains to be addressed whether they infect cells via binding to receptors and coreceptors and via fusion. Finally, the presence of endoge-nous antibodies against HIV antigens in patients’ blood may inter-fere with virion capture and analysis and makes the choice of the capture antibody difficult. Future studies may reveal other limita-tions of flow virometry.
Whatever these limitations are, the new method described here constitutes a technical advance that will help address the question of viral infectivity and transmissibility at the level of a single viral particle and thus may provide new insights into the basic mecha-nisms of viral infection and lead to the development of new more precisely targeted antivirals. For example, with the new technique, it may be possible to characterize the antigenic makeup of HIV-1 variants that transmit infection (the transmitted/founder HIV-1 variants). Further characterization of cellular antigens carried by the virions may allow them to be traced to the particular cells and tissue in which they replicated (44) and to determine which cells contribute to viral load at different stages of HIV-1 disease. Finally, we think that with our technique, it will be possible to study viral association with antibodies generated in an infected individual independently of their ability to neutralize theses viruses.
Methods
Virus preparations. CXCR4-tropic LAI.04 (HIV-1LAI.04) or CCR5-tropic
SF162 (HIVSF162) (82 ng/ml, 2.9 × 10⁸ RNA copies/ml and 37.8 ng/ml,
4.74 × 10⁸ RNA copies/ml, respectively) were produced in
phytohemagglu-tinin-P–stimulated (PHA-P–stimulated) PBMCs by the VQA (Rush Medi-cal School, Chicago, Illinois, USA) using the AIDS CliniMedi-cal Trials Group’s (ACTG) standard operating procedure. A second pair of these viruses was obtained by infection of Jurkat–tat-2H5 cells (gift of Q. Sattentau, Dunn School of Pathology, University of Oxford, Oxford, United Kingdom). These cells were grown in RPMI supplemented with 10% FCS, 50 μg/ml gentamycin, 0.5 μg/ml hygromicine, and 0.5 mg/ml G418. Cells (106) were
inoculated with 100 μl of either of the two HIV-1 variants at 37°C. Viral infection was monitored by flow cytometry of cells stained for intracellular p24 with the PE-labeled anti-p24 Ab KC57 (Beckman Coulter). When 40% of cells became p24 positive, 5 × 10⁶ cells were added. Twenty-four hours
later, the cells were centrifuged (500 g for 10 minutes) and supernatant containing virus was collected. All obtained viral stocks were quantified for their p24 GAG content, diluted to a concentration of 2.59 μg/ml, and frozen in 60-μl aliquots at –80°C. In experiments aimed at analyzing the specificity of HIV-1 capture and staining, we used preparations of microve-sicles derived from the SUPT1-CCR5 CL.30 cell line that were purified on sucrose gradients and diluted 1:10 from a stock at a concentration of 1.03 mg/ml. The GFP-expressing HIV-1NL4-3 variant was provided by T. Hope
(Northwestern University, Chicago, Illinois, USA). The stock of this virus contained 4.8 × 10⁹ virions per milliliter. HIV-1NL4-3, provided by J. Lifson
fication on μMACS columns; columns were washed four times with 200
μl of washing buffer. The MNP-HIV detection antibody complexes were eluted in 200 μl of PBS and fixed with 1% formaldehyde in PBS.
Quantification of HIV-1 virions by RT-PCR. A 200-μl aliquot of the MNP- virus complexes were eluted from a magnetic column, and flowthrough was subjected to nucleic acid extraction on a NucliSENS easyMAG 2.0 instrument (bioMérieux). The columns were treated with the NucliSENS extraction buffer to extract the RNA from viruses that remained attached to the column after elution. Real-time RT-PCR was performed by a one-step RT-PCR with a qScript One-Step Fast MGB qRT-PCR kit (Quanta Bio-Sciences) using a one-step real-time PCR assay with the following primer set: HIV-1 GAG (forward 1): GAGGCTAGAAGGAGAGAGATGGGT, HIV-1 GAG (reverse 1): CCCTGGCCTTAACCGAATTT, and the SR73 probe: FAM-GGG GC GAG AGC GTC AGT ATTA-MGB. Amplifications were car-ried out on a BioRad CFX96 Touch Thermocycler according to the follow-ing cyclfollow-ing parameters: 7.5 minutes at 480°C, 30 seconds at 95°C, followed by 45 cycles of 3 seconds at 95°C and 25 seconds at 600°C.
Labeling of MNPs and virions for evaluation of coincidences. MNPs coupled to goat anti-mouse IgG (H+L) antibodies according to the protocol described above were incubated with 3 μl of mouse monoclonal antibody labeled either with PE-Cy7 or PE-Cy5.5. Virions were concentrated and separated from serum proteins by centrifugal ultrafiltration on an Amicon ultrafil-tration device (Millipore) with a 100K molecular weight cutoff (MWCO), followed by a buffer exchange on the same device with a final volume of 50 μl. Viruses were labeled either with Alexa Fluor 350 or Pacific Orange (Invitrogen, Life Technologies) by adding 2.5 μl of dye solution (1 mg/ml in DMSO) for 2 hours at room temperature. The labeled viruses were sep-arated from free dyes by ultracentrifugation as described above and recon-stituted to their original volumes. Alternatively, washed and concentrated viruses were reconstituted to their original volume with PBS and labeled with the lipophilic fluorescent dyes DiD or DiO (Invitrogen, Life Technol-ogies) at 1.5 and 2.5 μM, respectively, in the presence of 0.02% pluronic F-127 (Invitrogen, Life Technologies) for 30 minutes at room tempera-ture. The labeled viruses were washed twice by ultracentrifugation on 30K MWCO centrifugal concentrators to remove free dyes.
Statistics. Data normality was verified by the Shapiro-Wilk W test. When the data did not pass the normality test, the nonparametric Wilcoxon procedure was used. When the data were found normally distributed, we used a Student’s
t test to compare two groups of data. All statistical analyses were performed with JMP 9.0 software (SAS Institute). For all statistics, we used two-tailed tests, and a P value of less than or equal to 0.05 was considered significant.
Study approval. The present study used human material donated by Michael Lederman (plasma) and Mimi Gosh (CVL) obtained in the frame-work of the studies performed under protocols approved by the IRBs of Case Western University (Cleveland, Ohio, USA) and George Washington University (Washington, DC, USA), respectively.
Acknowledgments
The authors would like to thank John Mascola for providing VRC01, Tome Hope for providing GFP-expressing HIV-1, Mimi Gosh for providing samples of CVL, and Michael Lederman for providing plasma samples obtained from HIV-1–infected patients. These experiments used reagents provided by the AIDS and Can-cer Virus Program, SAIC Frederick, Inc./National CanCan-cer Institute (NCI), Frederick, supported with Federal funds from the NCI, NIH, under contract HHSN261200800001E. We are grateful to Elena Zaitseva for her excellent guidance in staining virions with lipophilic dyes and to Sonia Zicari for her generous help with dengue viruses. We are thankful to Jeremy Swan and Yumiko Shep-herd for the preparation of Figure 1. This work was supported by
Optimization of HIV-1 virion capture. To optimize the procedure for viral capture, we performed a titration experiment in which we titered the amounts of both virus and beads. We used gradient-purified viruses and estimated particle content based on the assumption that one viral particle incorporates 5,000 p24 GAG molecules (45).
Based on p24 content, the amount of virus varied between 4.9 × 10⁹ and
1.57 × 10⁶ virions per assay, and the bead amount varied between 3.9 × 10¹²
and 1.25 × 10⁹ per assay, thus covering a bead/virus ratio from 2.54 × 10⁻¹
to 2.84 × 10⁶. The best recovery for 15-nm MNPs seems to be reached at a
bead/virus ratio above 104. Since there are around 13 gp120 spikes on HIV-1
virions (46), it is evident that the majority of the beads do not complex with virions. The inability of the beads to bind to virions may be due to the fact that not all of them are coupled with a sufficient number of antibodies to interact with virions with high affinity. Since the beads are revealed by fluo-rescent GAH Fab fragments against the coupled anti-gp120 antibody, beads that were not coupled with a sufficient amount of anti-gp120 antibodies will not only fail to bind virions, but will also be invisible in flow analysis.
The experiment was conducted by mixing 60 μl of virus with 60 μl of beads and 3 μg of labeled 2G12 antibody; the samples were processed as described above. To minimize variability in sample acquisition and to quantify the number of virions, we acquired a fixed sample volume (160
μl) using a high throughput sampler at a flow rate of 0.5 μl/s–1. We
com-pared the number of viruses recovered and detected by flow virometry to the input viruses estimated by p24 concentration and expressed this as the percentage of recovery. Also, the amount of viral RNA eluted after separa-tion on magnetic columns was compared with the amount that remained attached to the columns, and the amount that flowed through the column was quantified by PCR (see below). In addition, the fractions of HIV-1 that were retained and passed through the column were evaluated by measur-ing HIV p24 GAG with a sensitive bead assay as described previously (47). Alternatively, we evaluated these fractions using GFP-HIV-1 variants. These virions have been directly visualized and enumerated by flow analysis.
Capture and detection of HIV-1 virions in body fluids. In some experiments, HIV virions were analyzed in the context of body fluids, blood plasma, and CVL. Normal blood plasma was obtained from the NIH blood bank. CVL was obtained from M. Gosh (George Washington University, Washington, DC, USA). Blood plasma from HIV-infected individuals was provided by M. Leder-man (Case Western Reserve University School of Medicine, Cleveland, Ohio, USA). Both body fluids were obtained according to IRB-approved protocols.
In these experiments, we spiked platelet-poor plasma (PPP) with HIV-1. PPP was obtained from healthy donors’ blood collected in 8-ml tubes with sodium citrate (3.2%), centrifuged at 2,000 g for 15 minutes, followed by a sec-ond centrifugation at 13,000 g for 2 minutes to remove residual platelets. PPP was spiked with HIV-1NL4.3 (4.9 × 10⁹ copies/ml) and incubated with MNPs
(3.9 × 10¹²) coupled with VRC01 for 1 hour at 4°C; as a control, we used
unspiked plasma. Bound HIV-1NL4.3 was revealed by another HIV-1 gp120
antibody, 2G12 Alexa 647. MNPs were visualized by staining the Fc portion of the coupled antibody using the Alexa 350 Zenon Labeling Kit (Invitrogen). To capture HIV-1 in clinical samples, we optimized the protocol described above. PPP containing 1.1 × 10⁴ to 1.6 × 10⁵ copies/ml of HIV-1
particles was obtained from an infected subject. This concentration was below or close to the cutoff of our standard protocol, which calls for about 105 copies. Therefore, to concentrate virus, plasma was incubated with
puri-Address correspondence to: Leonid Margolis or Jean-Charles Grivel, NIH, 10 Center Drive, Bldg. 10, Rm. 9D58, Bethesda, Mary-land 20892, USA. Phone: 301.594.2476; Fax: 301.480.0857; E-mail: [email protected] (L. Margolis). Phone: 301.594.1298; Fax: 301.480.0857; E-mail: [email protected] (J.C. Grivel).
the intramural program of the Eunice Kennedy-Shriver National Institute of Child Health and Human Development.
Received for publication January 22, 2013, and accepted in revised form June 6, 2013.
1. Bonner WA, Hulett HR, Sweet RG, Herzenberg LA. Fluorescence activated cell sorting. Rev Sci Instrum. 1972;43(3):404–409.
2. Perfetto SP, Chattopadhyay PK, Roederer M. Seven-teen-colour flow cytometry: unravelling the immune system. Nat Rev Immunol. 2004;4(8):648–655. 3. Keele BF, et al. Identification and characterization
of transmitted and early founder virus envelopes in primary HIV-1 infection. Proc Natl Acad Sci U S A. 2008;105(21):7552–7557.
4. Lawn SD, Butera ST. Incorporation of HLA-DR into the envelope of human immunodeficiency virus type 1 in vivo: correlation with stage of disease and presence of opportunistic infection. J Virol. 2000; 74(21):10256–10259.
5. Lien KY, Hung LY, Huang TB, Tsai YC, Lei HY, Lee GB. Rapid detection of influenza A virus infection utilizing an immunomagnetic bead-based microflu-idic system. Biosens Bioelectron. 2011;26(9):3900–3907. 6. Yang SY, Lien KY, Huang KJ, Lei HY, Lee GB. Micro flow cytometry utilizing a magnetic bead-based immunoassay for rapid virus detection. Biosens Bioelectron. 2008;24(4):861–868.
7. Stoffel CL, Kathy RF, Rowlen KL. Design and characterization of a compact dual channel virus counter. Cytometry A. 2005;65(2):140–147. 8. Steen HB. Flow cytometer for measurement of the
light scattering of viral and other submicroscopic particles. Cytometry A. 2004;57(2):94–99. 9. Brussaard CP, Marie D, Bratbak G. Flow
cytomet-ric detection of viruses. J Virol Methods. 2000; 85(1–2):175–182.
10. Hercher M, Mueller W, Shapiro HM. Detection and discrimination of individual viruses by flow cytom-etry. J Histochem Cytochem. 1979;27(1):350–352. 11. Iannelli D, et al. Cytofluorimetric method for the
detection of the cucumber mosaic virus. Phytopa-thology. 1996;86:959–965.
12. Iannelli D, et al. Simultaneous detection of cucum-ber mosaic virus, tomato mosaic virus and potato virus Y by flow cytometry. J Virol Methods. 1997; 69(1–2):137–145.
13. Kim BC, Ju MK, Dan-Chin-Yu A, Sommer P. Quan-titative detection of HIV-1 particles using HIV-1 neutralizing antibody-conjugated beads. Anal Chem. 2009;81(6):2388–2393.
14. Trkola A, et al. Human monoclonal antibody 2G12 defines a distinctive neutralization epitope on the gp120 glycoprotein of human immunodeficiency virus type 1. J Virol. 1996;70(2):1100–1108. 15. Zhou T, et al. Structural basis for broad and potent
neutralization of HIV-1 by antibody VRC01. Sci-ence. 2010;329(5993):811–817.
16. Arthur LO, et al. Cellular proteins bound to immu-nodeficiency viruses: implications for pathogenesis and vaccines. Science. 1992;258(5090):1935–1938. 17. Gomez MB, Hildreth JE. Antibody to adhesion
molecule LFA-1 enhances plasma neutralization
of human immunodeficiency virus type 1. J Virol. 1995;69(8):4628–4632.
18. Nguyen DH, Hildreth JE. Evidence for budding of human immunodeficiency virus type 1 selectively from glycolipid-enriched membrane lipid rafts.
J Virol. 2000;74(7):3264–3272.
19. Ferris MM, McCabe MO, Doan LG, Rowlen KL. Rapid enumeration of respiratory viruses. Anal Chem. 2002;74(8):1849–1856.
20. van der Pol E, van Gemert MJ, Sturk A, Nieuwland R, van Leeuwen TG. Single vs. swarm detection of microparticles and exosomes by flow cytometry.
J Thromb Haemost. 2012;10(5):919–930.
21. Tremblay MJ, Fortin JF, Cantin R. The acquisition of host-encoded proteins by nascent HIV-1. Immu-nol Today. 1998;19(8):346–351.
22. Cantin R, Martin G, Tremblay MJ. A novel virus capture assay reveals a differential acquisition of host HLA-DR by clinical isolates of human immu-nodeficiency virus type 1 expanded in primary human cells depending on the nature of produc-ing cells and the donor source. J Gen Virol. 2001; 82(pt 12):2979–2987.
23. Nyambi PN, Burda S, Bastiani L, Williams C. A virus binding assay for studying the antigenic landscape on intact, native, primary human immu-nodeficiency virus-type 1. J Immunol Methods. 2001; 253(1–2):253–262.
24. Leaman DP, Kinkead H, Zwick MB. In-solution virus capture assay helps deconstruct heteroge-neous antibody recognition of human immunode-ficiency virus type 1. J Virol. 2010;84(7):3382–3395. 25. Capobianchi MR, Fais S, Castilletti C, Gentile
M, Ameglio F, Dianzani F. A simple and reliable method to detect cell membrane proteins on infec-tious human immunodeficiency virus type 1 parti-cles. The J Infect Dis. 1994;169(4):886–889. 26. Yan X, Schielke EG, Grace KM, Hassell C,
Mar-rone BL, Nolan JP. Microsphere-based duplexed immunoassay for influenza virus typing by flow cytometry. J Immunol Methods. 2004;284(1–2):27–38. 27. Yan X, Zhong W, Tang A, Schielke EG, Hang W, Nolan JP. Multiplexed flow cytometric immunoas-say for influenza virus detection and differentia-tion. Anal Chem. 2005;77(23):7673–7678. 28. Lehmann M, et al. Quantitative multicolor super-
resolution microscopy reveals tetherin HIV-1 interac-tion. PLoS Pathog. 2011;7(12):e1002456.
29. Jouvenet N, Zhadina M, Bieniasz PD, Simon SM. Dynamics of ESCRT protein recruitment during ret-roviral assembly. Nat Cell Biol. 2011;13(4):394–401. 30. Jouvenet N, Simon SM, Bieniasz PD. Imaging the
interaction of HIV-1 genomes and Gag during assembly of individual viral particles. Proc Natl Acad Sci U S A. 2009;106(45):19114–19119.
31. Jouvenet N, Simon SM, Bieniasz PD. Visualizing HIV-1 assembly. J Mol Biol. 2011;410(4):501–511. 32. McDonald D, et al. Visualization of the
intra-cellular behavior of HIV in living cells. J Cell Biol. 2002;159(3):441–452.
33. Hulme AE, Perez O, Hope TJ. Complementary assays reveal a relationship between HIV-1 uncoat-ing and reverse transcription. Proc Natl Acad Sci U S A. 2011;108(24):9975–9980.
34. Lai SK, et al. Human immunodeficiency virus type 1 is trapped by acidic but not by neutral-ized human cervico vaginal mucus. J Virol. 2009; 83(21):11196–11200.
35. Meerloo T, et al. Host cell membrane proteins on human immunodeficiency virus type 1 after in vitro infection of H9 cells and blood mononuclear cells. An immuno-electron microscopic study. J Gen Virol. 1993;74(pt 1):129–135.
36. Robey WG, et al. Characterization of envelope and core structural gene products of HTLV-III with sera from AIDS patients. Science. 1985;228(4699):593–595. 37. Nolan JP, Stoner SA. A trigger channel thresh-old artifact in nanoparticle analysis. CytometryA. 2013;83(3):301–305.
38. Zhang X, et al. Cryo-EM structure of the mature dengue virus at 3.5-A resolution. Nat Struct Mol Biol. 2013;20(1):105–110.
39. Gentry MK, Henchal EA, McCown JM, Brandt WE, Dalrymple JM. Identification of distinct antigenic determinants on dengue-2 virus using monoclonal antibodies. Am J Trop Med Hyg. 1982; 31(3 pt 1):548–555.
40. Ott DE. Cellular proteins detected in HIV-1. Rev Med Virol. 2008;18(3):159–175.
41. Trubey CM, et al. Quantitation of HLA class II pro-tein incorporated into human immunodeficiency type 1 virions purified by anti-CD45 immunoaf-finity depletion of microvesicles. J Virol. 2003; 77(23):12699–12709.
42. Cantin R, Fortin JF, Tremblay M. The amount of host HLA-DR proteins acquired by HIV-1 is virus strain- and cell type-specific. Virology. 1996;218(2):372–381. 43. Biancotto A, et al. HIV-1 induced activation of
CD4+ T cells creates new targets for HIV-1 infec-tion in human lymphoid tissue ex vivo. Blood. 2008; 111(2):699–704.
44. Lawn SD, Roberts BD, Griffin GE, Folks TM, But-era ST. Cellular compartments of human immuno-deficiency virus type 1 replication in vivo: deter-mination by presence of virion-associated host proteins and impact of opportunistic infection.
J Virol. 2000;74(1):139–145.
45. Briggs JA, et al. The stoichiometry of Gag protein in HIV-1. Nat Struct Mol Biol. 2004;11(7):672–675. 46. Mao Y, et al. Subunit organization of the
mem-brane-bound HIV-1 envelope glycoprotein trimer.
Nat Struct Mol Biol. 2012;19(9):893–899.