http://dx.doi.org/10.4236/msa.2015.61006
How to cite this paper: Balta, A.K., Ertek, Ö., Eker, N. and Okur, İ. (2015) MgO and ZnO Composite Thin Films Using the Spin Coating Method on Microscope Glasses. Materials Sciences and Applications, 6, 40-47.
http://dx.doi.org/10.4236/msa.2015.61006
MgO and ZnO Composite Thin Films Using
the Spin Coating Method on Microscope
Glasses
Ayşe Kaya Balta, Özlem Ertek, Nail Eker, İbrahim Okur*
Department of Physics, Sakarya University, Sakarya, Turkey Email: *[email protected]
Received 22October 2014; revised 16November 2014; accepted 5December 2014 Copyright © 2015 by authors and Scientific Research Publishing Inc.
This work is licensed under the Creative Commons Attribution International License (CC BY).
http://creativecommons.org/licenses/by/4.0/
Abstract
In this study, a new route to produce pure and composite ZnO-MgO thin films has been presented. In the process the pure ZnO thin films were the starting point, ending up with MgO by doping various percentages (from 0% to 100%) of Mg with the help of sol-gel spin coating technique. The crystal phases in all doping levels have been obtained when the samples annealed at 600˚C for a duration of 6 hours. The X-ray diffraction (XRD) spectra, the scanning electron microscopy (SEM) micrographs and UV-Vis absorption spectra have been performed to elucidate the composed film structures.
Keywords
ZnO, MgO, Doping, Microscope Glass, Spin Coating, Thin Film
1. Introduction
Metal oxide thin films have received great attraction in the recent years due to their outstanding characteristics in optical properties in the area of photonics. ZnO nanostructures display novel size dependent effects [1] [2], good electrical properties and high luminescence yields [3]-[6]. ZnO thin films have the potential to be used as thin solar cells, field effect transistors, chemical/gas sensors, photocatalyzers and antimicrobial agents [7]-[11]. Zinc oxide is a direct band gap (~3.37 eV) semiconductor material and has a stable wurtzite structure with the lattice spacing of a = 0.325 nm and c = 0.521 nm.
Mg may be used as dopant to modify the luminescence of ZnO crystals since one needs to construct hetero-junction to obtain double confinement actions for both electrons and photons [12] and has similar physical and
A. K. Balta et al.
chemical properties to those of Zn. For example, the ionic radii of Mg2+ and Zn2+ ions are similar (0.57 Å for magnesium and 0.6 Å for zinc). Doping Mg to ZnO films can create MgO nanostructures [13] and this process is performed generally to increase the bandgap of zinc oxide from 3.37 eV to higher values up to 7.7 eV [14]. MgO has a cubic rack salt structure and a = 4.212 Å with the band gap of 7.6 eV, known to be made of p-type semiconductor by doping lithium etc. It can be used for gas sensors, superconductors, solar cells, electronics, semiconductors and catalysis [15]-[20].
Pure ZnO, MgO thin films and their doped forms can be produced by various techniques, namely pulsed laser deposition (PLD), metal organic chemical vapor deposition (MOCVD), molecular beam epitaxy (MBE), magne-tron sputtering etc. [21] [22]. Hydrothermal production technique can also be employed in these types of oxide films. Sol-gel chemistry together with the spin coating method is generally exploited to obtain high quality thin films of tens of cm2 film areas on both crystalline and amorphous surfaces. The crystalline quality of the film can then be improved by using conventional annealing processes [23] [24].
In this study it has been aimed to produce Mg doped ZnO thin films. For this purpose, a series of experiments have been performed with up to 100% Mg doping concentrations. The molarity of all the semiconductor thin films produced was selected to be 0.5 M. 600˚C thermal annealings have been performed for all samples to reach the crystalline phase. Mg or other metal doping experiments made by various research groups have been reported to obtain the optimal doping concentration at about 3%. Above this doping value the thin films are re-ported to worsen the crystalline quality [25] [26]. In the current study we have also noticed that behavior, though at 15% doping level, however by carrying on with higher doping concentrations the crystal phase was returned. When reaching at 100% doping level, we have perceived that ZnO and MgO crystal phases inhibit together within the film matrices, finally reaching the thin film of MgO.
2. Experimental
Pure ZnO, MgO and Mg/Zn doped ZnO/MgO thin films have been deposited onto the microscope glasses by using the spin coater. For the pure ZnO thin films, zinc precursor solution was prepared by dissolving zinc ace-tate dehydrate (C4H10O6Zn) in methoxyethanol (C3H8O2) to obtain 0.5 M concentration. In this process
mono-ethanolamine was used as a complexing agent. For the Mg doped and pure MgO films (i.e., 100% Mg doping), magnesium acetate tetrahydrate (Mg(CH3COO)2·4H2O) has been used with methoxyethanol (C3H8O2) and sol
has been obtained with 0.5 M concentration. These two solutions have been used to attain the desired doping concentrations. For example, for 1% Mg doping, 1:99 ratio has been used to obtain the desired Mg:ZnO doped films. All solutions were mixed at 60˚C/1h using magnetic stirrer (Wisestir, MSH-20A) at atmospheric pressure. The films were then spin coated on microscope glasses at the speed of 500 rpm and undergone ten layers of deposition. Each layer was dried at 250˚C for 10 minutes to remove the residual parts from the films. Having completed the ten layers of coatings, the thin film coated samples were annealed at 600˚C for six hours at a fur-nace (Nabertherm B170) to reach the crystal phase (see Figure 1). This process was repeated for the pure ZnO, MgO and the mixture of ZnO/MgO thin films and all the samples have been analyzed by means of the XRD, SEM and UV-Vis spectrometry.
3. Results and Discussion
3.1. XRD Spectra
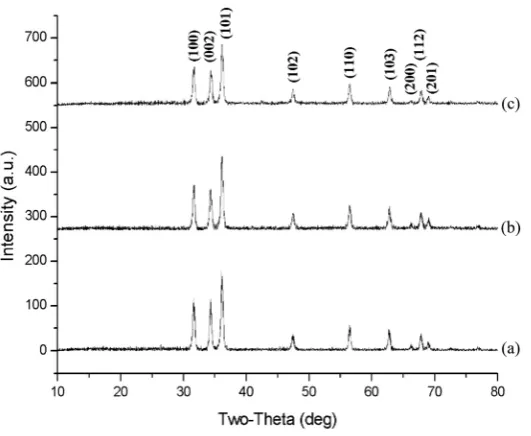
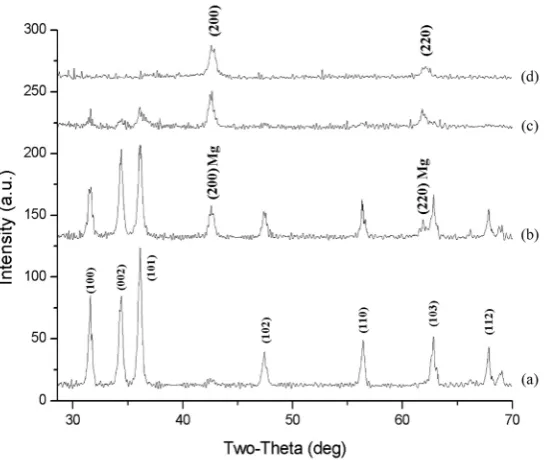
The XRD spectra of the produced thin films (ZnO, MgO and the mixture of the two) have been recorded by means of an XRD diffractometer (Rigaku D/Max 2200PC) using CuKα band (λ = 0.154 nm). For all the doping concentration levels it has been found that all the films were crystallized at 600˚C. Doping Mg to the ZnO structure has decreased the ZnO classical peaks, though they exhibited themselves in the XRD pattern (see Fig- ure 2 and Figure 3). Increasing the doping concentrations of Mg has continually decreased the ZnO peaks whereas the MgO peaks have appeared to increase in intensity which was the sign of forming independent MgO nanostructures together with the ZnO ones.
Figure 1. Flow diagram of the ZnO, MgO and nZnO + mMgO thin film pro-duction process.
Figure 2. XRD patterns of the thin films annealed at 600˚C for (a) undoped ZnO; (b) 3% Mg doped ZnO and (c) 10% Mg doped ZnO thin films on micro-scope glasses. Diffraction peaks denoted here are related to the ZnO.
concentration levels. From Figures 2-4 one may conclude that the ZnO and MgO nano/microstructures coexist in the film matrices from the fact that the two XRD pattern in these figures reflects the two phases living to-gether and that the peaks do not affect each other’s position. With this process we have successfully obtained thin films in various doping concentrations, which seemed to be a new route to attain various hybrid thin films that can be used in the optoelectronics industry. One may conclude here that the process could be repeated by starting with MgO and doping Zn into the structure and this might give the similar results obtained in this study.
3.2. SEM Micrographs
The SEM micrographs of all the samples have been taken using an SEM (JEOL 6060LV) spectrometer. Figure 5
and Figure 6 depict the morphology of the thin films produced by annealing the samples at 600˚C for six hours
[image:3.595.183.449.319.537.2]A. K. Balta et al.
Figure 3. XRD patterns of the thin films annealed at 600˚C for (a) 5% Mg doped ZnO; (b) 7% Mg doped ZnO; (c) 10% Mg doped ZnO; (d) 15% Mg doped ZnO; (e) 20% Mg doped ZnO; (f) 30% Mg doped ZnO; (g) 40% Mg doped ZnO; (h) 50% Mg doped ZnO; (i) 70% Mg doped ZnO; (j) 90% Mg- doped ZnO; and (k) 100% Mg doped ZnO (or undoped MgO) thin films on microscope glasses.
Figure 4. XRD patterns of the thin films annealed at 600˚C for (a) 20% Mg doped ZnO; (b) 40% Mg doped ZnO; (c) 70% Mg doped ZnO; (d) 100% Mg doped ZnO (or undoped MgO) thin films on microscope glasses.
[image:4.595.175.454.86.302.2] [image:4.595.178.452.381.611.2]Figure 5. SEM images of the ZnO:Mg thin films (a) undoped (ZnO), annealed
at 600˚C; (b) 3% Mg doped ZnO; (c) 15% Mg doped ZnO and (d) 40% Mg
doped ZnO.
Figure 6. SEM images of the ZnO:MgO thin films, (a) 50% Mg doped ZnO; (b) 70% Mg doped ZnO; (c) 90% Mg doped ZnO and (d) 100% Mg doped
ZnO (i.e., MgO thin film).
In general, the thin films obtained contain plain areas together with some nanorods or nanocobweb-like struc-tures. If one carefully examines the XRD spectrum and SEM image for 15% Mg doped ZnO thin film, it can be concluded that the MgO crystal grains tend to amorphise and the grains seems to be vague (see Figure 5(c)). From the SEM images the grains sizes/radii for ZnO crystal phase are found to be around 50 to 70 nm whereas they have been evaluated to be 22 to 30 nm by using the Debye-Scherrer formula
cos
K
D λ
β θ
=
[image:5.595.171.457.342.568.2]A. K. Balta et al.
(FWHM, in rad), θ is the diffraction angle and the constant K has the value about 0.9 - 0.92. The difference be-tween the evaluation and the observation is attributed to the fact that the grains in the SEM images may consist of multi-crystal fragments and this might be enlighten by using high resolution SEM images, e.g. FESEM.
The grain sizes for MgO are evaluated to be 15 - 35 nm by using XRD spectra whereas they are measured to be 50 nm up to 40% doping concentrations (see Figure 5(d)). For higher doping concentrations two distinct structures appear in the thin films produced, ones being thoroughly shperical (and bigger in size, about 120 nm) and the others, dot like structures (about 10 nm) (see Figure 6(c)). This clearly shows that the MgO grain size evaluation value is likely to be correct. For pure MgO thin films, i.e. 100% Mg doping case, the structure is dif-ficult to analyse (see Figure 6(d)) in terms of grain dimensions.
3.3. UV-Vis Spectra
[image:6.595.186.442.257.670.2]The UV-Vis spectra of ZnO and Mg doped ZnO thin films have been obtained by using Agilent 8453 UV-Vis spectrometer. The spectra for the samples annealed at 600˚C for six hours have been depicted in Figure 7.
From the spectra it has been perceived that for the samples annealed at 600˚C, the annealing temperature has the effect of creating the conventional ZnO peak which was situated at about 370 nm (3.35 eV) and new absorp-tion bands for pure MgO thin films situated at about 550 nm (2.26 eV), 610 nm (2.04 eV) and 700 nm (1.78 eV). Increasing the dopant (Mg) concentration has the effect of suppressing the ZnO absorption peak (see Figures 7(a)-(c)) and wiping it out at higher doping concentrations (after 40% Mg doping level). This can be clearly seen in Figures 7(d)-(h). After 15% Mg doping concentrations the MgO absorption peaks reveal themselves and these peaks become dominant after 90% Mg doping level. These new MgO absorption peaks are of importance as they can be used as wavelength selective applications. A very similar result for Cu doping, which has a strong absorption bands situated at about 570 nm wavelength, has been obtained in another work [27].
4. Conclusions and Discussions
In this study Mg doped ZnO thin films in various concentrations were fabricated on microscope glasses using the spin coating method and the optical properties of these samples were investigated by using XRD, SEM and UV-Vis spectra. It has been found that for all Mg doping concentrations, ranging from 0% to 100%, crystal structures have been attained. From the XRD spectra it has been found that the thin films inhibit both the ZnO and the MgO semiconductor crystal structures together within the film matrices as their diffraction peaks pre-sented in the spectra and the doping concentrations reflect themselves in the peak heights, therefore the presence of one has not any impact of suppressing the other’s intensity. We have managed to produce MgO and ZnO grains together inside the film matrix which, to our knowledge, is the first appearance of these kind of empirical processes in the literature. From these serial experiments one may realize that it is likely to produce various metal doped thin film structures which might inhibit very interesting optical properties in the area of photonics.
From the SEM images it has been perceived that the grain sizes and shapes change to some extent by chang-ing the dopchang-ing concentration. The shape of grains initially looks like more or less a sphere (for pure ZnO thin films) and ends up with a rather rocky structure when reaching the MgO crystal phase. For higher Mg doping concentrations two distinct structures appear in the thin films produced, ones being thoroughly shperical and the others dot like structures. Forming MgO in the thin film structures together with ZnO diminishes the ZnO ab-sorption peak situated at 370 nm and creates abab-sorption bands at about 550 nm, 610 nm and 700 nm.
Acknowledgements
Authors would like to thank to Sakarya University for the financial support and Fuat Kayış for careful work on taking the SEM and XRD spectra.
References
[1] Liang, S., Zhu, L., Gai, G., et al. (2014) Synthesis of Morphology-Controlled ZnO Microstructures via a
Micro-wave-Assisted Hydrothermal Method and Their Gas-Sensing Property. Ultrasonic Sonochemistry, 21, 1335-1342.
http://dx.doi.org/10.1016/j.ultsonch.2014.02.007
[2] Mao, S., Shang, T., Park, B., et al. (2014) Measuring Size Dependent Electrical Properties from Nanoneedle Structures:
Pt/ZnO Schottky Diodes. Applied Physics Letters, 104, Article No: 153105.
[3] He, H., Yang, W., Liu, C., Sun, L.W. and Ye, Z.Z. (2011) Size-Dependent Surface Effects on the Photoluminescence
in ZnO Nanorods. Journal of Physical Chemistry C, 115, 58-64. http://dx.doi.org/10.1021/jp106990a
[4] Bedia, A., Bedia, F.Z., Aillerie, M., Maloufi, N., Ould Saad Hamady, S., Perroudd, O. and Benyoucef, B. (2014)
Opti-cal, Electrical and Structural Properties of Nano-Pyramidal ZnO Films Grown on Glass Substrate by Spray Pyrolysis
Technique. Optical Materials, 36, 1123-1130. http://dx.doi.org/10.1016/j.optmat.2014.02.012
[5] Felbier, P., Yang, J., Theis, J., Liptak, R.W., Wagner, A., Lorke, A., Bacher, G. and Kortshagen, U. (2014) Highly
Luminescent ZnO Quantum Dots Made in a Nonthermal Plasma. Advanced Functional Materials, 24, 1988-1993.
http://dx.doi.org/10.1002/adfm.201303449
[6] Gruzintsev, A.N. and Volkov, W.T. (2011) Modification of Electrical and Optical Properties of ZnO Films under
Ul-traviolet Irradiation. Semiconductors, 45, 1420-1424. http://dx.doi.org/10.1134/S1063782611110121
[7] Park, H., Iftiquar, S.M., Trinh, T.T., Jang, J., Ahn, S., Kim, S., Lee, J., Jung, J., Shin, C., Kim, M. and Yi, J.S. (2014)
Effects of Target Angle on the Properties of Aluminum Doped Zinc Oxide Films Prepared by DC Magnetron
Sputter-ing for Thin Film Solar Cell Applications. Journal of Nanoscience and Nanotechnology, 14, 7710-7717.
A. K. Balta et al.
[8] Morales-Acosta, M.D., Quevedo-Lopez, M.A. and Ramirez-Bon, R. (2014) PMMA-SiO2 Hybrid Films as Gate
Di-electric for ZnO Based Thin-Film Transistors. Materials Chemistry and Physics, 146, 380-388.
http://dx.doi.org/10.1016/j.matchemphys.2014.03.042
[9] Park, N.-K., Park, Y.Y. and Lee, T.J. (2014) Response of a ZnO Single Crystal Rod-Based Chemical Sensor for
Hy-drogen Sulfide. Journal of Nanoscience and Nanotechnology, 14, 6326-6330. http://dx.doi.org/10.1166/jnn.2014.8803
[10] Lam, S.-M., Sin, J.-C., Abdullah, A.Z. and Mohamed, A.R. (2013) Photocatalytic Degradation of Resorcinol, an
En-docrine Disrupter, by TiO2 and ZnO Suspensions. Environmental Technology, 34, 1097-1106.
http://dx.doi.org/10.1080/09593330.2012.736538
[11] Firouzabadi, F.B., Noori, M., Edalatpanah, Y. and Mirhosseini, M. (2014) ZnO Nanoparticle Suspensions Containing
Citric Acid as Antimicrobial to Control Listeria monocytogenes, Escherichia coli, Staphylococcus aureus and Bacillus
cereus in Mango Juice. Food Control, 42, 310-314. http://dx.doi.org/10.1016/j.foodcont.2014.02.012
[12] Zhang, L.C., Li, Q.S., Wang, F.F., Qu, C. and Zhao, F.Z. (2014) Room Temperature Electroluminescence from
n-ZnO:Ga/i-ZnO/p-GaN:Mg Heterojunction Device Grown by PLD. Electronic Materials Letters, 10, 661-664.
http://dx.doi.org/10.1007/s13391-013-2206-3
[13] Vijayalakshmi, K. and Karthick, K. (2014) Growth of Highly c-Axis Oriented Mg:ZnO Nanorods on Al2O3 Substrate
towards High-Performance H2 Sensing. International Journal of Hydrogen Energy, 39, 7165-7172.
http://dx.doi.org/10.1016/j.ijhydene.2014.02.123
[14] Çağlar, M., Wu, J., Li, K., Caglar, Y., Ilican, S. and Xue, D.F. (2010) MgxZn1−xO (x = 0 - 1) Films Fabricated by
Sol-Gel Spin Coating. Materials Research Bulletin, 45, 284-287. http://dx.doi.org/10.1016/j.materresbull.2009.12.025
[15] Vijayalakshmi, K., Karthick, K., Raj, P. and Sridharan, M. (2014) Influence of Thickness of MgO Overlayer on the
Properties of ZnO Thin Films Prepared on c-Plane Sapphire for H2 Sensing. Ceramics International, 40, 827-833.
http://dx.doi.org/10.1016/j.ceramint.2013.06.075
[16] Huhtinen, H., Palonen, H. and Paturi, P. (2013) The Growth Rate and Temperature İnduced Microcracks in YBCO
Films Pulsed Laser Deposited on MgO Substrates. IEEE Transactions on Applied Superconductivity, 23, Article No:
7200104.
[17] Kuwahata, Y. and Minemoto, T. (2014) Impact of Zn1-xMgxO:Al Transparent Electrode for Buffer-Less Cu(In, Ga)Se2
Solar Cells. Renewable Energy, 65, 113-116. http://dx.doi.org/10.1016/j.renene.2013.07.038
[18] Cantoni, M., Boseggia, S., Petti, D., Cattoni, A. and Bertacco, R. (2014) Structural Comparison between MgO/Fe(0 0 1)
and MgO/Fe(0 0 1)–p(1 × 1)O Interfaces for Magnetic Tunneling Junctions: An Auger Electron Diffraction Study.
Ap-plied Surface Science, 305, 167-172. http://dx.doi.org/10.1016/j.apsusc.2014.03.032
[19] Xiao, B., Walker, B. and Pradhan, A.K. (2014) Influence on an MgO İnterfacial Layer on the Properties of Pb(Zr,
Ti)O-3/ZnO Ferroelectric Semiconductor Heterostructures. Journal of Physics D—Applied Physics, 47, Article No:
UNSP185303.
[20] Stiehler, C., Pan, Y., Schneider, W.D., Koskinen, P., Häkkinen, H., Nilius, N. and Freund, H.J. (2013) Electron
Quan-tization in Arbitrarily Shaped Gold Islands on MgO Thin Films. Physical Review B, 88, Article ID: 115415.
[21] Su, J., Niu, A., Tang, C., et al. (2011) Structural and Optical Properties of ZnO Films Grown by Two-Step Method
Using MOCVD. Optoelectronics and Advanced Materials—Rapid Communications, 5, 751-754.
[22] Wei, S., Lian, J. and Wu, H. (2010) Annealing Effect on the Photoluminescence Properties of ZnO Nanorod Array
Prepared by a PLD-Assistant Wet Chemical Method. Materials Characterization, 61, 1239-1244.
http://dx.doi.org/10.1016/j.matchar.2010.08.002
[23] Wang, S.K., Lin, T.C., Jian, S.R., Juang, J.Y., Jang, J.S.C. and Tseng, J.Y. (2011) Effects of Post-Annealing on the
Structural and Nanomechanical Properties of Ga-Doped ZnO Thin Films Deposited on Glass Substrate by rf-Magne-
tron Sputtering. Applied Surface Science, 258, 1261-1266. http://dx.doi.org/10.1016/j.apsusc.2011.09.088
[24] Ma, S., Liang, H., Wang, X., Zhou, J., Li, L.T. and Sun, C.Q. (2011) Controlling the Band Gap of ZnO by
Program-mable Annealing. Journal of Physical Chemistry C, 115, 20487-20490. http://dx.doi.org/10.1021/jp207237d
[25] Peng, X., Xu, J., Zang, H., Wang, B. and Wang, Z. (2008) Structural and PL Properties of Cu-Doped ZnO Films.
Journal of Luminescence, 128, 297-300. http://dx.doi.org/10.1016/j.jlumin.2007.07.016
[26] Sahu, D.R. (2010) Properties of Doped ZnO Thin Films Grown by Simultaneous dc and RF Magnetron Sputtering.
Materials Science and Engineering: B, 171, 99-103. http://dx.doi.org/10.1016/j.mseb.2010.03.080
[27] Nalbant, A., Ertek, Ö. and Okur, I. (2013) Producing CuO and ZnO Composite Thin Films Using the Spin Coating