http://dx.doi.org/10.4236/jpee.2015.34001
Simulation and Analysis on Winding
Deformation of a Power Transformer in
Current Transformer Connecting Manner
Lanqin Geng
1, Ning Zhang
21Section of Fundamental Theory, Hengshui College of Vocational Technology, Hengshui, China 2Department of Electrical Engineering, North China Electric Power University, Baoding, China
Email: zhang_ning26@126.com
Received September 2014
Abstract
Transformer winding deformation is one of the main types of transformer faults. To check if a power transformer is being under winding deformation, the transformer can be connected in a current transformer during its testing. A transformer winding simulating model is set up under this connecting manner. Then the simulation has been performed with current source which is the frequency sweep power. The simulation results show that the winding deformation can be re-flected effectively with current source method. This method lays the foundation for the realization of on-line monitoring and diagnosis of the transformer neutral directly grounded side winding.
Keywords
Winding Deformation, Frequency Response Method, Current Source
1. Introduction
Power transformer is one of the core equipment of power system. Its safe operation is crucial to guarantee the security of the power system [1] [2]. Transformer winding deformation is one of the main types of transformer faults [3] [4]. The maintenance period of transformer is more than half a year with high cost and wide influence [5]. The realization of on-line monitoring and diagnosis for transformer winding deformation will benefit for real-time record of winding running state.
Frequency response method is one of the main methods for the detection of transformer winding deformation at home and abroad, which can detect the winding short circuit impedance change of 0.2% or axial size change of 0.3% [6]. The winding is equivalent to a passive linear network when the excitation signal frequency is higher than 1 kHz. The frequency response characteristic is the outstanding property of passive linear network. The frequency response characteristic is the only for a given network. The winding equivalent parameters will be changed with the winding deformation. The frequency response curves will change reaction to the winding fre-quency response characteristic.
side winding which is in the online running state, current source sweep signal is applied to the grounding line through the current transformer. And the high frequency current signal is obtained in the outlet side through the current transformer. Then the frequency response curves are drawn to determine winding deformation through the comparative analysis of deformation response curves [7] (hereinafter referred as the current source method). The method will benefit for real-time record of winding running state and high sensitivity.
2. Establishment of Simulation Model
The core permeability and air permeability are almost the same when transformer is in the high frequency signal excitation (Usually more than 1 kHz). The transformer winding is equivalent to a passive linear network which consists of distributed inductance and capacitance [8] [9]. As shown in Figure 1, the winding equivalent model has 6 levels, and its distribution parameters are uniform distribution parameters for hypothesis.
Where, L is transformer winding inductance; K is transformer winding longitudinal capacitance; C is trans-former winding ground capacitance; R1 is input matching resistor; R2 is equivalent resistance of output mea-surement loop [10]. The specific parameters of simulation model are shown in Table 1.
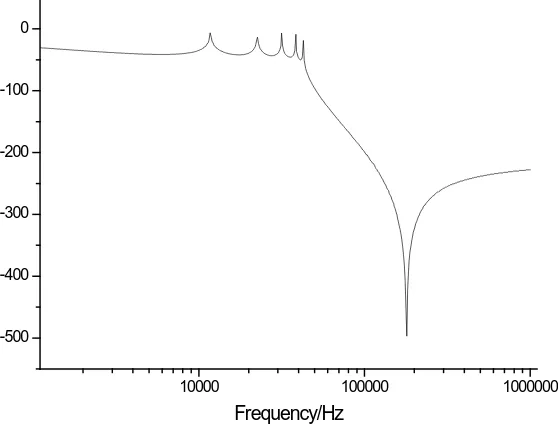
[image:2.595.150.450.310.392.2]PSPICE software was used for simulation. Sweep frequency mode is order of magnitude sweep. Scanning range is from 1 kHz to 1 MHz. Scanning point is 200 in each order of magnitude. Simulation result of normal transformer winding is shown in Figure 2.
Figure 1. Transformer winding equivalent diagram.
10000 100000 1000000
-500 -400 -300 -200 -100 0
[image:2.595.158.437.427.641.2]Frequency/Hz
Figure 2. Frequency response curve.
Table 1. Simulation parameters.
Parameter Li Ki Ci R1 R2
[image:2.595.153.440.685.720.2]Figure 2 shows that frequency response curve is an oscillating curve with troughs and peaks. There is a peak in the frequency response curve when series resonance occurs in the winding. And there is a trough when paral-lel resonance occurs. The change of model parameters will cause the change of corresponding peaks and troughs. Winding deformation can be distinguished by comparing frequency response curves before and after the change of parameters [11] [12].
3. Simulation with Current Source Method
All parameters are increased of 25% respectively to simulate different parts of winding deformation. The results show that the curves are the same when the same winding deformations occur in the winding symmetrically. So the repetitive curves are not shown. The abscissa of curve is frequency which is measured in Hz. The ordinate is frequency response amplitude. Dotted line is the image under normal conditions, and solid line is the image after changing parameters.
3.1. Simulation Results after Changing L
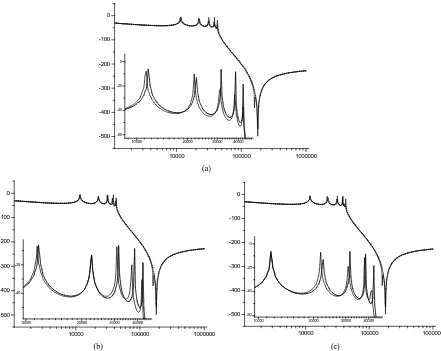
[image:3.595.91.532.351.702.2]Increase L and the frequency response curves are shown in Figure 3.
Figure 3 shows that peaks are offset to lower frequency and the response amplitudes are changed when the
winding inductance is increased in turn. The trough amplitude in high frequency is decreased. There is a new trough in the left of the original trough. Peaks that change obviously are different when changing inductance parameters of different positions. Change L1and peaks 1, 2, 3, 4 change large. Change L2 and peaks 1, 3, 4, 5 change large. Change L3 and peaks 2, 3, 4, 5 change large.
10000 100000 1000000
-500 -400 -300 -200 -100 0
10000 20000 30000 40000 -60
-40 -20 0
(a)
10000 100000 1000000
-500 -400 -300 -200 -100 0
10000 20000 30000 40000
-40 -20
10000 100000 1000000
-500 -400 -300 -200 -100 0
10000 20000 30000 40000
-60 -40 -20 0
(b) (c)
Similarly frequency response curves that L is decreased of 25% can also be made. How the change of L in-fluences frequency response curves is summarized in Table 2.
3.2. Simulation Results after Changing K
Increase K and the frequency response curves are shown in Figure 4.
Figure 4 shows that peaks are not offset basically when longitudinal capacitance is increased in turn. The
trough amplitude in high frequency is decreased. And there is a new trough in the left of the original trough. Peaks that change obviously are different when changing longitudinal capacitance of different positions. Change K1and peaks 4, 5 have a slight change. Change K2 and peaks 4, 5 change large. Change K3 and peak 4 has a slight change, peak 5 changes large.
Similarly frequency response curves that K is decreased of 25% can also be made. How the change of K in-fluences frequency response curves is summarized in Table 3.
3.3. Simulation Results after Changing C
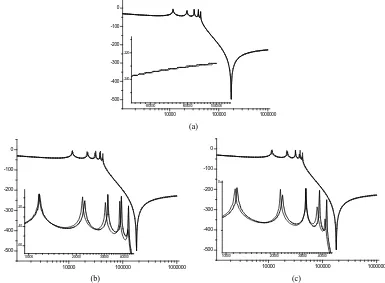
Increase C and the frequency response curves are shown in Figure 5.
Figure 5 shows that peaks are not offset basically when C1 is changed, but they are offset to lower frequency
when C2 or C3 is changed. Peaks that change obviously are different when changing C of different positions. Change C1 and peaks are unchanged basically. Change C2 and peaks 2, 3, 4, 5 change large. Change C3 and peaks 2, 4, 5 change large. The change of peak 5 is especially large when C2 or C3 changes.
Similarly frequency response curves that C is decreased of 25% can also be made. How the change of C in-fluences frequency response curves is summarized in Table 4.
The above simulation analysis shows that current source method can reflect the winding deformation type ef-fectively.
Table 2. Effect of L on the frequency response curve.
Change of L Differences Similarities
Increase
1) Peaks are offset to lower frequency. 2) A new trough appears in the left of the original trough.
1) Changes in low frequency are more obvious. 2) The trough amplitude in high frequency is decreased. 3) Peaks that change obviously are different when changing inductance parameters of different positions. But peaks change the same when changing inductance parameters of same positions, whether increase or decrease.
4) The curves are sensitive to the change of L. Decrease
1) Peaks are offset to higher frequency. 2) A new trough appears in the right of the original trough.
Table 3. Effect of K on the frequency response curve.
Change of K Differences Similarities
Increase A new trough appears in the left of the original trough.
1) Peaks are not offset basically.
2) Peaks that change obviously are different when changing longitudinal capacitance of different positions. But peaks change the same when changing longitudinal capacitance of same positions, whether increase or decrease. 3) The trough amplitude in high frequency is decreased.
4) Changes in medium frequency are more obvious. 5) The curves are less sensitive to the change of K. Decrease A new trough appears in the
right of the original trough.
Table 4. Effect of C on the frequency response curve.
Change of C Differences Similarities
Increase Peaks are offset to lower frequency when C2 or C3
changes. 1) Peaks are not offset basically when C1 is changed 2) Frequency response curves are sensitive to the change of C.
(a)
[image:5.595.105.498.85.370.2]
(b) (c)
Figure 4. Simulation results after increasing K. (a) Increase K1 for 25%, (b) Increase K2 for 25%, (c) Increase K3 for 25%.
10000 100000 1000000 -500
-400 -300 -200 -100 0
600000 800000 1000000 -240
-220
(a)
10000 100000 1000000
-500 -400 -300 -200 -100 0
10000 20000 30000 40000 -60
-40 -20
10000 100000 1000000
-500 -400 -300 -200 -100 0
10000 20000 30000 40000 0
(b) (c)
[image:5.595.104.489.410.693.2]4. Conclusions
1) The simulation results show that current source method can reflect the winding deformation types effec-tively, which lays the foundation for the realization of on-line monitoring and diagnosis of the transformer neu-tral directly grounded side winding.
2) Current source method can’t apply to on-line monitoring and diagnosis of the transformer delta connection winding. This method needs further study and discussion.
References
[1] Xie, Y.-P. and Zhang, C.-L. (2000) The Research for Checking the Deformation of the Transformer Coils by Using the Frequency Response Analysis Method. Inner Mongolia Electric Power, 18, 4-5.
[2] Tang, G. (2007) Frequency Response Analysis for Winding Deformation of Power Transformer. Xihua University.
[3] Arri, E. and Moeei, F. (1994) Status Assessment of Transformer Wingdings Via On-line Stray Inductance Measure-ment. IEEE Instrum. Meas. Technolgy. Conf IMTC94, Hamamatsu, May 1994, 1171-1174.
[4] Sun, G.-F. (2011) Frequency Response Mother On-Line Monitoring Transforme’s Winding Deformation. Electric Switchgear, 44, 13-15.
[5] He, Y.-Y. (1996) Discussion on the Domestic Power Transformer Ability to Withstand Short Circuit Problems. Trans-former, 33, 2-7.
[6] Wang, Y., Li, Y.-M. and Zhang C.-L. (1997) The Comparison Study on LVI and FRA Method of Detecting Winding Deformation Faults in Transformers. High Voltage Engineering, 23, 13-15.
[7] Vaessen, P.T. and Hanique, E.A. (1992) New Frequency Response Analysis Method for Power Transformers. IEEE Transaction on Power Delivery, 7, 384-391.
[8] Liu, H.-L. and Lei, X. (2011) A Detecting System for Transformer Winding Slight Deformation Based on Impulse Response Analysis. Electrical Measurement & Instrumentation, 48, 10-13.
[9] Islam, S.M. (2001) Detection of Shorted Turns and Winding Movements in Large Power Transformers Using Fre-quency Response Analysis. IEEE Engineering Society Winter Meeting, Singapore, 1.
[10] Moreau, O. and Gullloty, B. (1999) FRA Diagnosis Method Sunulation Applied to Feasibility Study and Efficiency Improvement. IEEE Engineering Society Winter Meeting, New York, 31 January-4 February 1999, 1059-1064. [11] Zhao, S.-S. (2008) Analysis of the Deformation Detecting Test of Power Transformer Winding and Its Simulation
Technology. Zhejiang University.