UCP2-induced fatty acid synthase promotes
NLRP3 inflammasome activation during sepsis
Jong-Seok Moon, … , Kiichi Nakahira, Augustine M.K. Choi
J Clin Invest.
2015;125(2):665-680. https://doi.org/10.1172/JCI78253.
Cellular lipid metabolism has been linked to immune responses; however, the precise
mechanisms by which de novo fatty acid synthesis can regulate inflammatory responses
remain unclear. The NLRP3 inflammasome serves as a platform for caspase-1–dependent
maturation and secretion of proinflammatory cytokines. Here, we demonstrated that the
mitochondrial uncoupling protein-2 (UCP2) regulates NLRP3-mediated caspase-1
activation through the stimulation of lipid synthesis in macrophages. UCP2-deficient mice
displayed improved survival in a mouse model of polymicrobial sepsis. Moreover, UCP2
expression was increased in human sepsis. Consistently, UCP2-deficient mice displayed
impaired lipid synthesis and decreased production of IL-1
b
and IL-18 in response to LPS
challenge. In macrophages, UCP2 deficiency suppressed NLRP3-mediated caspase-1
activation and NLRP3 expression associated with inhibition of lipid synthesis. In
UCP2-deficient macrophages, inhibition of lipid synthesis resulted from the downregulation of fatty
acid synthase (FASN), a key regulator of fatty acid synthesis. FASN inhibition by shRNA
and treatment with the chemical inhibitors C75 and cerulenin suppressed NLRP3-mediated
caspase-1 activation and inhibited NLRP3 and pro–IL-1
b
gene expression in macrophages.
In conclusion, our results suggest that UCP2 regulates the NLRP3 inflammasome by
inducing the lipid synthesis pathway in macrophages. These results identify UCP2 as a
potential therapeutic target in inflammatory diseases such as sepsis.
Research Article
Immunology
Find the latest version:
Introduction
Sepsis remains the leading cause of death in the medical inten-sive care unit (MICU) (1). Although inflammatory responses are important for host defense against invading microbes, excessive inflammation in sepsis can cause severe cell and tissue damage and organ dysfunction, leading to death (2). Our recent studies suggest that altered plasma metabolic profiles may reflect disease severity and predict mortality in critical illnesses such as sepsis (3, 4). Furthermore, we have shown that the plasma levels of proin-flammatory cytokines (e.g., IL-18) and circulating mitochondrial injury markers, such as mitochondrial DNA, increase in critical illness and are predictive of mortality (5, 6).
Emerging evidence suggests the involvement of inflam-masomes in the pathogenesis of human diseases, including sepsis (7). Inflammasomes are molecular platforms for the caspase-1– dependent maturation and secretion of proinflammatory cytokines such as IL-1β and IL-18 in immune cells (8). Cytoplasmic receptors of the nucleotide-binding domain leucine-rich repeat–contain-ing (NLR) family are key components of the inflammasome and
interact with apoptosis-associated adaptor protein (ASC), which recruits the precursor form of caspase-1 (7, 8). The NLRP3 (also known as cryopyrin or NALP3) inflammasome is unique in its abil-ity to recognize molecular patterns associated with host-derived metabolites, such as glucose or saturated fatty acids (9–13). Recent studies from our laboratory and others demonstrate that mitochon-drial dysfunction involving increased mitochonmitochon-drial ROS produc-tion (12, 13) and the release of mitochondrial DNA into the cytosol (14) are critical events associated with NLRP3 inflammasome acti-vation. However, recent studies have also suggested that NLRP3 inflammasome activation may occur independently of mitochon-drial damage and ROS production, a finding which warrants fur-ther investigation (15, 16). The integration of metabolic derange-ments, mitochondrial dysfunction, and inflammasome activation and their contribution to the pathogenesis of sepsis thus remain incompletely understood.
We hypothesized that metabolic regulation by mitochondria may represent a critical determinant of the pathogenesis of sep-sis. We therefore sought to study the effect of metabolic regula-tion on inflammatory responses by modulating the expression of mitochondrial uncoupling proteins (UCPs), a superfamily of mito-chondrial anion carrier proteins with previously identified roles in metabolic regulation (17–20). UCPs uncouple oxidative phos-Cellular lipid metabolism has been linked to immune responses; however, the precise mechanisms by which de novo fatty
acid synthesis can regulate inflammatory responses remain unclear. The NLRP3 inflammasome serves as a platform for caspase-1–dependent maturation and secretion of proinflammatory cytokines. Here, we demonstrated that the mitochondrial uncoupling protein-2 (UCP2) regulates NLRP3-mediated caspase-1 activation through the stimulation of lipid synthesis in macrophages. UCP2-deficient mice displayed improved survival in a mouse model of polymicrobial sepsis. Moreover, UCP2 expression was increased in human sepsis. Consistently, UCP2-deficient mice displayed impaired lipid synthesis and decreased production of IL-1β and IL-18 in response to LPS challenge. In macrophages, UCP2 deficiency suppressed NLRP3-mediated caspase-1 activation and NLRP3 expression associated with inhibition of lipid synthesis. In UCP2-deficient macrophages, inhibition of lipid synthesis resulted from the downregulation of fatty acid synthase (FASN), a key regulator of fatty acid synthesis. FASN inhibition by shRNA and treatment with the chemical inhibitors C75 and cerulenin suppressed NLRP3-mediated caspase-1 activation and inhibited NLRP3 and pro–IL-1β gene expression in macrophages. In conclusion, our results suggest that UCP2 regulates the NLRP3 inflammasome by inducing the lipid synthesis pathway in macrophages. These results identify UCP2 as a potential therapeutic target in inflammatory diseases such as sepsis.
UCP2-induced fatty acid synthase promotes NLRP3
inflammasome activation during sepsis
Jong-Seok Moon,1,2 Seonmin Lee,3,4 Mi-Ae Park,5 Ilias I. Siempos,1,2,6 Maria Haslip,7 Patty J. Lee,7 Mijin Yun,3,8 Chun K. Kim,5 Judie Howrylak,9 Stefan W. Ryter,1,2 Kiichi Nakahira,1,2 and Augustine M.K. Choi1,2
1Joan and Sanford I. Weill Department of Medicine, Weill Cornell Medical College, and New York-Presbyterian Hospital, New York, New York, USA. 2Division of Pulmonary and Critical Care Medicine,
Weill Cornell Medical College, New York, New York, USA. 3Division of Pulmonary and Critical Care Medicine, Brigham and Women’s Hospital (BWH), Harvard Medical School, Boston, Massachusetts, USA. 4Division of Pulmonary and Critical Care Medicine, Samsung Medical Center, Sungkyunkwan University School of Medicine, Seoul, Republic of Korea. 5Department of Radiology, BWH,
Harvard Medical School, Boston, Massachusetts, USA. 6Department of Critical Care Medicine and Pulmonary Services, Evangelismos Hospital, University of Athens Medical School, Athens, Greece. 7Department of Internal Medicine, Section of Pulmonary, Critical Care and Sleep Medicine, Yale School of Medicine, New Haven, Connecticut, USA. 8Department of Nuclear Medicine,
Yonsei University College of Medicine, Seoul, Republic of Korea. 9Division of Pulmonary and Critical Care Medicine, Penn State College of Medicine, Hershey, Pennsylvania, USA.
Conflict of interest: The authors have declared that no conflict of interests exists. Submitted: July 29, 2014; Accepted: December 9, 2014.
The Journal of Clinical Investigation
R e s e a R c h a R t i c l estrated in various cells in which UCP2 is highly expressed (23–28). Moreover, UCP2 affects the metabolic response to fasting in mice by regulating the expression of lipid regulatory enzymes and transcription factors (29). These observations suggest that UCP2 exerts a central role in cellular metabolism.
Among the metabolic processes potentially influenced by mitochondrial dysfunction, de novo fatty acid synthesis is tightly regulated by key enzymes, including fatty acid synthase (FASN) (30). FASN and related enzymes are found upregulated in many cancer cells and associated with oncogenic progression (31–34). phorylation from ATP synthesis with energy dissipated as heat, a
process referred to as the mitochondrial proton leak (17–20). Of these, UCP1 was originally identified as a protein responsible for thermogenesis in brown adipose tissue; whereas UCP2, its cellular homolog, with weak uncoupling activity, appears predominantly in cells of the innate immune system (17, 18). Although the physio-logical function of UCP2 remains incompletely understood, a role for UCP2 in regulating cellular energy homeostasis and glucose metabolism has been demonstrated in various cell types (21–29). Modulation of the glycolytic phenotype by UCP2 has been
demon-Figure 1. Deficiency of UCP2 protects against CLP-induced mortality in vivo. (A) Immunoblot analysis of UCP2 and voltage-dependent anion channel (VDAC) in lung tissues from wild-type mice 8 and 24 hours after CLP or sham laparotomy. β-Actin served as the standard. *P < 0.05, ANOVA. (B) ELISA assay for IL-1β, IL-18, and TNF in the sera and (C) in the lung tissues from Ucp2+/+ or Ucp2–/– mice 24 hours after CLP or sham laparotomy. For both Ucp2+/+
and Ucp2–/– mice, sham, n = 2, and CLP, n = 8. *P < 0.05, **P < 0.01, ANOVA. (D) Organ dysfunction of CLP was determined in Ucp2+/+ or Ucp2–/– mice 24
hours after CLP or sham laparotomy. Organ dysfunction biomarkers, including creatinine, aspartate aminotransferase (AST), and alanine aminotransferase (ALT), were measured in sera. For both Ucp2+/+ and Ucp2–/– mice, sham, n = 2, and CLP, n = 8. *P < 0.05, ANOVA. (E) Survival curve of CLP was determined
in Ucp2+/+ or Ucp2–/– mice. Ucp2+/+, n = 16; Ucp2–/–, n = 29. ***P < 0.0055, log-rank test. (F) Box plots comparing measures of UCP2 mRNA levels in
[image:3.585.41.535.51.502.2]Activation of FASN can promote glu-cose-dependent fatty acid synthesis, illustrating that glucose utilization is coregulated with lipogenesis (30, 33, 35). Recent studies suggest that cellu-lar fatty acid synthesis (e.g., synthesis of triglycerides [TGs] and cholesteryl esters) is activated during inflam-mation (36–38). Fatty acid synthesis has also been implicated in the acti-vation of dendritic cells (39) and the differentiation of B lymphocytes and human monocytes (40, 41). Obesity- induced danger signals, such as free fatty acids, can activate the NLRP3 inflammasome and the downstream production of IL-1β in adipose tissue of patients with type 2 diabetes and in mice fed with a high-fat diet (42, 43). The role of cellular fatty acid synthesis in macrophages during inflammation currently remains unclear. We hypo-thesized that upregulation of FASN- dependent lipid synthesis by UCP2 reg-ulates inflammation in sepsis through NLRP3 inflammasome activation.
In the current study, we show that UCP2-deficient mice displayed improved survival in a mouse model of polymicrobial sepsis and that UCP2 expression was increased in human sepsis. Consistent with these results, UCP2-deficient mice dis-played reduced lipid synthesis and production of IL-1β and IL-18 in vivo and in vitro. Importantly, we
demon-Figure 2. Deficiency of UCP2 inhibits lipid production through glucose uptake in vivo. (A) TG production in the lungs, livers, and sera from LysM-Cre/Ucp2+/+
or LysM-Cre/Ucp2fl/fl mice after
injec-tion of LPS for 4 hours (10 mg/kg, i.p.).
n = 3 per group, *P < 0.05, ANOVA. (B) Transverse SUV of PET/CT imaging using 18F-FDG of lungs from LysM-Cre/Ucp2+/+ or
LysM-Cre/Ucp2fl/fl mice after injection of
LPS for 4 hours (10 mg/kg, i.p.). Represen-tative image of 3 independent experiments. Original magnification, ×2. (C) Quantifica-tion of transverse SUV in PET/CT imaging from B. n = 3 per group, **P < 0.01, ANOVA. (D) Ex vivo γ-ray counting using 18F-FDG of lungs and livers from LysM-Cre/Ucp2+/+
or LysM-Cre/Ucp2fl/fl mice after injection
[image:4.585.47.390.57.707.2]The Journal of Clinical Investigation
R e s e a R c h a R t i c l e(Figure 1A). To evaluate the role of UCP2 in the inflammatory response to CLP, we analyzed the serum levels of the proinflam-matory cytokines IL-1β, IL-18, and TNF in Ucp2+/+ and Ucp2–/– mice
24 hours after CLP relative to those in the corresponding control mice subjected to sham surgery. The serum levels of IL-1β, IL-18, and TNF were markedly elevated in Ucp2+/+ mice after CLP
com-pared with those in sham-operated control mice. In contrast, the serum levels of IL-1β and IL-18 were significantly decreased in Ucp2–/– mice after CLP relative to those in Ucp2+/+ mice, whereas
TNF levels were comparable between Ucp2+/+ and Ucp2–/– mice
(Figure 1B). Similar to serum levels, the levels of IL-1β and IL-18 in lung tissues after CLP were significantly decreased in Ucp2–/–
mice compared with those in Ucp2+/+ mice, whereas TNF levels
were comparable between Ucp2+/+ and Ucp2–/– mice (Figure 1C).
We also analyzed organ dysfunction by measurement of biochem-ical indicators of organ function in the serum. We observed that the levels of creatinine (an indicator of renal dysfunction) and aspartate aminotransferase and alanine aminotransferase (indi-cators of hepatic dysfunction) were increased in Ucp2+/+ mice after
CLP compared with those in sham-operated control mice. Con-sistent with cytokine levels, Ucp2–/– mice displayed reduced organ
strated that UCP2 regulates NLRP3 inflammasome–mediated caspase-1 activation by upregulating FASN-dependent lipid syn-thesis in macrophages. The pharmacologic and genetic inhibition of FASN suppressed NLRP3-mediated caspase-1 activation by downregulation of NLRP3 and IL-1β expression. Our results sug-gest that UCP2 is a propathogenic mediator in sepsis, whereby UCP2 regulates NLRP3-mediated caspase-1 activation through lipid synthesis (see Supplemental Figure 1 for a summary of the overall study; supplemental material available online with this article; doi:10.1172/JCI78253DS1).
Results
[image:5.585.45.538.54.368.2]UCP2 promotes mortality in experimental sepsis and is upregulated in human sepsis. We first investigated the functional role of UCP2 in the inflammatory response using cecal ligation and puncture (CLP), a clinically relevant murine model of polymicrobial sepsis. The expression of UCP2 was significantly increased in the lungs of mice at 8 hours after CLP relative to that in sham-operated control mice and remained elevated for up to 24 hours after CLP. In con-trast, the expression of voltage-dependent anion channel (VDAC), an outer mitochondrial membrane protein, was not changed
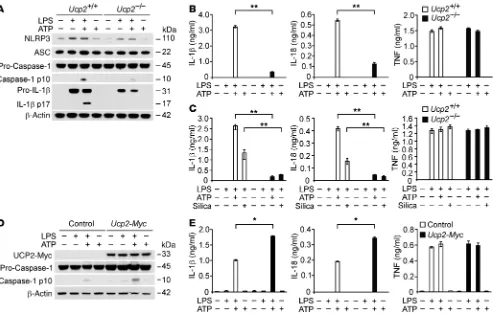
Figure 3. UCP2 regulates NLRP3-mediated caspase-1 activation by NLRP3 and IL-1β induction in macrophages. (A) Immunoblot analysis for caspase-1 and IL-1β of cell lysates from Ucp2+/+ or Ucp2–/– BMDMs treated with LPS (500 ng/ml) for 4 hours, followed by incubation with ATP (2 mM) for 30 minutes.
β-Actin served as the standard. (B) Luminex assay and ELISA assay for IL-1β, IL-18, and TNF secretion in the media from A. **P < 0.01, ANOVA. (C) ELISA assay for IL-1β, IL-18, and TNF secretion in the supernatants from Ucp2+/+ or Ucp2–/– BMDMs treated with LPS (500 ng/ml) for 4 hours, followed by
cantly decreased in LysM-Cre/Ucp2fl/fl mice
relative to those in LysM-Cre/Ucp2+/+ mice
(Figure 2A). Next, to confirm that LPS- induced TG synthesis was associated with glucose utilization, we measured glucose uptake using 18F-fluoro-2-deoxyglucose (18F-FDG) in mice treated with LPS. The uptake of 18F-FDG in mouse organs was measured using positron emission tomog-raphy/computerized tomography (PET/ CT) imaging and ex vivo γ-ray counting in tissue sections of LysM-Cre/Ucp2+/+
and LysM-Cre/Ucp2fl/fl mice. The uptake
of 18F-FDG in mouse organs was imaged using a micro-PET scanner for 20 minutes, and then the anatomical localization of the lung and liver was imaged using a CT scan-ner. The analysis of 18F-FDG uptake was performed using a combination of whole-body CT images and standard uptake val-ues (SUVs) from PET imaging. Consistent with the observed increases in TG synthe-sis, LPS treatment increased the uptake of 18F-FDG in LysM-Cre/Ucp2+/+ mice 4 hours
after LPS injection, as detected in trans-verse PET/CT imaging of the lungs. In contrast, the lung uptake of 18F-FDG in LysM-Cre/Ucp2fl/fl mice was decreased compared
with that in LysM-Cre/Ucp2+/+ mice (Figure 2, B and C). In
cor-onal PET/CT imaging, the uptake of 18F-FDG was reduced in the lungs and livers in LysM-Cre/Ucp2fl/fl mice relative to that in
LysM-Cre/Ucp2+/+ mice after LPS treatment (Supplemental
Fig-ure 2). To confirm the results of PET/CT imaging, we measFig-ured the uptake of 18F-FDG in tissue sections using ex vivo γ-ray count-ing. Consistent with results observed in PET/CT imaging, ex vivo
γ-ray counting revealed increased uptake of 18F-FDG in the lungs and livers of LysM-Cre/Ucp2+/+ mice after LPS treatment (Figure
2D). The levels of glucose uptake in LysM-Cre/Ucp2fl/fl mice were
decreased in the lungs and livers after LPS treatment compared with those in LysM-Cre/Ucp2+/+ mice (Figure 2D). These results
indicate that UCP2 regulates lipid synthesis, which is correlated with glucose utilization in tissues in response to LPS challenge in vivo. Next, we investigated whether lipid synthesis was asso-ciated with serum levels of IL-1β and IL-18 in LysM-Cre/Ucp2+/+
mice. Consistent with reduced TG levels and glucose utilization, the serum levels of IL-1β and IL-18 were significantly suppressed in LysM-Cre/Ucp2fl/fl mice relative to those in LysM-Cre/Ucp2+/+
mice, whereas TNF production was unchanged (Figure 2E). These results suggest that UCP2 regulates de novo lipid synthesis, which was associated with glucose utilization and the production of IL-1β and IL-18 in vivo.
UCP2 regulates NLRP3 expression and caspase-1 activation in macrophages. UCP2 deficiency and corresponding metabolic changes were associated with altered regulation of inflammasom-e-associated cytokines in vivo. Therefore, we investigated whether UCP2 regulates the production of IL-1β and IL-18 in macrophages through NLRP3-dependent caspase-1 activation. We used an established model of NLRP3 inflammasome–mediated caspase-1 dysfunction relative to Ucp2+/+ mice (Figure 1D). Importantly, we
observed that Ucp2–/– mice were more resistant to CLP-induced
mortality than Ucp2+/+ mice. At 7 days after CLP, 75% of Ucp2+/+
mice had died, whereas 70% of Ucp2–/– mice survived longer than
12 days (Figure 1E). These results demonstrate improved survival of Ucp2–/– mice in the CLP model. Next, to correlate our findings in
mice to patients with sepsis, we analyzed the mRNA level of UCP2 in leukocytes from patients admitted to the MICU. We observed that UCP2 mRNA levels of leukocytes from the whole blood of patients with sepsis were significantly increased (P = 0.029) com-pared with those of control patients admitted to the MICU without sepsis (see Methods for selection criteria, Figure 1F and Supple-mental Table 1). Taken together, these results suggest that UCP2 is a critical mediator in the pathogenesis of sepsis.
UCP2 deficiency suppresses lipid synthesis and cytokine produc-tion in vivo. The accumulaproduc-tion of lipid metabolites has been asso-ciated with systemic inflammation in mice and humans (37, 38). Moreover, alterations in glucose metabolism, including glucose consumption and glycolysis, have been linked to cytokine produc-tion in immune cells (7, 9, 39). We investigated whether UCP2 can act as a critical regulator of cellular metabolism as it relates to the activation of inflammation. Since UCP2 functions in cellular met-abolic regulation (25–28), we investigated whether UCP2 can reg-ulate lipid synthesis in response to LPS challenge in vivo. We first measured the levels of TGs, a final product in the lipid synthesis pathway, in the lung and liver tissues of mice with a myeloid cell– specific deletion of UCP2 (LysM-Cre/Ucp2fl/fl mice) in response
to LPS challenge. LPS treatment increased TG levels in the lungs and livers of LysM-Cre/Ucp2+/+ mice (Figure 2A). Consistent with
elevated TG levels in tissues, LPS treatment also increased TG levels in the sera of LysM-Cre/Ucp2+/+ mice (Figure 2A). In
con-trast, the levels of TGs in the lungs, livers, and sera were
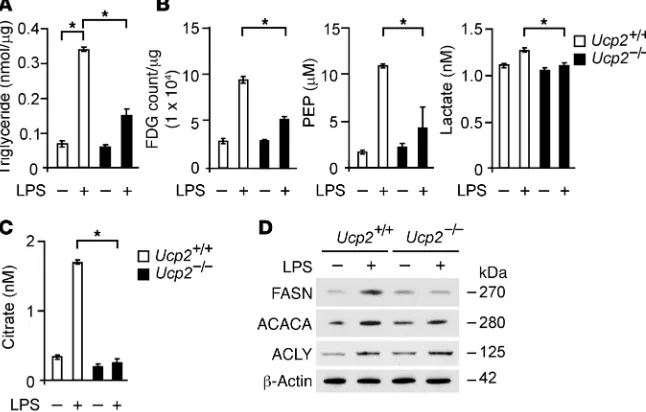
signifi-Figure 4. UCP2 regulates lipid synthesis via FASN in macrophages. (A) TGs in Ucp2+/+ or Ucp2–/–
BMDMs treated with LPS (500 ng/ml) for 4 hours. *P < 0.05, ANOVA. (B) 18F-FDG uptake and PEP and lactate production in Ucp2+/+ or Ucp2–/– BMDMs treated with LPS (500 ng/ml) for 4 hours. *P < 0.05,
ANOVA. (C) Citrate production in Ucp2+/+ or Ucp2–/– BMDMs treated with LPS (500 ng/ml) for 4 hours.
*P < 0.05, ANOVA. (D) Immunoblot analysis for FASN, ACACA, and ACLY in cell lysates from Ucp2+/+ or
[image:6.585.47.370.59.265.2]The Journal of Clinical Investigation
R e s e a R c h a R t i c l eactivation in vitro, the stimulation of LPS-primed macrophages with ATP treatment. We analyzed caspase-1 activation in bone marrow–derived macrophages (BMDMs) isolated from Ucp2–/–
mice or corresponding wild-type (Ucp2+/+) mice. Ucp2–/– BMDMs
displayed reduced expression of cleaved caspase-1 and cleaved IL-1β in response to LPS and ATP, relative to Ucp2+/+ BMDMs
(Fig-ure 3A). Ucp2–/– BMDMs displayed reduced protein induction of
pro–IL-1β in response to LPS. Importantly, Ucp2–/– BMDMs also
displayed reduced protein expression of NLRP3 in response to LPS compared with Ucp2+/+ BMDMs. Consistent with protein levels,
UCP2 deficiency significantly reduced Nlrp3 gene expression (Sup-plemental Figure 3). In contrast to NLRP3, the expression of ASC and pro–caspase-1 was unchanged in Ucp2–/– BMDMs (Figure 3A).
Moreover, IL-1β and IL-18 secretion was significantly decreased in Ucp2–/– BMDMs relative to that in Ucp2+/+ BMDMs, while TNF
secre-tion was comparable in both Ucp2+/+ and Ucp2–/– BMDMs (Figure
3B). Additionally, we tested the role of UCP2 in modulating inflam-masome responses to other stimuli. Ucp2–/– BMDMs displayed
reduced IL-1β and IL-18 secretion in response to treatment with silica, an alternative NLRP3 inflammasome activator, relative to Ucp2+/+ BMDMs, while the secretion of TNF was comparable in both
Ucp2+/+ and Ucp2–/– BMDMs (Figure 3C). Next, we overexpressed
UCP2 in J774A.1 macrophages and validated the expression levels by Western immunoblot analysis (Figure 3D). Overexpression of UCP2 in J774A.1 macrophages increased caspase-1 activation in response to LPS and ATP compared with control-transfected cells (Figure 3D). Moreover, overexpression of UCP2 increased IL-1β
and IL-18 secretion in response to LPS and ATP, while the secretion of TNF was not changed (Figure 3E). Next, we analyzed whether UCP2 can regulate caspase-1 activation in response to LPS and poly(dA:dT) treatment, which activates the absent in melanoma 2 (AIM2) inflammasome pathway. Unlike NLRP3-mediated
cas-pase-1 activation in Ucp2–/– BMDMs, the expression of AIM2 and
cleaved caspase-1 was unchanged in Ucp2–/– and Ucp2+/+ BMDMs in
response to LPS and poly(dA:dT) treatment (Supplemental Figure 4), suggesting that the AIM2 inflammasome pathway is not regu-lated by UCP2. Overall, our results suggest that UCP2 regulates NLRP3-mediated caspase-1 activation as well as the production of NLRP3 and pro–IL-1β in macrophages.
UCP2 regulates glucose utilization and de novo lipid synthesis in macrophages. UCP2 deficiency was associated with metabolic changes in vivo, including reduced glucose utilization and TG synthesis (Figure 2). De novo fatty acid synthesis is known to require glucose (30, 32–34). We next evaluated the role of UCP2 in de novo lipid synthesis and associated changes in glucose metabolism in vitro. We first measured TG synthesis in BMDMs isolated from Ucp2–/– or Ucp2+/+ mice. Similar to reduced TG levels
observed in the lungs, livers, and sera of Ucp2–/– mice (Figure 2A),
Ucp2–/– BMDMs displayed less TG synthesis in response to LPS
relative to that of Ucp2+/+ BMDMs (Figure 4A). Next, to examine
whether LPS-induced TG synthesis was associated with glucose utilization in vitro, we measured glucose utilization using 18F-FDG and the production of glycolytic metabolites in Ucp2–/– BMDMs in
response to LPS. Consistent with reduced TG synthesis, Ucp2–/–
BMDMs displayed less 18F-FDG uptake compared with Ucp2+/+
BMDMs (Figure 4B). Furthermore, the production of phosphoe-nolpyruvate (PEP) and lactate (Figure 4B) and citrate (Figure 4C), representative metabolites in glycolysis and the tricarboxylic acid cycle, respectively, was significantly suppressed in Ucp2–/– BMDMs
relative to that in Ucp2+/+ BMDMs. Similar to results obtained in
BMDMs, TG synthesis (Supplemental Figure 5A) and the produc-tion of PEP, lactate, and citrate (Supplemental Figure 5, B and C) were significantly suppressed in Ucp2–/– peritoneal macrophages in
[image:7.585.77.505.53.280.2]Although glucose utilization and production of glycolytic metabolites was suppressed in Ucp2–/– BMDMs compared with
that in Ucp2+/+ BMDMs, the expression of the glucose
trans-porter-1 (GLUT1) was comparable between Ucp2–/– and Ucp2+/+
BMDMs (Supplemental Figure 6). These results suggest that UCP2 regulates de novo lipid synthesis in macrophages through modulation of glycolysis.
UCP2 regulates lipid synthesis through FASN in macrophages. We next investigated the molecular mechanism by which lipid synthesis is regulated by UCP2 in macrophages. Since UCP2 can regulate the lipid metabolic response to fasting in mice through the expression of key lipid regulatory enzymes (29, 33), we analyzed whether UCP2 regulates lipogenic enzymes in the lipid synthesis pathway in macrophages. Lipid synthesis is regulated by the expression of key lipogenic enzymes, includ-ing FASN, acetyl-CoA carboxylase (ACACA), and ATP citrate lyase (ACLY). We analyzed the expression of FASN, ACACA, and ACLY in Ucp2–/– BMDMs in response to LPS. The expression
of FASN, ACACA, and ACLY was increased in Ucp2+/+ BMDMs
in response to LPS (Figure 4D). In contrast, Ucp2–/– BMDMs
displayed markedly reduced FASN induction compared with Ucp2+/+ BMDMs, while the expression of ACACA was partially
reduced and the expression of ACLY was unchanged (Figure 4D). Consistent with results obtained in BMDMs, the induction of FASN was markedly suppressed in Ucp2–/– peritoneal
macro-phages in response to LPS relative to Ucp2+/+ peritoneal
macro-phages (Supplemental Figure 5D). These results suggest that UCP2 regulates lipid synthesis via FASN in macrophages.
FASN regulates NLRP3 expression in macrophages. FASN, a critical lipogenic enzyme that promotes glucose-dependent fatty acid synthesis (30, 33, 35), was preferentially downregulated in Ucp2–/– BMDMs and peritoneal macrophages, in association with
inhibition of the inflammatory response. We therefore sought to investigate the role of FASN in NLRP3 regulation in macrophages. We analyzed whether deficiency of FASN could suppress NLRP3 expression in response to proinflammatory stimuli. Genetic dele-tion of FASN results in early embryonic lethality (44), preclud-ing the use of Fasn–/– mice in the current study. Hence, we used
3 independent shRNA lentiviral constructs against mouse Fasn to knockdown FASN in wild-type peritoneal macrophages. The protein expression of NLRP3 in response to LPS stimulation was suppressed by Fasn shRNA transduction relative to control shRNA transduction (Figure 5A). Moreover, knockdown of FASN sup-pressed the protein expression of pro–IL-1β (Figure 5A). Consis-tent with the results observed in Ucp2–/– BMDMs, knockdown of
[image:8.585.44.393.55.410.2]FASN significantly suppressed the production of TGs compared with control (Figure 5B). Similarly, knockdown of FASN reduced the production of PEP, citrate, and lactate in response to LPS rel-ative to control, as previously reported (ref. 31 and Figure 5C). Consistent with the results in peritoneal macrophages, the protein
Figure 6. FASN regulates NLRP3 and IL-1β
The Journal of Clinical Investigation
R e s e a R c h a R t i c l eSince FASN activity is known to modulate AKT activation in cancer cells (45), we investigated whether inhibition of FASN activity by C75 can suppress NLRP3 expression through AKT in macrophages. First, we analyzed the phosphorylation of AKT on Ser473 in wild-type BMDMs treated with C75 prior to LPS stim-ulation. C75 suppressed the phosphorylation of AKT on Ser473 in response to LPS treatment, relative to vehicle control (Figure 6D). Similarly, C75 suppressed the phosphorylation of AKT on Ser473 in a dose-dependent manner (Figure 6E). Moreover, TLR agonist-induced AKT activation was suppressed by C75 com-pared with vehicle control (Supplemental Figure 8B). Consistent with inhibition of AKT activation by C75, knockdown of FASN by Fasn shRNA suppressed AKT activation relative to control shRNA transduction in wild-type peritoneal macrophages (Fig-ure 6F). Similarly, cerulenin suppressed the phosphorylation of AKT on Ser473 in a dose-dependent manner (Supplemental Fig-ure 9E). Consistent with Fasn shRNA transduction, knockdown of FASN by Fasn-specific siRNA suppressed AKT activation rela-tive to control siRNA transfection in J774A.1 macrophages (Sup-plemental Figure 9F).
Next, to evaluate the role of AKT activation in the regulation of NLRP3 expression, we examined whether inhibition of AKT by BX795, a selective AKT inhibitor, could suppress NLRP3 expres-sion in macrophages in response to LPS (Figure 6G). Pretreatment of BMDMs with BX795 prior to LPS stimulation resulted in reduced NLRP3 expression in response to LPS. Moreover, BX795 also sup-pressed the protein expression of pro–IL-1β and phosphorylation of AKT on Ser473 in response to LPS (Figure 6G). These results sug-gest that FASN regulates NLRP3 expression via AKT activation.
FASN regulates the transcription of NLRP3 and IL-1β in macro-phages through p38 MAPK. We investigated the molecular mecha-nism by which the induction of NLRP3 and pro–IL-1β is regulated by FASN in macrophages. Since AKT signaling is involved in the regulation of NLRP3 by FASN (Figure 6), we examined whether expression of NLRP3 and pro–IL-1β in response to LPS stimulation
was suppressed by Fasn-specific siRNA transfection relative to con-trol siRNA transfection in J774A.1 macrophages. The production of TG, PEP, citrate, and lactate in response to LPS was reduced by FASN knockdown in J774A.1 macrophages (Supplemental Figure 7). These results support that FASN promotes glucose-dependent lipid synthesis in macrophages. Taken together, these results sug-gest that FASN regulates NLRP3 expression in macrophages.
[image:9.585.45.539.54.246.2]FASN activity regulates NLRP3 expression via AKT activation in macrophages. To validate the functional role of FASN in the regu-lation of NLRP3 expression, we examined whether inhibition of FASN activity by C75, a selective inhibitor of FASN (31, 33), could inhibit the expression of NLRP3 in macrophages in response to LPS. We analyzed the protein induction of NLRP3 in wild-type BMDMs treated with C75. Pretreatment with C75 dose dependently sup-pressed the protein expression of NLRP3 and pro–IL-1β in wild-type BMDMs in response to LPS (Figure 6A). Consistent with FASN downregulation, C75 dose dependently reduced TG synthe-sis in wild-type BMDMs (Figure 6B). Similarly, C75 suppressed the production of PEP, citrate, and lactate in response to LPS relative to vehicle control (Figure 6C). Furthermore, C75 suppressed NLRP3 and pro–IL-1β expression in wild-type BMDMs after stimulation with alternate TLR ligands (Supplemental Figure 8A). Consistent with the results in wild-type BMDMs, C75 dose dependently sup-pressed the protein expression of NLRP3 and pro–IL-1β in wild-type peritoneal macrophages in response to LPS compared with vehicle control (Supplemental Figure 9A). Consistent with C75 treatment, cerulenin, another selective inhibitor of FASN (31, 33), dose dependently suppressed the protein expression of NLRP3 and pro–IL-1β in wild-type peritoneal macrophages in response to LPS compared with vehicle control (Supplemental Figure 9B). Similar to C75 treatment, cerulenin significantly suppressed TG synthesis and the production of PEP, citrate, and lactate in response to LPS relative to vehicle control (Supplemental Figure 9, C and D).
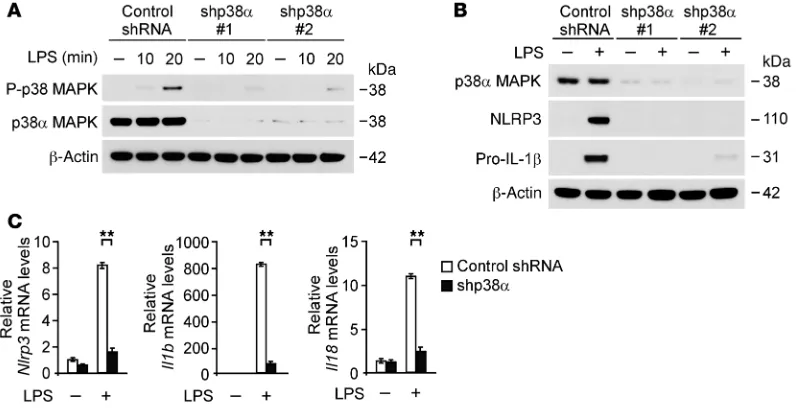
p38α MAPK in wild-type peritoneal macrophages. The activation of p38 MAPK in response to LPS and p38 MAPK expres-sion was markedly sup-pressed by p38α shRNA compared with control shRNA transduction in wild-type peritoneal mac-rophages (Figure 8A). Consistent with knock-down of FASN, transduc-tion with p38α shRNA markedly reduced the protein expression of NLRP3 and pro–IL-1β
relative to control shRNA transduction (Figure 8B). Next, to examine the role of p38 MAPK in the gene expression of NLRP3 and pro–IL-1β, we ana-lyzed the mRNA levels of Nlrp3, Il1b, and Il18 in wild-type peritoneal macrophages. Similar to protein expression, knockdown of p38 MAPK markedly reduced Nlrp3, Il1b, and Il18 gene expression in response to LPS compared with control shRNA transduction (Fig-ure 8C). Unlike Il1b and Il18 gene expression, gene expression of Tnf was significantly reduced by knockdown of p38 MAPK during the early response to LPS stimulation, whereas it was comparable with control conditions at 4 hours after LPS stimulation (Supple-mental Figure 12, A and B). In contrast, gene expression of Il12 was unchanged by knockdown of p38 MAPK (Supplemental Figure 12B). Moreover, we evaluated the role of LPS-induced p38 MAPK activation in the transcription of NLRP3, pro–IL-1β, and other cytokine genes. We analyzed the mRNA levels of Nlrp3, Il1b, Il18, and Tnf in wild-type BMDMs using LPS in the absence or presence of SB203580, a potent inhibitor of p38 MAPK activation; U0126, a potent inhibitor of ERK activation; and SP600125, a potent inhib-itor of JNK activation. SB203580 significantly suppressed Nlrp3, Il1b, and Il18 gene expression in response to LPS compared with vehicle control, while gene expression of Tnf was unchanged. In contrast, U0126 partially suppressed Il1b gene expression relative to vehicle control, while Nlrp3, Il18, and Tnf mRNA levels were unchanged. SP600125 did not affect the transcription of Nlrp3, Il1b, Il18, and Tnf genes in response to LPS compared with vehi-cle control (Figure 9A). Consistent with mRNA levels, SB203580 markedly suppressed the protein expression of NLRP3 and pro– IL-1β (Figure 9B). In contrast, U0126 partially reduced protein expression of pro–IL-1β, while that of NLRP3 was comparable. SP600125 did not inhibit the protein expression of NLRP3 and pro–IL-1β (Figure 9B). These results suggest that FASN regulates the transcription of NLRP3 through the p38 MAPK signaling path-way and FASN regulates the transcription of pro–IL-1β through the p38 MAPK and ERK1/2 MAPK signaling pathway in macrophages. deficiency of FASN can regulate the expression of NLRP3 and
pro–IL-1β through AKT-dependent transcription in macrophages. We first analyzed the mRNA levels of Nlrp3, Il1b, Il18, Tnf, and Il12 in wild-type peritoneal macrophages in response to LPS. Trans-duction with Fasn shRNA markedly reduced Nlrp3, Il1b, and Il18 gene expression in response to LPS compared with control shRNA transduction, while gene expression of Tnf and Il12 was unchanged (Figure 7A). Similar to transduction with Fasn shRNA, knockdown of FASN by Fasn-specific siRNA markedly reduced Nlrp3, Il1b, and Il18 gene expression in response to LPS compared with con-trol siRNA transfection in J774A.1 macrophages, while Tnf gene expression was unchanged (Supplemental Figure 10A).
Next, to examine whether deficiency of FASN can affect sig-naling pathways downstream of AKT, we analyzed the effects of FASN knockdown on the activation of MAPKs, including p38 MAPK, ERK, and JNK in wild-type peritoneal macrophages. Fasn shRNA transduction suppressed the activation of p38 MAPK and ERK relative to control shRNA, while the activation of JNK was unchanged (Figure 7B). Similarly, knockdown of FASN by Fasn-specific siRNA markedly suppressed the activation of p38 MAPK compared with control siRNA transfection in J774A.1 macrophages (Supplemental Figure 10B). Consistent with FASN knockdown, inhibition of AKT by BX795 treatment suppressed the activation of p38 MAPK compared with vehicle control (Sup-plemental Figure 11). Since the activation of p38 MAPK was mark-edly suppressed by FASN knockdown (Figure 7B), we analyzed the role of p38 MAPK in the transcription of NLRP3 and pro–IL-1β in wild-type peritoneal macrophages.
[image:10.585.45.443.56.260.2]Since the p38α isoform, among the p38 MAPK isoforms, is the most abundant in inflammatory cells (46), we used 2 independent shRNA lentiviral constructs against mouse p38α to knockdown
The Journal of Clinical Investigation
R e s e a R c h a R t i c l ein response to LPS relative to vehicle control in wild-type BMDMs (Supplemental Figure 13C). Moreover, IL-1β and IL-18 secretion was also significantly decreased by C75 in response to LPS and ATP rela-tive to vehicle control (Supplemental Figure 13D). Collecrela-tively, these results suggest that FASN is required for NLRP3 inflammasome– dependent caspase-1 activation as well as IL-1β and IL-18 secretion.
Inhibition of FASN by C75 suppresses the production of IL-1β and IL-18 in vivo. Finally, we investigated the role of FASN activity in the production of IL-1β and IL-18 in vivo. We measured the sera levels of IL-1β and IL-18 in wild-type mice treated with C75 prior to LPS injection. C75 significantly reduced the sera levels of IL-1β
and IL-18 (Figure 11A) and TGs (Figure 11B) in response to LPS, relative to vehicle control. Similarly, cerulenin also reduced the sera levels of IL-1β and IL-18 (Figure 11C) and TGs (Figure 11D) in response to LPS, relative to vehicle control. Consistently, LPS induced lipid accumulation in the liver was inhibited by C75 (Fig-ure 11E). These results suggest that the activity of FASN is required for IL-1β and IL-18 production in vivo.
Discussion
In this study, we demonstrate the physiological relevance of the mitochondrial protein UCP2 in mediating inflammatory responses in two animal models of sepsis: the endotoxin shock model and the CLP model of polymicrobial sepsis. Furthermore, increased UCP2 mRNA expression was observed in the blood of human sepsis patients.
We have shown that UCP2 acts as a critical regulator of glucose-dependent de novo lipid synthesis in vivo and in vitro. We describe a molecular mechanism whereby FASN, a criti-cal lipogenic enzyme that converts glycolytic carbon flux into lipid biosynthesis, serves as a downstream target molecule of UCP2-dependent glucose regulation. We show that UCP2- dependent lipid synthesis under the regulation of FASN is critical for both NLRP3-mediated caspase-1 activation and the regula-tion of NLRP3 and pro–IL-1β expression. Similar to observations in UCP2-deficient mice, genetic and pharmacologic inhibition of FASN suppressed NLRP3-mediated caspase-1 activation and the synthesis of NLRP3 and pro–IL-1β in vitro as well as IL-1β
and IL-18 production in vivo. In the current study, we describe a molecular mechanism by which UCP2 and FASN regulate the NLRP3 inflammasome and associated caspase-1 activation through the regulation of lipid synthesis. Our results suggest that UCP2- and FASN-mediated lipid synthesis is linked to inflam-matory responses. A summary of the proposed role of UCP2 and FASN in the regulation of metabolism and inflammation is shown in Figure 12 and Supplemental Figure 1.
Among the known UCPs, UCP2 is highly expressed in immune cells from humans and mice and has been implicated in the patho-genesis of type 2 diabetes and obesity (18, 47). Recently, UCP2 has FASN regulates caspase-1 activation and associated cytokine
produc-tion in macrophages. Based on our results that FASN expression and activity are critical for NLRP3 expression, we therefore investigated the role of FASN in NLRP3-mediated caspase-1 activation in mac-rophages. Similar to the result observed in Ucp2–/– BMDMs, FASN
[image:11.585.40.280.59.340.2]knockdown by Fasn shRNA suppressed the expression of cleaved caspase-1 and cleaved IL-1β in wild-type peritoneal macrophages in response to LPS and ATP compared with control shRNA-transduced cells (Figure 10A). Moreover, FASN knockdown reduced the protein expression of NLRP3 and pro–IL-1β in response to LPS. In contrast to NLRP3, the expression of ASC and caspase-1 was unchanged in Fasn shRNA-transduced cells (Figure 10A). IL-1β and IL-18 secretion was also significantly decreased in Fasn shRNA-transduced cells relative to control cells, while TNF secretion was comparable between cells (Figure 10B and Supplemental Figure 14A). Similarly, FASN knock-down by Fasn-specific siRNA suppressed the expression of cleaved caspase-1 and cleaved IL-1β in mouse J774A.1 macrophages in response to LPS and ATP compared with control siRNA-transfected cells (Supplemental Figure 13A). Moreover, IL-1β and IL-18 secretion was also significantly decreased (Supplemental Figure 13B), while TNF secretion was comparable (Supplemental Figure 14B). Con-sistent with FASN knockdown, inhibition of FASN activity by C75 and cerulenin suppressed NLRP3-mediated caspase-1 activation in response to LPS and ATP relative to vehicle treatment in wild-type peritoneal macrophages (Figure 10C). C75 and cerulenin also sup-pressed the protein induction of NLRP3 and pro–IL-1β in response to LPS, while the expression of ASC and caspase-1 was unchanged (Fig-ure 10C). Moreover, IL-1β and IL-18 secretion was also significantly decreased by C75 and cerulenin treatment (Figure 10D). Similar to results in peritoneal macrophages, inhibition of FASN activity by C75 suppressed NLRP3-mediated caspase-1 activation in response to LPS and ATP and the protein induction of NLRP3 and pro–IL-1β
reduced TG synthesis and production of glycolytic metabolites as the result of FASN downregulation. Consistent with the results observed in Ucp2–/– cells, inhibition of FASN also suppressed the
production of glycolytic metabolites. Glucose utilization is reg-ulated by activation of the glucose transporter or by changes in glycolysis (49). GLUT1, which is the predominant glucose trans-porter in macrophages, mediates high glucose uptake and the glycolytic phenotype in macrophages (50). Our results suggest that UCP2 affects glucose utilization independently of the reg-ulation of GLUT1. Although the function of UCP2 in different tissue types remains controversial (51, 52), our results suggest that UCP2 has a significant impact on metabolic reprograming processes in macrophages.
Furthermore, our human data suggest that UCP2 expression was increased in myeloid cells of patients with sepsis, compared with patients with systemic inflammatory response syndrome, suggesting that UCP2 was regulated in patients with systemic inflammation and infection. Our prior studies demonstrate that changes in plasma metabolic profiles, including changes also been shown to be involved in numerous pathophysiological
conditions, including metabolic disorders, inflammation, ische-mic shock, cancer, and aging. UCP2 decreases glucose-derived pyruvate oxidation in mitochondria and enhances aerobic glycol-ysis (23, 25, 26, 48). Metformin, a drug used in the treatment of type 2 diabetes, can induce UCP2 expression and increase glucose utilization in peripheral tissues (24). UCP2 mediates the shift from mitochondrial respiration to aerobic glycolysis (Warburg effect) as well as tumorigenic properties associated with cancer cells (25– 27). Furthermore, UCP2 can facilitate the transport of 4-carbon (C4) tricarboxylic acid cycle metabolites (e.g., malate, oxaloace-tate) from the mitochondria to the cytosol, which supports a role for UCP2 in the reprograming of glucose utilization (28). These studies provide evidence that UCP2 has a significant regulatory role in cellular metabolism and bioenergetics.
[image:12.585.74.510.57.421.2]Our results show that UCP2 regulates cellular glucose utiliza-tion and glycolysis during inflammautiliza-tion. Furthermore, our data show that the UCP2-mediated glycolytic phenotype is regulated by FASN-dependent lipid synthesis. Ucp2–/– BMDMs displayed
The Journal of Clinical Investigation
R e s e a R c h a R t i c l estandard care (target glucose range, 180–200 mg/dl) (57). However, most of subsequent trials did not confirm such a benefit, while they also raised the concern of hypoglycemia as a risk factor of death (58).
For years, NLRP3 has been exclusively studied as a critical component of the NLRP3 inflammasome, which promotes the cleavage of caspase-1. While previous reports suggest that activation of NF-κB by pattern recognition receptors such as TLR4 is necessary for NLRP3 expression (3), the precise molecular mechanism remains unclear. We show that FASN-depen-dent lipid synthesis acts as an upstream signal for NLRP3 expression. Consistent with these results, inhibition of fatty acid synthesis by FASN deficiency and inhibition by C75 suppressed NLRP3 expression involving AKT activation in macrophages. FASN is a multifunctional met-abolic enzyme that catalyzes the terminal steps in the synthesis of long-chain saturated fatty acids (33). The production of fatty acids sup-ports membrane synthesis in proliferating cells (33). Furthermore, FASN expression and activity are critical for AKT activation, which promotes cell survival and enhances tumor cell growth and invasiveness (45). We show here that FASN deficiency suppressed NLRP3 gene expression involving the inhibition of AKT activation in mac-rophages. We also demonstrate that inhibition of p38 MAPK activation as a downstream signal of AKT activation by FASN deficiency reduced Il1b and Il18 gene expression, consistent with a pre-vious report (59). In summary, our data demon-strate that FASN regulates NLRP3 and pro–IL-1β
expression via AKT and downstream p38 MAPK activation. Although p38 MAPK suppression resulted in inhibition of pro–IL-1β expression, we cannot exclude the partial involvement of the ERK1/2 MAPK signaling pathway.
We also identify here a role of FASN-dependent lipid synthesis in NLRP3-mediated caspase-1 activation. Fatty acids for cellular metabolism have two sources, exogenously derived (dietary) fatty acids and de novo synthesized fatty acids. Recently, it has been shown that exogenously derived fatty acids, such as palmitate, one of the most abundant fatty acids in plasma that is substantially elevated following a high fat diet, induces NLRP3 inflammasome activation (43). We showed that the inhibition of lipid synthesis by FASN knockdown, and by C75 treatment, suppressed NLRP3-mediated caspase-1 activation and NLRP3 gene expression, with-out changes in the expression of other components of the NLRP3 inflammasome (i.e., ASC and pro–caspase-1).
In conclusion, our data suggest that UCP2 regulates NLRP3-mediated caspase-1 activation through lipid synthesis NLRP3-mediated by FASN. Also, our data suggest that the regulation of AKT and downstream p38 MAPK activation by FASN are critical for NLRP3 expression and caspase-1 activation (Figure 12 and Supplemental in glucose and lipid metabolites, are associated with mortality
[image:13.585.39.348.56.406.2]in patients with pneumonia and sepsis (13–15). Importantly, the association of high levels of blood glucose and mortality in crit-ical care illness, including sepsis, has been described (53–55). These observations suggest that cellular glycolysis is upregu-lated during septic conditions. While glycolysis is a vital met-abolic process for cellular homeostasis, its excess activation induced by pathological conditions such as infection may be clinically deleterious for septic patients. It is generally accepted that hyperglycemia is associated with worse outcomes in nondi-abetic patients who are admitted to the intensive care unit (ICU), and therefore it should not been neglected (56). However, the optimal target level of blood glucose in patients who are admit-ted to the ICU is a highly debaadmit-ted topic. A single-center random-ized controlled trial showed that a tight glucose control (target glucose range, 80–110 mg/dl) is linked with better survival of patients who are admitted to the surgical ICU compared with
nology), monoclonal rabbit anti–p44/42 MAPK (ERK1/2) antibody for mouse ERK1/2 (4695, Cell Signaling Technology), monoclonal rabbit anti–phospho-p44/42 MAPK (ERK1/2) antibody (4370, Cell Signaling Technology), monoclonal rabbit anti-SAPK/JNK antibody for mouse JNK (9258, Cell Signaling Technology), monoclonal rabbit anti–phos-pho-SAPK/JNK antibody (4668, Cell Signaling Technology), and monoclonal mouse anti–β-actin antibody (A5316, Sigma-Aldrich).
Cell culture. BMDMs were prepared as described previously (3). Bone marrow collected from mouse femurs and tibias (male, 8–10 weeks old) was plated on sterile petri dishes and incubated for 7 days in DMEM medium (Invitrogen) containing 10% (vol/vol) heat-inacti-vated FBS, 100 units/ml penicillin, 100 mg/ml streptomycin, and 25% (vol/vol) conditioned medium from mouse L929 fibroblasts (CCL-1, ATCC). Cells were incubated for 4 hours with LPS (500 ng/ml) and then were treated with ATP (2 mM) for 30 minutes as described previ-ously. Peritoneal macrophages were prepared as described previously (61). Mice were injected with thioglycollate broth medium (1.5 ml, i.p.). After 4 days, peritoneal cells were collected from mice with cold PBS. Cells were incubated for 2 hours with DMEM medium containing 10% (vol/vol) heat-inactivated FBS, penicillin, and streptomycin in 6-well tissue culture plates. Nonadherent cells are removed by gently wash-ing with PBS. After cells were cultured for overnight, cells were incu-bated for 4 hours with LPS (500 ng/ml) and then were treated with ATP (5 mM) for 30 minutes as described previously. Mouse J774A.1 macrophages (TIB-67, ATCC) were cultured in DMEM medium con-taining 10% (vol/vol) FBS, penicillin, and streptomycin.
Immunoblot analysis. Cells or tissues were harvested and lysed in 2 × SDS loading buffer or NP40 Cell Lysis Buffer (FNN0021, Invitro-gen) and then briefly sonicated. Lysates were centrifuged at 15,300 g for 10 minutes at 4°C, and the supernatants were obtained. The pro-tein concentrations of the supernatants were determined using the Bradford assay (BioRad Laboratories). Proteins were subjected to NuPAGE 4–12% Bis-Tris gels (Invitrogen) and transferred to Protran nitrocellulose membranes (10600001, GE Healthcare Life Science).
Cytokine analysis. Cell culture supernatants, lung tissues, and sera were measured for mouse IL-1β and IL-18 with ELISA (R&D Systems). Cell culture supernatants, lung tissues, and sera samples were mea-sured for mouse tumor necrosis factor with ELISA (R&D Systems).
Quantitative real-time PCR. Total RNA was isolated from cultured cells and tissues using the TRIzol Reagent (15596-018, Invitrogen) according to the manufacturer’s instructions. For the quantitative Figure 1). Given the roles of UCP2 in metabolic changes triggered
by the immune response, further investigation of UCP2 in the con-text of cellular metabolism may be useful for elucidating mecha-nisms of human diseases, including, not just metabolic diseases, but diseases in which inflammation plays a key role.
Methods
Mice. The Ucp2–/– mice have been described previously (60). The
lox-UCP2 mice were generated as described previously (60). The LysM-Cre knockin allele has a nuclear-localized LysM-Cre recombinase inserted into the first coding ATG of the lysozyme 2 gene (Lyz2), which abol-ishes endogenous Lyz2 gene function and places NLS-Cre expres-sion under the control of the endogenous Lyz2 promoter/enhancer elements. When crossed with a strain containing a loxP site–flanked sequence of interest, Cre-mediated recombination results in dele-tion of the targeted gene in the myeloid cell lineage, including mono-cytes, mature macrophages, and granulocytes. Macrophage-specific UCP2 deletion was accomplished by crossing loxUCP2 mice with LysM-Cre mice (The Jackson Laboratory). Mice were genotyped using standard PCR of tail DNA.
Reagents. LPS (E. coli) (tlrl-pelps), LAM-MS (Mycobacterium smegmatis) (tlrl-lams), poly(I:C) (tlrl-pic), FLA-ST (Salmonella typhi-murium) (tlrl-pstfa), CpG oligonucleotide (tlrl-1826), and SB203580 (tlrl-sb20) were from InvivoGen. C75 (C5490), Cerulenin (C2389), U0126 (U120), SP600125 (S5567), and ATP (A2383) were from Sigma- Aldrich. The following antibodies were used: polyclonal rabbit anti-UCP2 for mouse anti-UCP2 (662047, EMD Millipore), monoclonal mouse anti-NLRP3 for mouse NLRP3 (ALX-804-881-C100, Enzo Life Sci-ences), polyclonal rabbit anti-ASC for mouse ASC (AP07815PU-N, Acris Antibodies), polyclonal goat anti–IL-1β for mouse IL-1β
(AF-401-NA; R&D Systems), Lipid Metabolism Antibody Sampler Kit for anti-lipogenic enzymes (8337, Cell Signaling Technology), polyclonal rabbit anti-GLUT1 (ab32551; Abcam), polyclonal rabbit anti–caspase-1 for mouse caspase-1 (SC-514; Santa Cruz Biotechnol-ogy), Phospho-AKT Pathway Antibody Sampler Kit for anti-AKT and anti–phospho-AKT (9916S, Cell Signaling Technology), monoclonal rabbit anti–Myc-Tag (2278, Cell Signaling Technology), polyclonal rabbit anti–p38 MAPK antibody for mouse p38 MAPK (9218, Cell Signaling Technology), polyclonal rabbit anti–p38 MAPK antibody for mouse p38 MAPK (9212, Cell Signaling Technology), monoclonal rabbit anti–phospho-p38 MAPK antibody (4511, Cell Signaling
[image:14.585.46.427.55.216.2]The Journal of Clinical Investigation
R e s e a R c h a R t i c l eCT imaging were performed under 1.5% isoflurane general anes-thesia. PET/CT imaging was performed for 20 minutes (10 minutes per bed) using a commercial micro-PET/CT scanner (eXplore Vista, GE healthcare), follow by a CT scan. PET images were corrected for random and scatter coincidence events and reconstructed with the ordered-subsets expectation-maximization algorithm using 16 sub-sets and 2 iterations. No attenuation correction was applied. SUVs were calculated according to the formula (SUV = a / [A/W]), where a represents the activity concentration in the organ region of interest measured using PET images (Bq/ml), A represents the injected activ-ity (Bq), and W represents the mouse body weight in grams. Blood and several organs were harvested for radioactivity measurement using a 1480 Wizard 3 γ-counter (Perkin Elmer). The PEP production was measured using a PEP Fluorometric Assay Kit according to the manufacturer’s instructions (700780, Cayman Chemical Company). The citrate (K655-100, BioVision) and lactate (K607-100, BioVision) production was measured using Colorimetric Assay Kits (BioVision) according to the manufacturer’s instructions.
In vivo experiments. The male mice (8–10 weeks old) were injected i.p. with E. coli LPS (10 mg/kg) (L4130, Sigma-Aldrich). CLP was per-formed as previously described (63). The mice were cohoused in the same cages before and after CLP. The male mouse (8–10 weeks old) cecum was exposed through a 1.5-cm incision. The cecum was ligated below the ileocecal valve with a 6-0 silk suture without bowel obstruc-tion and was then punctured with a 19-gauge needle (1-hole injury). Sham operation consisted of the same procedure without ligation and perforation of the cecum. After surgery, mice were injected with 1 ml physiological saline solution subcutaneously. The organ dysfunction was measured using the Creatinine Parameter Assay Kit (KGE005,
R&D Systems), Aspartate Aminotransferase Activity Assay Kit
(MAK055, Sigma-Aldrich), and Alanine Transaminase Colorimetric Activity Assay Kit (700260, Cayman Chemical Company).
Oil Red O staining. Neutral lipids and lipid droplet morphology in sections from frozen liver tissues from mice was measured by Oil Red O (O1391, Sigma-Aldrich) staining as described previously (64). The sections were incubated with the Oil Red O solution for 5 minutes and then were counterstained with Mayer’s hematoxylin (MHS16, Sigma-Aldrich) for 15 seconds for visualization of the cell nuclei and tissue morphology. The sections were washed under run-ning tap water for 30 minutes.
RNA extraction and microarray. We used PaxGene tubes (761115, QIAGEN) to collect 2.5 ml whole-blood samples from hospitalized patients that consented for the study. Samples were collected within 48 hours of MICU admission (day 1). Total RNA was extracted in ran-dom batches from all available samples using the RNeasy Mini Pro-tocol (74104, QIAGEN). Arrays were read using the Illumina BeadAr-ray scanner and analyzed using BeadStudio (version 3.1.7) without background correction. Raw expression intensities were processed using the Lumi package of Bioconductor, with background adjustment with RMA convolution, and log2 transformation of each array. The combined samples were quantile normalized. The complete raw and normalized microarray data are available through the Gene Expres-sion Omnibus of the National Center for Biotechnology Information (http://www.ncbi.nlm.nih.gov/geo/, accession no. GSE32707).
Patient samples. The BWH Research Registry and Human Sample Repository for the Study of the Biology of Critical Illness (BWH RoCI) is an ongoing registry that collects demographic, clinical information, and RT-PCR, cDNA was synthesized from 4 μg of total RNA using
ran-dom hexamers and SuperScript Reverse Transcriptase II (18064-014, Invitrogen) according to the manufacturer’s instructions. A 10
μl mixture containing the diluted cDNA and a set of gene-specific primers was mixed with 10 μl of 2 x SYBR Green PCR Master Mix (4309155, Applied Biosystems) and then subjected to RT-PCR quan-tification using the ABI PRISM 7500 Real-Time PCR System (Applied Biosystems). The following primers were used: mouse Il1b forward, 5′-ATGAGAGCATCCAGCTTCAA-3′, and reverse, 5′ -TGAAGGAAAA-GAAGGTGCTC-3′; mouse Il18 forward, 5′ -TCAAAGTGCCAGT-GAACCCC-3′, and reverse, 5′-GGTCACAGCCAGTCCTCTTAC-3′; mouse Il12 forward, 5′-AAATGAAGCTCTGCATCCTGC-3′, and reverse, 5′-TCACCCTGTTGATGGTCACG-3′; mouse Tnf for-ward, 5′-TACTGAACTTCGGGGTGATTGGTCC-3′, and reverse, 5′-CAGCCTTGTCCCTTGAAGAGAACC-3′; mouse Nlrp3 forward, 5′-GACGAGTGTCCGTTGCAAGCTG-3′, and reverse, 5′ -TGTGGCT-AGATCCAAGTGATCTGCC-3′; mouse Gapdh forward, 5′ -GGTGAAG-GTCGGTGTGAACGGA-3′, and reverse, 5′ -CCAAAGTTGTCATG-GATGACCTTGG-3′.
Transduction of shRNA and transfection of siRNA. For stable knock-down of mouse Fasn, 3 independent shRNA (TRCN0000075704, TRCN0000075705, and TRCN0000075706, Sigma-Aldrich) were used. For stable knockdown of mouse p38 MAPK, 2 independent shRNA (TRCN0000310885 and TRCN0000304327, Sigma-Aldrich) were used. Mouse peritoneal macrophages (5 × 10⁵ cells per well)
were seeded in 6-well plates and were transduced with shRNA lenti-viral constructs against mouse Fasn, mouse p38 MAPK, or nontarget shRNA (SHC016, Sigma-Aldrich) for control. For transient knock-down of mouse Fasn, siRNA (SASI_Mm01_00177854, Sigma-Aldrich) was used. Mouse J774A.1 macrophages (2 × 10⁵ cells per well) were
seeded in 6-well plates and were transfected with siRNA for mouse Fasn or siRNA Universal Negative Control (SIC001, Sigma-Aldrich) (200 ng per well) using Lipofectamine RNAiMAX Reagent (13778-075, Invitrogen) according to the manufacturer’s instructions. For overexpression of UCP2, mouse Ucp2 cDNA ORF clone (Myc-DDK-tagged) (MR204388, OriGene Technologies) was used. Mouse J774A.1 macrophages (2 × 10⁵ cells per well) were seeded in 6-well plates and
were transfected with Ucp2 cDNA ORF clone or control vector using Lipofectamine LTX Reagent with PLUS Reagent (15338-100, Invitro-gen) according to the manufacturer’s instructions. For AIM2 inflam-masome activation, LPS-primed macrophages were transfected with poly(dA:dT) (1 μg/ml) (P0883, Sigma-Aldrich) using Lipofectamine LTX Reagent with PLUS Reagent (15338-100, Invitrogen) according to the manufacturer’s instructions.
Glucose uptake, PEP, citrate, and lactate production assays. For a glucose uptake assay, cells (5 × 10⁵ cells per well) were plated on 6-well
plates. Cells were then incubated in a glucose-free DMEM media (Invitrogen) for 1 hour. After adding 18F-FDG (0.3 MBq), the cells
were incubated at 37°C for 30 minutes. The cells were washed twice with PBS. Cells were harvested in PBS for radioactivity measurement using a 1480 Wizard 3 γ-counter (Perkin Elmer). Data shown are the mean ± SD of triplicate samples from a representative experiment. For in vivo uptake of 18F-FDG (62), male mice (8–10 weeks old) were
starved overnight. Mice were injected i.p. with E. coli LPS (10 mg/kg) (L4130, Sigma-Aldrich). After LPS injection, 18F-FDG (16.7 ± 1.3 MBq)
analyzed with the log-rank test. P values of less than 0.05 were consid-ered statistically significant.
Study approval. All animal experimental protocols were approved by the Harvard Standing Committee for Animal Welfare (protocol no. 04435; Harvard Medical School) and the Institutional Animal Care and Use Committee of Weill Cornell Medical College (New York, New York, USA) (protocol no. 2013-0108). All analysis of human tissue was conducted according to the guidelines of and with the approval of the BWH Institutional Review Board. BWH RoCI is approved by the Partners Human Research Committee and operates under protocol 2008-P-000495. Informed consent was obtained directly from each subject and documented in writing before the start of study-related procedures. The written and oral information provided to subjects was approved by the Partners Human Research Committee (Boston, Massachusetts, USA) before and during the informed consent process.
Acknowledgments
We thank E. Ifedigbo for technical assistance. We thank Brad-ford B. Lowell and Kong Dong for supervising the generation of loxUCP2 mice. This work was supported by the National Insti-tutes of Health (grants P01 HL108801, R01 HL079904, and R01 HL055330 to A.M.K. Choi).
Address correspondence to: Augustine M.K. Choi, Joan and San-ford I. Weill Department of Medicine, Weill Cornell Medical Center, 525 East 68th Street, Room M-522, Box 130, New York, New York 10065, USA. Phone: 212.746.4720; E-mail: amc2056@ med.cornell.edu.
blood specimens from patients admitted in the MICU (11, 13, 14). All adults (age 18 and older) admitted to the MICU of BWH are considered for enrollment. Exclusion criteria included participants (a) with mental handicaps, (b) who are unable to provide consent or for whom an appro-priate legal representative could not be found to provide consent, (c) who had previously indicated that they did not wish to be enrolled in this study (e.g., during a prior admission to the MICU), (d) who were admit-ted for comfort measures and, (e) for whom there was concern about nonmedically indicated blood draws (e.g., Jehovah’s Witnesses). ICU control and sepsis was identified according to the 2001 SCCM/ESICM/ ACCP/ATS/SIS International Sepsis Definitions Conference guidelines (65, 66). ICU control (systemic inflammatory response syndrome) was defined as having 2 or more of the following criteria: temperature <36°C or >38°C; heart rate >90; RR interval >20 or PaCO2 <32; WBC >1,2000 or <4,000; or >10% immature (band) forms. Sepsis was defined as a documented infection (culture positive or strong clinical suspicion) together with 2 or more ICU control criteria above. Total blood RNA was isolated from patients of the BWH RoCI cohort. Gene expression pro-files were generated using Human HT-12 v4 BeadChip arrays (Illumina) according to the manufacturer’s protocol (15). The microarray data are available through the Gene Expression Omnibus of the National Center for Biotechnology Information (accession no. GSE32707).
Statistics. All data are mean ± SD, combined from 3 independent experiments. All statistical tests were analyzed by 2-tailed Student’s t test for comparison of 2 groups and ANOVA (with post-hoc compari-sons using Dunnett’s test) using a statistical software package (Graph-Pad Prism version 4.0) for comparison of multiple groups. P values of less than 0.05 were considered statistically significant. Survival was
1. Angus DC, van der Poll T. Severe sepsis and sep-tic shock. N Engl J Med. 2013;369(9):840–851. 2. Hotchkiss RS, Karl IE. The pathology and
treat-ment of sepsis. N Engl J Med. 2003;348(2):138–150. 3. Rogers AJ, et al. Metabolomic derangements are
associated with mortality in critically ill adult patients. PLoS One. 2014;9(1):e87538. 4. Langley RJ, et al. An integrated
clinico-metab-olomic model improves prediction of death in sepsis. Sci Transl Med. 2013;5(195):195ra95. 5. Dolinay T, et al. Inflammasome-regulated
cyto-kines are critical mediators of acute lung injury. Am
J Respir Crit Care Med. 2012;185(11):1225–1234.
6. Nakahira K, et al. Circulating mitochondrial DNA in patients in the ICU as a marker of mortality: derivation and validation. PLoS Med. 2013;10(12):e1001577.
7. Lamkanfi M, Dixit VM. Inflammasomes and their roles in health and disease. Annu Rev Cell Dev
Biol. 2012;28:137–161.
8. Schroder K, Tschopp J. The inflammasomes. Cell. 2010;140(6): 821–832.
9. Sutterwala FS, et al. Critical role for NALP3/ CIAS1/Cryopyrin in innate and adaptive immu-nity through its regulation of caspase-1.
Immu-nity. 2006;24(3):317–327.
10. Jin C, Flavell RA. Molecular mechanism of NLRP3 inflammasome activation. J Clin
Immu-nol. 2010;30(5):628–631.
11. Masters SL, et al. Activation of the NLRP3 inflam-masome by islet amyloid polypeptide provides a mechanism for enhanced IL-1β in type 2
diabe-tes. Nat Immunol. 2010;11(10):897–904. 12. Tschopp J, Schroder K. NLRP3 inflammasome
activation: The convergence of multiple sig-nalling pathways on ROS production? Nat Rev
Immunol. 2010; 10(3):210–215.
13. Zhou R, Tardivel A, Thorens B, Choi I, Tschopp J. Thioredoxin-interacting protein links oxidative stress to inflammasome activation. Nat Immunol. 2010;11(2):136–140.
14. Nakahira K, et al. Autophagy proteins regulate innate immune responses by inhibiting the release of mitochondrial DNA mediated by the NALP3 inflammasome. Nat Immunol. 2011;12(3): 222–230. 15. Kanneganti TD, Lamkanfi M. K+ drops tilt
the NLRP3 inflammasome. Immunity. 2013;38(6):1085–1088.
16. Allam R, et al. Mitochondrial apoptosis is dispensable for NLRP3 inflammasome activa-tion but non-apoptotic caspase-8 is required for inflammasome priming. EMBO Rep. 2014;15(9):982–990.
17. Rousset S, et al. The biology of mitochondrial uncoupling proteins. Diabetes. 2004; 53(suppl 1):S130–S135.
18. Fleury C, et al. Uncoupling protein-2: a novel gene linked to obesity and hyperinsulinemia. Nat
Genet. 1997;15(3):269–272.
19. Yoshitomi H, Yamazaki K, Tanaka I. Cloning of mouse uncoupling protein 3 cDNA and 5′-flanking region, and its genetic map. Gene. 1998;215(1):77–84.
20. Arsenijevic D, et al. Disruption of the uncoupling
protein-2 gene in mice reveals a role in immunity and reactive oxygen species production. Nat
Genet. 2000;26(4):435–439.
21. Diano S, et al. Uncoupling protein 2 prevents neuronal death including that occurring during seizures: a mechanism for preconditioning.
Endocrinology. 2003;144(11):5014–5021.
22. Andrews ZB, et al. Uncoupling protein-2 is critical for nigral dopamine cell survival in a mouse model of Parkinson’s disease. J Neurosci. 2005;25(1):184–191.
23. Zhang J, et al. UCP2 regulates energy metabolism and differentiation potential of human pluripo-tent stem cells. EMBO J. 2011;30(24):4860–4873. 24. Anedda A, Rial E, Gonzalez-Barroso MM.
Met-formin induces oxidative stress in white adipo-cytes and raises uncoupling protein 2 levels.
J Endocrinol. 2008;199(1):33–40.
25. Pecqueur C, et al. Uncoupling protein-2 controls proliferation by promoting fatty acid oxidation and limiting glycolysis-derived pyruvate utiliza-tion. FASEB J. 2008;22(1):9–18.
26. Samudio I, Fiegl M, McQueen T, Clise- Dwyer K, Andreeff M. The warburg effect in leukemia-stroma cocultures is mediated by mitochondrial uncoupling associated with uncoupling protein 2 activation. Cancer Res. 2008;68(13):5198–5205.


![catena Poly[[μ 1,2 di 4 pyridylethylene κ2N,N′ [aqua(2 sulfonatobenzoato κ2O,O′)copper(II)]] N,N dimethylformamide]](data:image/gif;base64,R0lGODlhAQABAIAAAP///wAAACH5BAEAAAAALAAAAAABAAEAAAICRAEAOw==)