R E S E A R C H
Open Access
Single-cell analysis of lung adenocarcinoma cell
lines reveals diverse expression patterns of
individual cells invoked by a molecular target
drug treatment
Ayako Suzuki
1, Koutatsu Matsushima
2, Hideki Makinoshima
2, Sumio Sugano
1, Takashi Kohno
3,4,
Katsuya Tsuchihara
2and Yutaka Suzuki
1,5*Abstract
Background:To understand the heterogeneous behaviors of individual cancer cells, it is essential to investigate gene expression levels as well as their divergence between different individual cells. Recent advances in
next-generation sequencing-related technologies have enabled us to conduct a single-cell RNA-Seq analysis of a series of lung adenocarcinoma cell lines.
Results:We analyze a total of 336 single-cell RNA-Seq libraries from seven cell lines. The results are highly robust regarding both average expression levels and the relative gene expression differences between individual cells. Gene expression diversity is characteristic depending on genes and pathways. Analyses of individual cells treated with the multi-tyrosine kinase inhibitor vandetanib reveal that, while the ribosomal genes and many other so-called house-keeping genes reduce their relative expression diversity during the drug treatment, the genes that are directly targeted by vandetanib, the EGFR and RET genes, remain constant. Rigid transcriptional control of these genes may not allow plastic changes of their expression with the drug treatment or during the cellular acquisition of drug resistance. Additionally, we find that the gene expression patterns of cancer-related genes are sometimes more diverse than expected based on the founder cells. Furthermore, we find that this diversity is occasionally latent in a normal state and initially becomes apparent after the drug treatment.
Conclusions:Characteristic patterns in gene expression divergence, which would not be revealed by transcriptome analysis of bulk cells, may also play important roles when cells acquire drug resistance, perhaps by providing a cellular reservoir for gene expression programs.
Background
Recent advances in next-generation sequencing analysis have enabled genome and transcriptome analysis of a large number of samples within a reasonable time and at a reasonable cost. Particularly, whole-genome sequen-cing and exome sequensequen-cing analyses have been con-ducted intensively to characterize somatic mutations in cancer. Recently, The Cancer Genome Atlas and the
International Cancer Genome Consortium have reported genome, RNA and DNA methylation patterns for thou-sands of clinical samples for hundreds of diverse cancer types [1,2].
Advances in next-generation sequencing are not lim-ited to the throughput and cost of sequencing itself. Technical innovations in the sample preparation steps have also significantly improved, enabling us to con-struct a sequencing library from a very small amount of starting material. For the purpose of genome sequen-cing, multiple displacement amplifications [3] are now widely used to amplify sub-picogram genomic DNA to prepare a sequencing template from a single cell [4]. Additionally, for the purpose of transcriptome analysis, * Correspondence:ysuzuki@hgc.jp
1
Department of Medical Genome Sciences, Graduate School of Frontier Sciences, The University of Tokyo, Chiba 277-8562, Japan
5
Department of Computational Biology, Graduate School of Frontier Sciences, The University of Tokyo, Chiba 277-8562, Japan
Full list of author information is available at the end of the article
several methods for whole transcriptome amplification, including template switching-based cDNA amplification, have been developed, enabling transcriptome analysis of a single cell [5,6]. Although it has been thought that amplification bias would introduce significant bias in the expression information during the amplification step, it is now possible to prepare an RNA-Seq library in a high-throughput and reasonably reproducible manner [7]. At the same time, methods to capture a single cell in a high-throughput manner are also being rapidly devel-oped. Using microfluidics technology or cell sorters, commercial instruments now support automatic separ-ation of cells, which are subsequently used for template preparation for sequencing analysis in a seamless man-ner [8]. Taken together, these methods have opened the possibility to conduct genome or transcriptome analysis of a single cell in various biological systems [9].
With the analytical methods for individual cells avail-able, one of the most attractive objectives for their appli-cation should be single-cell analysis of cancer cells. The extent to which cancer cells are diverse within a given population and how they respond to environmental changes, particularly to an anti-cancer drug treatment, are pressing research questions. Indeed, these questions have been analyzed for a limited number of genes. For example, the single-cell transcriptome of colon cancer was described in a previous study, which reported the results of quantitative PCR for a limited number of cancer-related genes [10]. That study revealed that tran-scriptional diversity of cancer tissues should be ex-plained by multilineage differentiation of the individual cancer cells and that such diversity is closely associated with prognostic outcomes. However, comprehensive knowledge of how individual cells change their tran-scriptional programs in response to environmental changes remains elusive.
In this study, we characterized the heterogeneity in gene expression that exists within a given population of cancer cells. We also attempted to investigate how the transcriptome of each cell responds to a molecularly tar-geted drug and how they differ between parental cells and cells that have acquired drug resistance. For this purpose, we used a series of lung adenocarcinoma-derived cell lines. We constructed single-cell RNA-Seq libraries and screened them for heterogeneous transcrip-tome features. We characterized distinct transcriptranscrip-tome features, separating individual cells in a particular cell type and those in different cell types. We put particular focus on the analysis of LC2/ad. This cell line expresses a fusion gene transcript of a tyrosine kinase, RET, and CCDC6, resulting in the aberrant activation of the kin-ase activity of RET, which serves as a major driving force for carcinogenesis (a cancer driver) [11,12]. Indeed, at the clinical level, the RET fusion transcripts were found
in 1 to 2% of lung adenocarcinomas. A multi-tyrosine kinase inhibitor, vandetanib, which inhibits the tyrosine kinase activity of RET, is expected to be effective in treating patients expressing these fusion transcripts [13-16]. Actually, several 'proof of concept' clinical trials are ongoing. However, acquiring drug resistance to van-detanib will be unavoidable, as has occurred for other tyrosine kinase inhibitors, including gefitinib for EGFR and crizotinib for ALK. Indeed, we and others have iden-tified a subclone of LC2/ad that has acquired resistance to vandetanib (LC2/ad-R; see below). In this study, we examined the gene expression patterns in individual cells of LC2/ad and LC2/ad-R cells with or without vandeta-nib treatment. Here, we describe our single-cell RNA-Seq analysis using 336 single-cell RNA-RNA-Seq libraries con-structed from seven types of lung adenocarcinoma cell lines.
Results and discussion
RNA-Seq analysis of individual cells of a lung adenocarcinoma cell line, LC2/ad
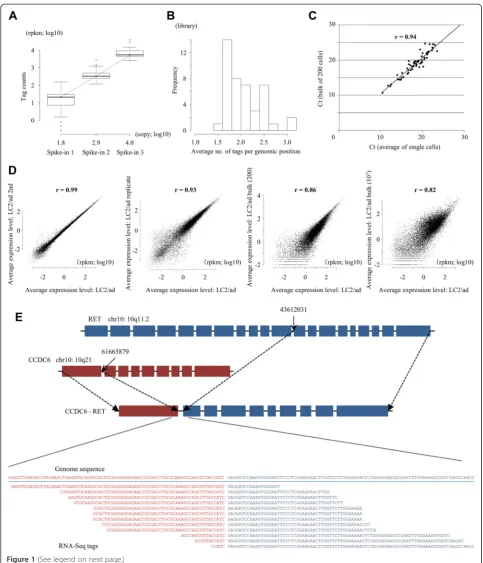
To analyze gene expression levels and their variances be-tween different individual cells, we constructed a series of single-cell RNA-Seq libraries from a human lung adenocarcinoma cell line, LC2/ad. To construct the li-braries, we used the Fluidigm C1 platform (for details on the procedure, see Figure S1 in Additional file 1) [8]. Using the constructed libraries, we generated RNA-Seq tags by 97-base paired-end reads. We allocated a full flow cell of HiSeq2500 with 12-plex samples to a single lane, yielding 14 million tags, on average, for each library (Additional file 2). For the purpose of the initial quality check, we utilized three spike-in controls. Most of the cells were within the range of standard deviations re-garding the expected read counts for all of the spike-in controls (Figure 1A). To further ensure the fidelity of the data, we discarded libraries in which tag counts of any of the spike-in controls deviated by more than two standard deviations from the other cells. Forty-three li-braries passed the filter and were used for the following analyses (Table 1). RNA-Seq tags derived from these li-braries were mapped to the reference human genome allowing two base mismatches. Among the mapped RNA-Seq tags, an average of 78% were mapped within the RefSeq gene regions, which is comparable with nor-mal RNA-Seq libraries. To measure the gene expression levels, we counted the RNA-Seq tags that were mapped to the RefSeq regions and calculated reads per million tags per kilobase mRNA (rpkm) [17]. Further details of the statistics are shown in Additional file 2.
start- and end-mapping coordinates). We found that, on average, such tags appeared 2.6 times per genomic pos-ition (Figure 1B), which is almost at a similar rate as usual RNA-Seq libraries at this depth (Table S2 in Additional file 1). Second, to validate equal amplification of cDNAs between different cells, we performed quantitative RT-PCR analysis of 85 genes (Additional file 3). As shown in Figure 1C, the quantitative RT-PCR results were well-correlated (r = 0.94) between RNA-Seq tags from a bulk library of 200 cells and an average of 43 single cell libraries, although this experiment did not directly support equal amplification between different cells. Third, we examined the reproducibility of the data. We repeated the sequencing using the same templates and found that the correlation was almost perfect (r = 0.99; the first panel in Figure 1D). We also analyzed and found that the results are robust for the increasing se-quence depth and the re-amplification of the same sin-gle cell materials (Figure S2 in Additional file 1). To further ensure the reproducibility between independ-ent experimindepend-ents, we repeated the library construction, starting from independently cultured LC2/ad cells. Again, we found that the results were highly reprodu-cible (r = 0.93; the second panel in Figure 1D). To examine reproducibility with regard to dependence on the number of starting cells and the library construc-tion protocol, we compared the results of the single-cell analysis with those obtained from the libraries
prepared from 200 cells and those from the libraries constructed according to the usual RNA-Seq protocol using 10 million cells. We observed reasonable reproduci-bility with r = 0.86 and r = 0.82 (the third and fourth panels in Figure 1D). Last, we examined whether the char-acteristic fusion gene transcript CCDC6-RET can be de-tected in the single-cell libraries. As shown in Figure 1E, we searched and identified a total of 12 RNA-Seq tags that spanned the junctions of the fusion gene (also see Figure S3 in Additional file 1 for identification of the tags of the fusion transcript from the increased sequence depth; iden-tification of the tags spanning the driver mutation in the EGFR gene in a different cell line, PC-9, is also described there). Taken together, these results demonstrate that the single-cell data should be reproducible and can be used similarly to usual RNA-Seq analyses.
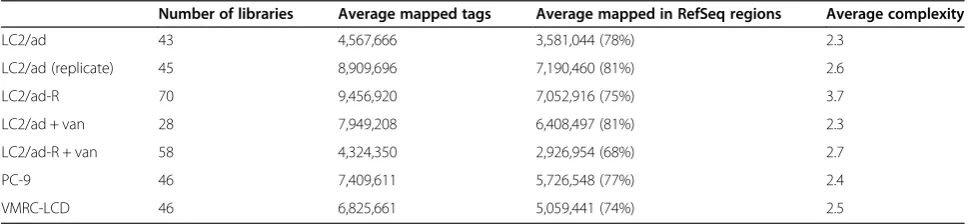
[image:4.595.56.543.621.733.2]Gene expression divergence between different individual cells Using the generated RNA-Seq data, we first examined the gene expression levels averaged for the individual cells. As previously reported, expression levels showed a distribution that roughly follows Zipf’s law (bold line in Figure 2A) [18]. In addition to the average expression levels, we also investigated divergence of the expression levels among the individual cells (pale vertical lines in Figure 2A). We calculated the standard deviation of the rpkm for each gene and divided it by the average rpkm (called 'relative divergence' hereafter). We found that a
Table 1 Statistics of the RNA-Seq tag data used for the present study
Number of libraries Average mapped tags Average mapped in RefSeq regions Average complexity
LC2/ad 43 4,567,666 3,581,044 (78%) 2.3
LC2/ad (replicate) 45 8,909,696 7,190,460 (81%) 2.6
LC2/ad-R 70 9,456,920 7,052,916 (75%) 3.7
LC2/ad + van 28 7,949,208 6,408,497 (81%) 2.3
LC2/ad-R + van 58 4,324,350 2,926,954 (68%) 2.7
PC-9 46 7,409,611 5,726,548 (77%) 2.4
VMRC-LCD 46 6,825,661 5,059,441 (74%) 2.5
(See figure on previous page.)
gene with a higher expression level tends to have a lower relative divergence (Figure 2B). This may have been caused by insufficient coverage of RNA-Seq tags, par-ticularly for lowly expressed genes. However, at least for the genes with >5 rpkm, they were represented by ap-proximately >50 RNA-Seq tags at this sequence depth; thus, the depth seemed to be sufficient to represent the truly divergent gene expression in cells (see Figure S5, S6 and S7 in Additional file 1 for further detailed ana-lysis on the dependency of the sequence depth and the detected relative divergence; also see the relation be-tween the sequence depth and the number of tags in each gene in Figure S8 in Additional file 1).
To further ensure the correct measurement of the relative divergence depending on the sequence coverage, we examined the dependency of the calculated relative divergence on varying sequencing depth. As shown in Figure 2C, calculated relative divergence plateaued when the sequence depth exceeded two million tags per cell, especially for genes with expression levels >5 rpkm. Additionally, it was unlikely that the observed diver-gences were derived from typical technical errors be-cause they were reproducible between the independent experiments (r = 0.82; Figure 2D). Lastly, we conducted real time RT-PCR assays for 13 genes for each of the sin-gle cells (total data point n = 560) using the remaining aliquots of the amplified cDNAs (Figure 2E,F; see Table S4 in Additional file 1 for primers). We confirmed that, generally, the expression levels detected by real time RT-PCR were consistent with the results of RNA-Seq. We further compared the relative divergence between that calculated from the real time RT-PCR and that from the RNA-Seq and found that they are reasonably consistent (r = 0.84; also see Figure S4 in Additional file 1 for the case of PC-9, where r = 0.92 when calculated using total data points n = 630). Also, we examined the dependency of the observed relative divergence on the number of the cells used for the analysis. For this purpose, we used the dataset of LC2/ad cells (a total of 88 cells; LC2/ad (43
cells) + LC2/ad replicate (45 cells)). As shown in Figure S9 in Additional file 1, we found approximately 30 cells should be the minimum number of cells to estimate the relative divergence in gene expression, although even with 88 cells the plots did not seem to always reach a complete plateau. Based on these results, we concluded that the observed diversities in gene expressions were not derived merely from technical errors or insufficient sequence depth or inadequate data size but represent real biological phenomena.
We found that the divergences were frequently unique to genes, even between genes with similar expression levels (see below). For example, the relative divergences of the GRB14, EMP3 and EGFR genes (relative diver-gence ranks of 181, 6,849 and 2,830, respectively) were significantly different in spite of their similar average ex-pression levels (Figure 2G). In this study, we evaluated the diversity in gene expression by considering their standard deviations. It should be noted, however, that the 'relative divergence' may not correctly reflect the overall divergence, particularly when there is a certain population of individual cells giving extremely high or low expression values. Indeed, the high relative divergence observed for EMP3 gene expression was accounted for by the fact that the expression of this gene was 0 in about half of the cells.
Then, we examined how many genes had diverse or less diverse expression patterns compared with genes with similar expression levels because the relative diver-gence showed some dependency on the average gene expression level. For this purpose, we matched the ex-pression levels of the control genes: they were selected so that their average expression levels fell within two-fold of the expression levels of the original genes (though their relative divergence may vary). We selected 1,000 genes (or all of the genes satisfying the criterion) for each gene and selected the genes giving P< 0.05 (f-test) compared with the background distribution of the relative divergence at similar expression levels in the (See figure on previous page.)
tests (see Materials and methods). We found a total of 305 and 596 genes that showed more or less diverse ex-pression patterns, respectively (see Additional file 4 for a full list). Next, we examined whether the genes with high or low relative divergence were enriched in particular pathways. Genes of characteristic KEGG (Kyoto Encyclopedia of Genes and Genomes) pathways [19] were identified. In particular, those pathways related to cancers, such as the p53 signaling pathway (KEGG pathway ID: hsa04115; average P= 3e-6) and the ErbB signaling pathway (KEGG pathway ID: hsa04012; aver-age P= 2e-2), were identified as pathways in which genes with expression patterns that had high and low diversity, respectively, were enriched (Figure 2H). Relative divergence may reflect the intrinsic properties of tran-scriptional regulatory machineries, which are characteris-tic depending on genes and pathways.
Gene expression patterns in different lung adenocarcinoma cell lines
To characterize relative divergences in different cell lines, we conducted a similar single-cell RNA-Seq ana-lysis for two additional lung adenocarcinoma cell lines, PC-9 and VMRC-LCD (Table 1). At the same time, we conducted whole-genome sequencing for LC2/ad, PC-9 and VMRC-LCD as bulk samples [20] (Figure S10 in Additional file 1). Consistent with previous studies, we detected the RET fusion gene as a driver mutation in LC2/ad (Figure S10B in Additional file 1). We also found PC-9 carries a known driver mutation in the EGFR gene (E746_A750del; Figure S10C in Additional file 1), while no driver was identified for VMRC-LCD. Similar to the case of LC2/ad, validation analyses of the RNA-Seq are shown in Figure S11 in Additional file 1.
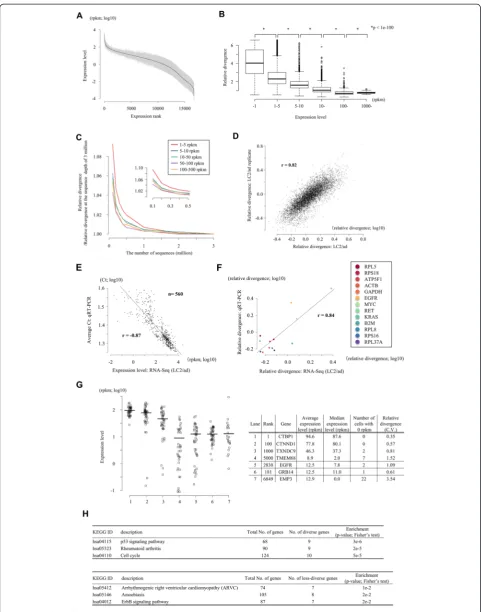
Using the obtained data, we compared the gene expres-sion levels averaged for different individual cells. We found that they are generally similar between the cell lines, per-haps reflecting the fact that they were all established from lung adenocarcinomas (upper panels in Figure 3A). We also examined the distribution of the average gene expres-sion levels. Again, we found that they are similar between cell lines (left panel in Figure 3B). However, the relative di-vergences were more distinct between cell types (lower panels in Figure 3A). For example, PC-9 gave the smallest expression variation between individual cells, followed by VMRC-LCD and LC2/ad (right panel in Figure 3B). Those differences were statistically significant (insets in Figure 3B).
As for LC2/ad, we conducted KEGG pathway enrich-ment analysis of the genes with high relative divergences in these cell lines. Again, we found that cancer-related genes and pathways were enriched (Table S6 in Additional file 1). However, we also found that each cell type had partly common and partly unique enrichment patterns
(see below). Notably, we compared the gene expression patterns of the EGFR pathway genes, which are supposed to play pivotal roles in carcinogenesis of lung cancers [19,21], between cell lines (Figure 3C). We found that this pathway was, indeed, enriched for diversely or less di-versely expressed genes in general, but different gene components contributed to the overall high divergence depending on the cell line (Figure 3C; Additional file 5). These divergences may contribute to the characteristic cellular behavior of each cell line in addition to their average expression levels.
Gene expression patterns in cancer-related genes
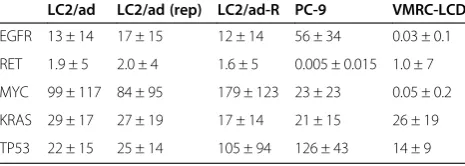
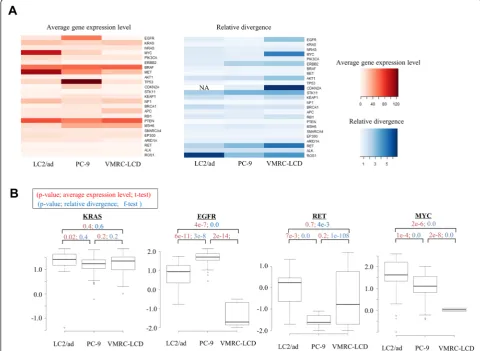
We further examined the expression patterns of the 25 representative cancer-driver or tumor-suppressor genes, which were selected from recent papers on clinical gen-ome sequencing of lung cancers (we call them 'cancer-related genes' hereafter; the expression patterns of five representative cancer-related genes are shown in Table 2) [21-23]. Additionally, for these genes, the relative diver-gences converged to 1.0 for the genes with expression levels >5 rpkm (Additional file 6). Again, we observed that each cell had unique expression patterns not only for average expression levels but also for relative diver-gences for functionally important genes (Figure 4A).
To further investigate the biological meaning of the observed unique patterns of relative divergences based on genes and cell lines, we considered whether each line carries any known driver mutations in the corresponding genes. Whole-genome sequencing of these cell lines showed that neither LC2/ad, PC-9 nor VMRC-LCD is known to carry any driver mutations in the KRAS gene (Figure S10D in Additional file 1). The expression levels of the KRAS gene and their variation were almost simi-lar between the cell lines (Figure 4B). However, for the EGFR gene, the average gene expression levels were 4.4 times and >1,000 times higher in PC-9, which carries a driver mutation, than in LC2/ad and VMRC-LCD, re-spectively, both of which do not possess such a driver mutation. In PC-9, the relative divergence of the EGFR gene was 1.8 times and 5 times narrower than in LC2/ad and VMRC-LCD, respectively (see Figure S4C in Additional file 1 for the validation analysis). In the case of the RET gene, however, for which LC2/ad carries a gene fusion, the highest expression level and the narrowest divergence were observed in LC2/ad. It is tempting to speculate that the EGFR gene in PC-9 and the RET gene in LC2/ad may be under stricter selection pressures. Thus, the increased expression levels and the narrow divergence for the corre-sponding genes would be natural consequences in these cell lines.
divergence was almost equivalent between them (less than 1.2-fold difference). In LC2/ad, the MYC gene was found to be genomically amplified (Figure S12 in Additional file 1). Similarly, in the case of the CCNC gene, for which gen-ome amplification was observed solely in VMRC-LCD, expression levels were 6.0 and 4.9 times higher but with similar levels of relative divergence (1.4- and 1.9-fold difference) compared with PC-9 and LC2/ad, respect-ively. Relative divergences may reflect distinct mecha-nisms of up-regulation of gene expression. In either case, it should be particularly important to further in-vestigate how the observed divergence in gene expres-sion is realized through transcriptional mechanisms and to what extent these mechanisms contribute to charac-teristic phenotypic differences in each cell line.
Changes in gene expression patterns in response to vandetanib stimulation
To examine how gene expression divergences vary in re-sponse to a molecular target drug, we conducted a similar single-cell RNA-Seq analysis using LC2/ad treated with vandetanib (1μM for 6 hours; IC50 = 0.32μM; Figure S13 in Additional file 1). We also utilized an LC2/ad-derived cell line, LC2/ad-R, which has acquired resistance to vandetanib (IC50 = 1.13 μM; Figure S13 in Additional file 1), in a similar analysis (Table 1; statistics and valid-ation analyses of the RNA-Seq are shown in Figure S11D in Additional file 1 and in Additional file 2). Whole-genome sequencing of LC2/ad-R showed that essentially no driver mutations in cancer-related genes, such as those in the EGFR and KRAS genes, were newly acquired in LC2/ad-R (Figure S10E in Additional file 1).
First, we compared the expression patterns between LC2/ad and LC2/ad-R without stimulation. We found
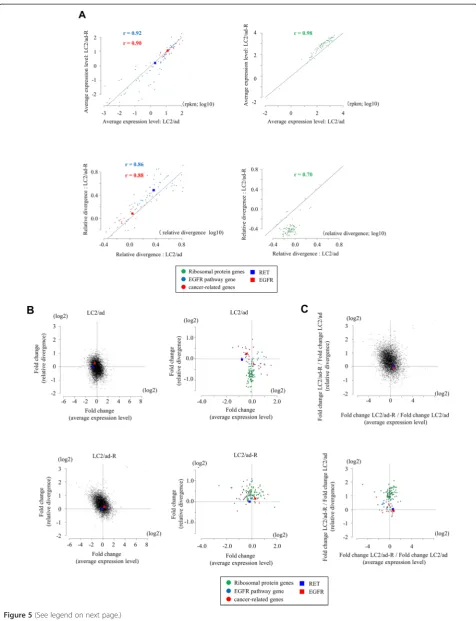
that the average expression levels of many of the so-called house-keeping genes [19,24], represented by ribosomal protein genes (right panels in Figure 5A; see Figure S14 in Additional file 1 for further details; see Figure S15 in Additional file 1 and Additional file 7 for changes in relative divergence in other house-keeping genes), were similar between them. However, their relative divergences were significantly lower in the LC2/ad-R cells. Because LC2/ad-R cells were derived from a subpopulation of parental LC2/ad cells, their expression patterns may be originally more homogeneous than parental cells. Unlike the case of ribosomal protein genes, both the expression levels and the relative divergences of the EGFR pathway genes and cancer-related genes were similar between these cell lines (left panels in Figure 5A).
Next, we compared the fold changes of the average expression levels in response to vandetanib treatment. We selected the genes for which average expression levels changed more than two-fold in response to the vandetanib treatment. We identified 1,202 such genes (457 genes that were induced and 745 genes that were repressed) in LC2/ad and 2,037 such genes (539 genes that were induced and 1,498 genes that were repressed) in LC2/ad-R (Figure S16 in Additional file 1). A wide variety of genes were included, likely reflecting the fact that the anti-cancer drug treatment affected various signaling pathways in both LC2/ad and LC2/ad-R (Table S10 in Additional file 1). Additionally, distinct patterns of alternations in gene expression were observed be-tween LC2/ad and LC2/ad-R (Figure S16 in Additional file 1), likely reflecting diverse responses in these cell lines to the vandetanib treatment.
We found that, compared with the parental cells, aver-age expression levels generally changed more in LC2/ ad-R (Figure 5B; Figure S16 in Additional file 1). LC2/ ad-R cells may have acquired the ability to plastically change their transcriptome regulation in response to the vandetanib treatment. We also examined fold changes of the relative divergences. We found that changes in the relative divergences were more significant in the parental LC2/ad line. In this case, for many of the house-keeping genes, as exemplified by the ribosomal protein genes (upper panel in Figure 5B), the relative divergences were greatly reduced in LC2/ad, as if the cells lose diversity in response to the drug treatment. However, such (See figure on previous page.)
Figure 3Expression diversity in different cell types.(A)Difference in the average gene expression levels (upper panels) and the relative
[image:9.595.57.290.643.726.2]divergences (lower panels) between LC2/ad and PC-9 cells (left panels), LC2/ad and VMRC-LCD cells (middle panels) and PC-9 and VMRC-LCD cells (right panels). Pearson’s correlation co-efficient is also shown in the plots.(B)Range of the average expression levels (left panel) and their relative divergences (right panel) in the indicated cell types (LC2/ad, red; PC-9, green; VMRC-LCD, purple). Statistical significance of the difference between the indicated cell lines and the average values are shown in the insets.(C)Expression pattern of the EGFR pathway genes. The color density of each circle represents the average expression level and the radius the relative deviation. Expression patterns of the indicated cell types are shown.
Table 2 Gene expression variations for representative cancer-related genes in single cells of different cell lines
LC2/ad LC2/ad (rep) LC2/ad-R PC-9 VMRC-LCD
EGFR 13 ± 14 17 ± 15 12 ± 14 56 ± 34 0.03 ± 0.1
RET 1.9 ± 5 2.0 ± 4 1.6 ± 5 0.005 ± 0.015 1.0 ± 7
MYC 99 ± 117 84 ± 95 179 ± 123 23 ± 23 0.05 ± 0.2
KRAS 29 ± 17 27 ± 19 17 ± 14 21 ± 15 26 ± 19
TP53 22 ± 15 25 ± 14 105 ± 94 126 ± 43 14 ± 9
reductions in relative divergences were not observed in LC2/ad-R. Rather, changes were sometimes slightly induced even when the average expression levels were unchanged (lower panel in Figure 5B). In summary, LC2/ad-R showed reduced average gene expression and LC2/ad showed reduced relative divergence (upper panel in Figure 5C; note that the dots are enriched in the upper left part of the plots).
In particular, for EGFR pathway genes and cancer-related genes, typical alterations in average expression levels or relative divergences in response to vandetanib were not significant (right panels in Figure 5B; lower panel in Figure 5C). Expression levels and relative diver-gences of the EGFR and RET genes, which are direct targets of vandetanib [25], remained unchanged both in LC2/ad and LC2/ad-R. Cellular survival of parental LC2/ ad should be heavily dependent on these genes. There-fore, their expression may have been robustly regulated, even with some allowance for diversity among different
cells, but could not be altered by the drug treatment. Although LC2/ad-R is not dependent on these genes, and vandetanib inhibited their activities as tyrosine kinases, such changes were not reflected as a change in the transcriptional program due to their rigid transcrip-tional regulation, which may be due to the inherent nature of this cell type. For genes directly related to cancers, such as cancer drivers, distinct types of selective pressure may have been exerted by other genes.
Gene expression patterns of single cells
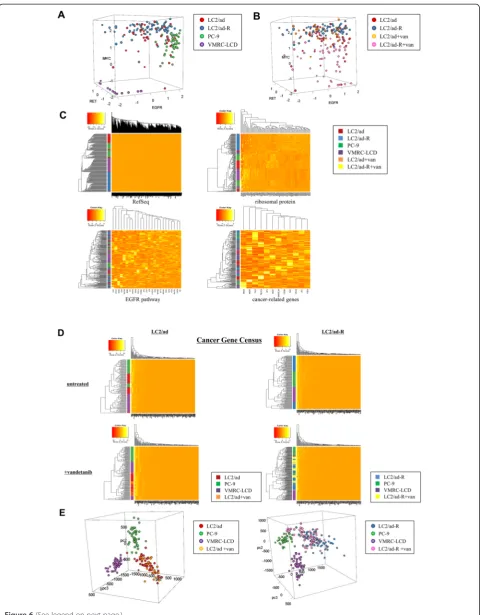
[image:10.595.56.537.91.442.2]In addition to investigating gene expression diversity be-tween individual cells, we wished to analyze the expres-sion levels of genes and their mutual relations within an individual cell. We plotted individual cells of each cell type according to the expression levels of the EGFR, MYC and RET genes, using 205 cells (43, 70, 46 and 46 cells from LC2/ad, LC2/ad-R, PC-9 and VMRC-LCD, respectively). As expected, individual cells formed clusters depending Figure 4Expression diversity in the cancer-related genes.(A)Heat maps of the average expression levels (left panel) and their relative
on parent cell types (Figure 6A). However, we also observed that a number of cells deviated from the cen-ter of each cluscen-ter, suggesting hecen-terogeneity within the populations. We also conducted similar analysis using vandetanib-treated cells, with a total of 199 cells (43, 70, 28 and 58 cells from LC2/ad, LC2/ad-R, LC2/ad + vandetanib and LC2/ad-R + vandetanib, respectively). We observed that heterogeneity was more prominent for LC2/ ad-R cells than for the parental LC2/ad cells (Figure 6B). Particularly, those differences were most significant for the expression level of MYC, suggesting that MYC may play a pivotal role in differentiating these cell lines.
We also conducted a global clustering analysis of gene expression using 205 cells. As expected, when we used all genes for the clustering, we found that individual cells formed clusters depending on their parent cell types (vertical color bar in Figure 6C). Similar results were obtained when we used the 88 ribosomal protein genes to perform the clustering. By contrast, when we examined the cancer-related genes or the EGFR pathway genes, the individual cells of different cell types did not form significant clusters, suggesting that the expression patterns of these groups of genes were intrinsically heterogeneous even in the untreated state. Interestingly, when we used the 'Cancer Gene Census' genes [26], which is a catalogue of genes associated with carcino-genesis in various cancer types, the clusters were still clear between the different cell lines. However, when we considered the data for LC2/ad and LC2/ad-R cells treated with vandetanib, we found that the clusters were occasionally disordered across their originating cell types (Figure 6D; see Figure S17 in Additional file 1 for gene expression changes based on drug treatment). Interest-ingly, while the LC2/ad + vandetanib cells overlapped with LC2/ad cells, LC2/ad-R + vandetanib cells tended to form distinct clusters from LC2/ad-R cells, as if the parental cells responded in a random manner, while the response of the derivative cells was deterministic to some extent (see Figure S18 in Additional file 1 for distributions of cluster sizes and statistical significance of the difference between LC2/ad and LC2/ad-R).
Furthermore, in the case of the Cancer Gene Census genes, we conducted a principle component analysis (Figure 6E). We found that the LC2/ad-R cells, rather
than parental LC2/ad cells, formed relatively tight clus-ters in both the untreated and the vandetanib-treated states. Interestingly, some of the cell clusters of LC2/ ad-R + vandetanib came closer to or partially overlapped clusters of PC-9. These genes may have evolved expres-sion patterns resembling those of PC-9 to avoid the effect of vandetanib on LC2/ad cells. Various patterns of gene expression diversity, some of which are apparent and some of which are latent, may collectively provide a versatile base from which drug resistance could emerge.
Conclusions
In this study, we show gene expression diversity in lung adenocarcinoma cell lines by employing single-cell RNA-Seq analysis. To our knowledge, this is the first study that has described the heterogeneity of cancer cells at the transcriptome level.
We believe that it is unlikely that the results obtained in this study derive from typical technical errors. How-ever, we could not exclude all of the possibilities of false observations. First, we did not use cells that were syn-chronized for the cell cycle. Perhaps consistently, cell cycle-related genes were enriched in the pathways with diverse expression patterns (Figure 2H). Neither could we completely control the micro-environment for each cell. Therefore, the observed differences in the gene ex-pression patterns may reflect the differential representa-tion of the popularepresenta-tion of cells with regard to these factors. Second, we could not evaluate the influence of the systematic bias that was imposed during library con-struction. Inevitably, heavy amplification of the templates was performed for this analysis (also see Figure 1D for a comparison between the average of the single cells and the bulk cells). Noise could also be induced at the initial step, including reverse-transcription, which is particularly difficult to evaluate in the present system. Once harvested, the same cell cannot be used for any validation analyses. In this study, we evaluated variation in the spike-in controls, which were added as RNA at the cell lysis step (Figure 1A). We excluded cells where the tag counts of any of three spike-in controls deviated by more than two standard deviations from the average values from the following analyses. Also, we examined and found the observed average expression levels and relative (See figure on previous page.)
Figure 5Expression changes in response to anti-cancer drug stimulation.(A)Correlation of the average expression levels and the relative divergences between LC2/ad and LC2/ad-R cells for EGFR pathway genes (blue), caner-related genes (red) and ribosomal protein genes (green). Pearson’s correlation coefficients are shown in the plots. The plots of the EGFR and RET genes are highlighted by red and blue boxes, respectively.
(B)Gene expression changes in response to vandetanib treatment in LC2/ad (upper panel) and LC2/ad-R (lower panel) cells. Each gene, plots show fold changes in the average expression levels (x-axis) and the relative divergence. The dotted lines represent the values that were unchanged (fold = 1). Right panels show plots for ribosomal protein genes, the EGFR pathway genes and the cancer-related genes. The color key is as in
divergences were reasonably reproducible between two independent experiments (r = 0.93 and 0.82, respect-ively; Figures 1D (second panel) and 2D). These results should account for overall technical errors, including those induced during the reverse transcription stage. Nevertheless, it remains unclear to what extent they truly represent the collective information within a cell
in vivo, even though they were reproducible (Figure S2B in Additional file 1). Lastly, but no less importantly, we could not attribute the cause of the observed divergences to newly acquired novel genomic mutations or other epigenomic alterations. For each of these issues, fur-ther extensive analyses are required.
In spite of several drawbacks, we believe that this study should lay the foundations for single-cell analysis of cancer cells. Indeed, we have found that gene expres-sion was highly diverse between individual cells, which is characteristic of the genes, pathways and cell lines. We also observed that there is a general tendency that lowly expressed genes show high divergence. This tendency was not systematic, however, since we observed that the degree of divergence varied between genes even when their average expression levels were almost the same. We were not able to identify molecular mechanisms underlying these characteristic divergences, though it is tempting to speculate that there are distinctive determi-nants depending on the involved signaling pathways or gene expression regulatory mechanisms. It is also pos-sible that high relative divergences in lowly expressed genes derived from the inevitably stochastic nature of the transcriptional machineries. Additionally, we exam-ined and found that not only average gene expression levels but also their relative divergences were changed in response to drug treatment. Furthermore, we unexpect-edly found that the expression patterns of several cancer-related genes within a single cell are occasionally more diverse beyond the borders of its originating cell type. In particular, Cancer Gene Census genes showed a unique pattern; such divergence initially became apparent when the cells were treated with a molecular target drug.
Various types of potential divergence in transcriptome regulation may collectively serve as a reservoir for cells to eventually acquire drug resistance. To further clarify this possibility, it is necessary to investigate not only average gene expression levels and their fold changes in
response to anti-cancer drug treatment but also the vari-ance of these genes between individual cells. We believe that further extensive single-cell transcriptome analysis using more cell types in various environmental condi-tions will bring invaluable insight for understanding how diverse phenotypes of cancer cells emerge from a given population of cancer cells.
Materials and methods Data availability
All of the sequence data used in the present study have been registered in the DNA Data Bank of Japan under accession numbers DRA001287 and DRA002730. The graphical view for each gene is also available from our web site at [27].
Cell culture and sequencing
The LC2/ad and PC-9 cell lines were acquired from the RIKEN Bio Resource Center (catalogue numbers RCB0440 and RCB4455, respectively). The VMRC-LCD cell line was provided by the Japanese Collection of Re-search Bioresources (catalogue number JCRB0814). The LC2/ad-R cell line was provided on request. Cell culture mediums were prepared using Dulbecco’s modified Eagle’s medium (DMEM 2, Nissui Pharmaceutical, Tokyo, Japan) for LC2/ad and LC2/ad-R, RPMI medium (RPMI 1640 2, Nissui Pharmaceutical) for PC-9 or Eagle’s minimal es-sential medium (EMEM 1, Nissui Pharmaceutical) for VMRC-LCD, supplemented with 10% fetal bovine serum, MEM Non-essential Amino acid solution (cata-logue number M7145, Sigma-Aldrich, St Louis, MO, USA) and Antibiotic-Antimycotic (catalogue number 15240–062, Gibco/Life Technologies, Carlsbad, CA, USA). The LC2/ad and LC2/ad-R cell lines were cul-tured in collagen type I-coated dishes (IWAKI, AGC Techno Glass, Tokyo, Japan). For vandetanib (catalogue number S1046, Selleck Chemicals, Houston, TX, USA) treatment, vandetanib was administered to the culture medium at a final concentration of 1μM. Six hours after the drug treatment, cells were harvested. For each experi-ment, 106cells were harvested and used for the single-cell RNA-Seq analyses using the C1 system (Fluidigm, South San Francisco, CA, USA). RNA-Seq libraries were con-structed according to manufacturers' instructions as follows. Briefly, 96 cells were captured in the flow cells (See figure on previous page.)
and separated into independent chambers. First-strand cDNA was synthesized and further amplified using the SMARTer system (Clontech, Mountain View, CA, USA). Illumina sequencing libraries were constructed using Nex-tera XT DNA Sample Preparation kit (Illumina, San Diego, CA, USA). After evaluation of the quality and quantity of the constructed RNA-Seq libraries using a BioAnalyzer (Agilent Technologies, Santa Clara, CA, USA), sequencing was performed on the HiSeq2500 plat-form with a 97-base paired-end read. Generated RNA-Seq tags were mapped to the reference human genome (hg19; UCSC) using ELAND. Sequences that mapped to the unique genomic positions allowing two base mismatches were used. RNA-Seq tags that spanned the known splice junctions were also considered. The number of RNA-Seq libraries and RNA-Seq tags used for the analyses are shown in Table 1. The primers for quantitative RT-PCR validation analyses of 85 genes (a standard validation dataset from Fluidigm) were provided as the Human Gx performance panel (P/N 100-5396) and the raw data for individual genes are shown in Additional file 3. These 85 genes were selected from the genes having diverse expres-sion levels and are likely to be expressed in a wide range of cell types [24,28].
Computational procedures
RNA-Seq tag counts were calculated as parts per million mapped tags per kilobase RNA (rpkm). The average expression level of a given gene was calculated as an average of the population of cells. Relative divergence was calculated as standard deviation divided by average gene expression level. The statistical significance of the differences was evaluated by the indicated methods. To select genes showing diverse gene expression, the genes were ordered according to their relative divergences. To select KEGG pathways for which the genes with diverse expression were enriched, a gene with a similar expres-sion level (a less than two-fold difference) was randomly selected for each of the genes. One thousand genes were randomly selected when the genes satisfying this criter-ion exceeded 1,000 genes. Relative divergences between individual cells were compared between the examined gene and the control genes. Statistical deviation of the relative divergence of the examined gene against the background distribution of the control genes was evalu-ated by f-test and genes giving P< 0.05 were selected. Enrichment of the selected more or less diverse genes in a particular KEGG pathway was evaluated by Fisher’s test. The cases were selected when the calculated P< 0.05. To calculate the fold changes in average gene expression levels and their relative standard deviations, genes show-ing average expression levels of >5 rpkm were used, unless noted otherwise. For clustering, a hierarchal clustering program in the bioconductor package of R [29] was used.
Cancer-related genes were selected manually based on [21-23]. The list of Cancer Gene Census genes were obtained from the Cancer Gene Census [26].
To investigate the genomic status of the cancer cell lines, whole-genome sequences (registered in the DNA Data Bank of Japan under accession number DRA001859) [20] were mapped to a human reference genome (hg19, UCSC) using BWA [30] and SAMtools [31] and visualized by IGV [32,33]. To compare mutations in the LC2/ad and LC2/ad-R cell lines, single nucleotide variants (SNVs) and insertion/deletions (indels) were detected using GATK [34,35] and annotated using Polyphen-2 [36,37] and in-house Perl scripts. To remove germline variants and select somatic mutations, we used information provided from the 1000 Genomes Project, the NHLBI Exome Sequencing Project, NCBI dbSNP build 137, COSMIC (v59) and in-house Japanese normal tissues [38-42].
Additional files
Additional file 1: Figure S1.Preparation of single-cell RNA-Seq libraries.
Figure S2.Validation analyses on sequence depth and re-amplification of the templates.Figure S3.RNA-Seq tags representing known driver mutations.Figure S4.Validation analysis using real time RT-PCR assays in individual cells of PC-9.Figure S5Dependency of the relative divergences on the sequence depth for the spike-in controls.Figure S6.Dependency of the relative divergences on the sequence depth for the gene of varying average expression levels.Figure S7.Dependency of the relative divergences on the sequence depth for the cancer-related genes.
Figure S8.Relations between the sequence depths and the number of tags in respective genes.Figure S9.Dependency of the calculated relative divergence on the varying numbers of cells.Figure S10.Information on whole-genome sequences of the cell lines.Figure S11.RNA-Seq tags generated from different cell lines.Figure S12.Amplifications detected by whole-genome sequences.Figure S13.Drug response of LC2/ad and LC2/ad-R cells.Figure S14.Comparison of the gene expression differences between LC2/ad and LC2/ad-R.Figure S15.Relative diver-gences of other house-keeping genes in LC2/ad and LC2/ad-R.Figure S16.Gene expression changes in response to vandetanib.
Figure S17.Gene expression changes of Cancer Gene Census genes.
Figure S18.Size of the clusters in LC2/ad and LC2/ad-R stimulated with vandetanib.Table S2.Comparison of RNA-Seq statistics between bulk and single-cell libraries.Table S4.Primer sequences for real time RT-PCR assays of 13 genes.Table S6.Gene Ontology terms and KEGG pathways enriched for genes with expression divergences that were notable in PC-9 and VMRC-LCD.Table S10.Gene Ontology terms and KEGG pathways enriched for genes that showed fold inductions of≥2 or≤0.5 with regard to average gene expression levels and relative divergences in response to vandetanib.
Additional file 2: Table S1.Detailed statistics of the RNA-Seq tags generated and used in the present study.
Additional file 3: Table S3.A list of 85 genes using quantitative RT-PCR.
Additional file 4: Table S5.Genes with significantly diverse(A)or less diverse(B)expression patterns.
Additional file 5: Table S7.Average expression levels and relative variations of the genes belonging to the EGFR pathway.
Additional file 6: Table S8.Average gene expression levels and relative divergences for the cancer-related genes appearing in Figure 4A.
Additional file 7: Table S9.Lists of genes used for the analysis in
Abbreviations
KEGG:Kyoto Encyclopedia of Genes and Genomes; rpkm: reads per million tags per kilobase mRNA.
Competing interests
The authors declare that they have no competing interests.
Authors’contributions
KT and YS designed and directed the study. KM, HM and KT performed the experiments for drug response. AS and YS performed and analyzed single-cell RNA-Seq. HM, KT and TK coordinated the lung adenocarcinoma cell lines. SS and TK contributed to scientific discussions for designing the study and writing the manuscript. AS, KT and YS wrote the manuscript. All authors read and approved the final manuscript.
Acknowledgements
The authors are grateful to U Sumida, F Iguchi, T Kikuchi, T Horiuchi, Y Ishikawa and K Imamura for technical support. This work was supported by a Grant-in-Aid for Scientific Research on the Priority Area 'Genome Science' from the Ministry of Education, Culture, Sports, Science and Technology of Japan. This work was also supported by the Japan Society for the Promotion of Science (JSPS) through its 'Funding Program for World-Leading Innovative R&D on Science and Technology (FIRST Program)'.
Author details
1Department of Medical Genome Sciences, Graduate School of Frontier
Sciences, The University of Tokyo, Chiba 277-8562, Japan.2Division of TR, The Exploratory Oncology Research and Clinical Trial Center, National Cancer Center, Chiba 277-8577, Japan.3Division of Genome Biology, National Cancer Center Research Institute, Tokyo 104-0045, Japan.4Division of TR, The Exploratory Oncology Research and Clinical Trial Center, National Cancer Center, Tokyo 104-0045, Japan.5Department of Computational Biology, Graduate School of Frontier Sciences, The University of Tokyo, Chiba 277-8562, Japan.
Received: 30 November 2014 Accepted: 18 March 2015
References
1. Weinstein JN, Collisson EA, Mills GB, Shaw KR, Ozenberger BA, Ellrott K, et al. The Cancer Genome Atlas Pan-Cancer analysis project. Nat Genet. 2013;45:1113–20.
2. International Cancer Genome Consortium. International network of cancer genome projects. Nature. 2010;464:993–8.
3. Dean FB, Hosono S, Fang L, Wu X, Faruqi AF, Bray-Ward P, et al. Comprehensive human genome amplification using multiple displacement amplification. Proc Natl Acad Sci U S A. 2002;99:5261–6.
4. Lasken RS. Single-cell genomic sequencing using multiple displacement amplification. Curr Opin Microbiol. 2007;10:510–6.
5. Sasagawa Y, Nikaido I, Hayashi T, Danno H, Uno KD, Imai T, et al. Quartz-Seq: a highly reproducible and sensitive single-cell RNA sequencing method, reveals non-genetic gene-expression heterogeneity. Genome Biol. 2013;14:R31. 6. Ramsköld D, Luo S, Wang YC, Li R, Deng Q, Faridani OR, et al. Full-length
mRNA-Seq from single-cell levels of RNA and individual circulating tumor cells. Nat Biotechnol. 2012;30:777–82.
7. Xue Z, Huang K, Cai C, Cai L, Jiang CY, Feng Y, et al. Genetic programs in human and mouse early embryos revealed by single-cell RNA sequencing. Nature. 2013;500:593–7.
8. Wu AR, Neff NF, Kalisky T, Dalerba P, Treutlein B, Rothenberg ME, et al. Quantitative assessment of single-cell RNA-sequencing methods. Nat Methods. 2014;11:41–6.
9. Shalek AK, Satija R, Shuga J, Trombetta JJ, Gennert D, Lu D, et al. Single-cell RNA-seq reveals dynamic paracrine control of cellular variation. Nature. 2014;510:363–9.
10. Dalerba P, Kalisky T, Sahoo D, Rajendran PS, Rothenberg ME, Leyrat AA, et al. Single-cell dissection of transcriptional heterogeneity in human colon tumors. Nat Biotechnol. 2011;29:1120–7.
11. Suzuki M, Makinoshima H, Matsumoto S, Suzuki A, Mimaki S, Matsushima K, et al. Identification of a lung adenocarcinoma cell line with CCDC6-RET fusion gene and the effect of RET inhibitors in vitro and in vivo. Cancer Sci. 2013;104:896–903.
12. Matsubara D, Kanai Y, Ishikawa S, Ohara S, Yoshimoto T, Sakatani T, et al. Identification of CCDC6-RET fusion in the human lung adenocarcinoma cell line, LC-2/ad. J Thorac Oncol. 2012;7:1872–6.
13. Ju YS, Lee WC, Shin JY, Lee S, Bleazard T, Won JK, et al. A transforming KIF5B and RET gene fusion in lung adenocarcinoma revealed from whole-genome and transcriptome sequencing. Genome Res. 2012;22:436–45. 14. Kohno T, Ichikawa H, Totoki Y, Yasuda K, Hiramoto M, Nammo T, et al.
KIF5B-RET fusions in lung adenocarcinoma. Nat Med. 2012;18:375–7. 15. Lipson D, Capelletti M, Yelensky R, Otto G, Parker A, Jarosz M, et al.
Identification of new ALK and RET gene fusions from colorectal and lung cancer biopsies. Nat Med. 2012;18:382–4.
16. Takeuchi K, Soda M, Togashi Y, Suzuki R, Sakata S, Hatano S, et al. RET, ROS1 and ALK fusions in lung cancer. Nat Med. 2012;18:378–81. 17. Mortazavi A, Williams BA, McCue K, Schaeffer L, Wold B. Mapping and quantifying
mammalian transcriptomes by RNA-Seq. Nat Methods. 2008;5:621–8. 18. Ueda HR, Hayashi S, Matsuyama S, Yomo T, Hashimoto S, Kay SA, et al.
Universality and flexibility in gene expression from bacteria to human. Proc Natl Acad Sci U S A. 2004;101:3765–9.
19. Kanehisa M, Goto S, Furumichi M, Tanabe M, Hirakawa M. KEGG for representation and analysis of molecular networks involving diseases and drugs. Nucleic Acids Res. 2010;38:D355–60.
20. Suzuki A, Makinoshima H, Wakaguri H, Esumi H, Sugano S, Kohno T, et al. Aberrant transcriptional regulations in cancers: genome, transcriptome and epigenome analysis of lung adenocarcinoma cell lines. Nucleic Acids Res. 2014;42:13557–72.
21. Ding L, Getz G, Wheeler DA, Mardis ER, McLellan MD, Cibulskis K, et al. Somatic mutations affect key pathways in lung adenocarcinoma. Nature. 2008;455:1069–75.
22. Imielinski M, Berger AH, Hammerman PS, Hernandez B, Pugh TJ, Hodis E, et al. Mapping the hallmarks of lung adenocarcinoma with massively parallel sequencing. Cell. 2012;150:1107–20.
23. Blanco R, Iwakawa R, Tang M, Kohno T, Angulo B, Pio R, et al. A gene-alteration profile of human lung cancer cell lines. Hum Mutat. 2009;30:1199–206.
24. Eisenberg E, Levanon EY. Human housekeeping genes are compact. Trends Genet. 2003;19:362–5.
25. Flanigan J, Deshpande H, Gettinger S. Current status of vandetanib (ZD6474) in the treatment of non-small cell lung cancer. Biologics. 2010;4:237–43.
26. Futreal PA, Coin L, Marshall M, Down T, Hubbard T, Wooster R, et al. A census of human cancer genes. Nat Rev Cancer. 2004;4:177–83. 27. DBTSS. http://dbtss.hgc.jp/.
28. Eisenberg E, Levanon EY. Human housekeeping genes, revisited. Trends Genet. 2013;29:569–74.
29. Bioconductor. http://www.bioconductor.org/.
30. Li H, Durbin R. Fast and accurate short read alignment with Burrows-Wheeler transform. Bioinformatics. 2009;25:1754–60.
31. Li H, Handsaker B, Wysoker A, Fennell T, Ruan J, Homer N, et al. The Sequence Alignment/Map format and SAMtools. Bioinformatics. 2009;25:2078–9.
32. Robinson JT, Thorvaldsdóttir H, Winckler W, Guttman M, Lander ES, Getz G, et al. Integrative genomics viewer. Nat Biotechnol. 2011;29:24–6. 33. Thorvaldsdóttir H, Robinson JT, Mesirov JP. Integrative Genomics Viewer
(IGV): high-performance genomics data visualization and exploration. Brief Bioinform. 2013;14:178–92.
34. McKenna A, Hanna M, Banks E, Sivachenko A, Cibulskis K, Kernytsky A, et al. The Genome Analysis Toolkit: a MapReduce framework for analyzing next-generation DNA sequencing data. Genome Res. 2010;20:1297–303. 35. DePristo MA, Banks E, Poplin R, Garimella KV, Maguire JR, Hartl C, et al. A
framework for variation discovery and genotyping using next-generation DNA sequencing data. Nat Genet. 2011;43:491–8.
36. Adzhubei IA, Schmidt S, Peshkin L, Ramensky VE, Gerasimova A, Bork P, et al. A method and server for predicting damaging missense mutations. Nat Methods. 2010;7:248–9.
37. Adzhubei I, Jordan DM, Sunyaev SR. Predicting functional effect of human missense mutations using PolyPhen-2. Curr Protoc Hum Genet. 2013;Chapter 7:Unit7.20.
38. The 1000 Genomes Project Consortium. An integrated map of genetic variation from 1,092 human genomes. Nature. 2012;491:56–65. 39. NHLBI GO Exome Sequencing Project (ESP): Exome Variant Server.
40. Sherry ST, Ward MH, Kholodov M, Baker J, Phan L, Smigielski EM, et al. dbSNP: the NCBI database of genetic variation. Nucleic Acids Res. 2001;29:308–11.
41. Forbes SA, Bhamra G, Bamford S, Dawson E, Kok C, Clements J, et al. The Catalogue of Somatic Mutations in Cancer (COSMIC). Curr Protoc Hum Genet. 2008;Chapter 10:Unit 10 11.
42. Forbes SA, Bindal N, Bamford S, Cole C, Kok CY, Beare D, et al. COSMIC: mining complete cancer genomes in the Catalogue of Somatic Mutations in Cancer. Nucleic Acids Res. 2011;39:D945–50.
Submit your next manuscript to BioMed Central and take full advantage of:
• Convenient online submission
• Thorough peer review
• No space constraints or color figure charges
• Immediate publication on acceptance
• Inclusion in PubMed, CAS, Scopus and Google Scholar
• Research which is freely available for redistribution