Technology (IJRASET)
Optimization of Forming Process Parameters for
Appropriate Distribution of Wall Thickness in
Sheet Metal Component
Archana Prabhakar Petkar1, Digambar B. Zoman2
1
Student, ME (Design Engineering) IInd Year, K.C.T.’s Late G. N. Sapkal College of Engineering, Nasik 2
Asst. Prof., K.C.T.’s Late G. N. Sapkal College of Engineering, Nasik
Abstract— While obtaining the final sheet metal component the defects are occurred in sheet metal forming process which are reduced by varying the forming process parameters by trial and error method. This causes loss in terms of money and time. The final part in its desired quality limits is obtained by selection of various essential parameters which affect more on the total process and varying their values to their optimum values. This requires tool design expertise and thorough knowledge of the behavior of process according to these parameters. Expensive trial and error methods are replaced by the virtual simulations of these trials using Finite Element Method (FEM) based software and optimization is carried out by the Design of experiments (DOE) technique. This technique can replace the need of industrial experience and also save a lot of expenses and time. This project involves the simulation of the forming of sheet metal component by using Altair’s HyperForm. The foremost effective parameters are identified. The results of optimization are validated by actual formed sheet metal component at industry using same optimized parameters.
Keywords— ANOVA, Design of experiments (DOE), Finite element method, Minitab, Simple draw, Taguchi, Thinning.
I. INTRODUCTION
The sheet metal forming is a key manufacturing technology of automotive component because of its process flexibility for a quick realization of design shifts at a possible cost. Despite of the geometric construction and therefore the assembly function of a sheet metal part, the main objective of stamping die-makers is to design and manufacture a set of forming tools that can be used dependably for a defect-free sheet metal product within the desired dimensional tolerances and the required surface quality. In metal forming, the form change is accomplished by plastic deformation solely and therefore there is complete use of metal. This is the primary advantage compared to machining practices. In machining processes the shape modification is finished by removing material from the component. Engineering research and improvement is to decide the perfect resources of producing complete products having lesser defects and scrap.
In forming of sheet metal component the forming errors like wrinkling, thinning etc. are commonly observed at the very first tool tryout. In single-stage drawing of sheet metal blank the metal is drawn over various surfaces and varying radii, this makes the prediction of defects complicated. The Finite element simulation of sheet metal forming is increasingly applied to eliminate forming defects, predict and optimize process parameters and to predict stresses / strains in sheet metal blank to prevent blank failure. To determine the result of the process parameters on the final forming quality is very difficult in sheet metal forming process because forming process experience very complicated deformation. These process parameters got to be determined for the optimum forming condition before the process design. Traditional method to obtain optimum process parameter is time consuming and expensive. Throughout the years, the sheet metal forming industry experiences technological advances that allowed the production of complex parts. However, it still lies heavily on trial-error and the expertise of skilled workers. The quality of the final product shape is determined by the tools design, process parameters, shape and material of the blank. It is important to carefully consider all these factors prior to manufacturing otherwise a defective product could result [1].
Design of experiment (DOE) is the main issue to determine accuracy and efficiency of process parameters. For optimization the Design of experiment method using Taguchi orthogonal arrays is used for forming process parameters optimization.
This sheet metal component is formed by simple drawing process. Manufacturing of automotive assembly is carried out by forming sheet metal components in assembly separately and then welding them.
Technology (IJRASET)
carried out FEM simulation for an industrial part which is to be formed by deep drawing operation.Page Layout
M.J. Worswick [3], given detail information regarding how sheet metal forming operation are carried out and what are effects of different parameters such as tool geometry, friction between sheet and tool and various loads on sheet metal. Also explained latest advances related to the numerical simulation of stampings which stated methodologies for foreseeing metal formability, containing damage-based models for both the large as well as small variety. The evolution of calculating competency improving implicit as well as explicit solver algorithms has delivered the required computational rapidity to support increasing levels of practicality in mathematical representation of material performance, lubrication and tooling geometry, along with increased levels of accuracy. Tan C. J. et al [4], explained various factors affecting the final thickness of the deep drawn sheet metal part. The small decrease in thickness is mainly because of reduction in blank thickness. Subsequently the fatigue strength of the disk abruptly reduces even for a small reduction in thickness at the inner corner, a tailored blank with local thickening at the area corresponding to the inner corner produced by stamping was used in the multistage stamping to increase the thickness at the inner corner.
Makinouchi [5], described different examples for simulation, in those examples defects such as, wrinkles, surface deflection are predicted and forming limit conditions are studied. So, if there is a need for obtaining valuable data within moderate time as well as cost, one has to bind the tenacity of simulation.
A Makinouchi [5], described different examples for simulation, in those examples defects such as, wrinkles, surface deflection are predicted and forming limit conditions are studied. So, if there is a need for obtaining valuable data within moderate time as well as cost, one has to bind the tenacity of simulation.
Sandeep Patil et al [6], used Altair’s HyperForm to simulate the process of sheet metal forming and presented few case studies related to deep drawing simulation of cylindrical shells to understand sheet metal behavior. The concepts such as metal flow during drawing, severity in drawing and die requirement for deep drawing of cylindrical shells explained for education purpose with education software. He also provided methodology for simulation of metal forming process using Altair’s HyperWorks package. Sandeep Patil et al [7], analyzed trapezoidal cup forming using HyperForm. Further described the approach for predicting the effect of different factors which involve in the forming of sheet metal component and the information of post processed outcomes which is used throughout the design of product and the tool. Altair’s HyperForm Radioss predictive tool is used in this study. The forming limit condition is studied for several circumstances of different factors affecting forming of component like blank holder force, coefficient of friction between metals and numerous simulation tryout sets are established and thickness changes are investigated. Major components required for simulation of sheet metal forming as die, forming punch, blank and binder are developed for simulation tryout.
R. Padmanabhan et al [8], employed Taguchi method to identify the relative influence of each process parameter. A reduced set of finite element simulations are carried out as per the Taguchi orthogonal array. Based on the predicted thickness distribution of the deep drawn circular cup and analysis of variance test, it is evident that die radius has the greatest influence on the deep drawing of stainless steel blank sheet followed by the blank holder force and the friction coefficient. Further, it is shown that a blank holder force application and local lubrication scheme improved the quality of the formed part.
In this paper study the panel lower plenum is observed to be having an error thinning. This error is being minimized at the plant by optimizing the forming process parameters by making use of experience of skilled designers and the factors which are affecting the process for thinning are determined by optimization of influencing process parameters in Minitab software using Taguchi method is done. Hence cost of experimentation, cost of die rework and time of experimentation are trial and error method. Virtualization of this process by taking trials in a computer software i.e. Altair’s HyperForm and saved.
III. METHODOLOGY
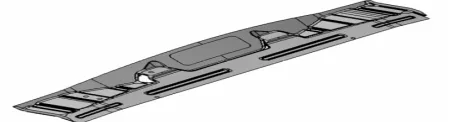
A. Modeling of component
[image:3.612.196.421.646.707.2]Modeling of wheel disk was done in CATIA V5R22 as shown in Fig. 1 as per component specification and IGS provided by R&D department of the industry. Fig.1 shows isometric view of Panel lower Plenum.
Technology (IJRASET)
B. Specifications of component
1) Material – EDD513 SS4011
2) Yield strength (YS) – 183.5 kg/mm2
3) Ultimate tensile strength (UTS) – 279.7 kg/mm2
4) Thickness – 0.7mm
5) Developed Blank – (1630X443) mm
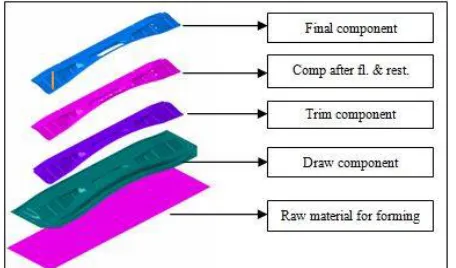
C. Complete Panel Lower Plenum Forming Process
The complete Panel lower plenum is formed in five stages shown below in Fig.2 and given below;
1) Draw operation
2) Trim operation
3) Flange & Restrike operation
4) Hole & flange operation
[image:4.612.198.426.259.393.2]5) Pocket & flaring operation
Fig. 2 Complete Component Forming Process
D. Mathematical draw calculations
N Given data:-
1) Draw perimeter = 3391 mm
2) Draw height (h) = 105 mm
3) Draw constant (K) = 0.6-0.7
a) To calculate punch diameter (d) in mm
Punch diameter (d) = Punch perimeter/π
= 3391/π
= 1079 mm
b) To calculate h/d ratio to find no. of draw required
Therefore,
0.097
0 < h/d < 0.75- Simple draw 0.75 < h/d < 1.5 - Deep draw
Hence simple draw is required for complete forming of this sheet metal component
Technology (IJRASET)
=
= 1272 mm
d) To calculate draw force (F)
F= 230279 kg F= 230 Ton
e) Blank holder load (BHL)
BHL = 20% of draw force (F) = 46 Ton
= 46000 kg
f) Draw Tonnage (P) = F + BHL
= 230+ 46 = 276 Ton = 276000 kg Considering Factor of safety 25% then,
Draw Tonnage = 1.25 X 276 = 345 Ton = 345000 kg
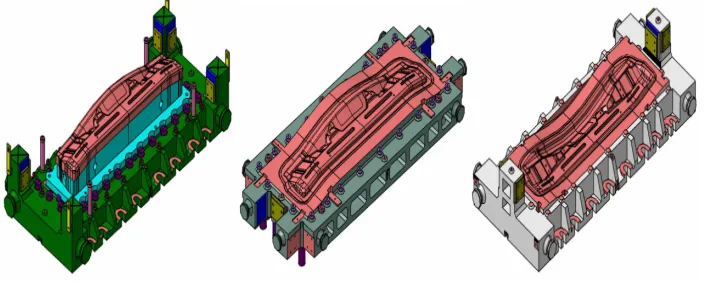
E. Modelling of forming tools
[image:5.612.137.491.448.597.2]The tools required for the forming of Sheet metal component are designed as per above process and wheel shape, and modeling of tools is done in CATIA-V5 software (CAD s/w). The tools modeled for the single stage forming stage is shown in Fig.3;
Fig. 3 Forming Tool model in CAD
F. Simulation of drawing operation
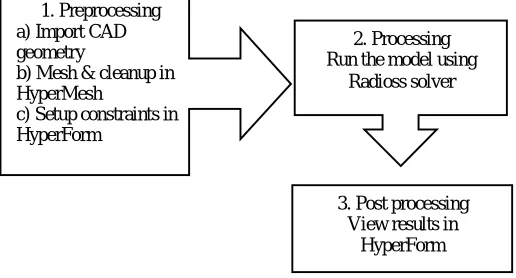
The general procedure as mentioned in the Fig. 4 below is followed and multi-stage simulation is carried out using Altair’s HyperForm software.
The actual process of component forming is to be transferred into the simulation software, hence the data for simulation are collected. The values of required press tonnages, blank holder loads and contact friction coefficients are calculated. This data is to be used to simulate the process in software. Simulation steps are explained in Fig.4.
Technology (IJRASET)
[image:6.612.174.432.103.242.2]HyperWork’s inbuilt Incremental Radioss solver. The similar macros are selected suitable for our processes.
Fig. 4 Steps in simulations
G. Simulation Results
After simulation of multi-stage forming process in single-stage manager of HyperForm using Incremental Radioss as solver. The results of simulation are viewed in HyperView and the results for %thinning after forming stage are shown in Fig.5.
By the time simulation is carried out simultaneously experimental run for same design of tools is done and the profile of final component disk is checked over and thickness at various points is measured, as in Fig.6. The maximum %thinning observed on the final component is observed 18%, which is not a desirable result. Next the %thinning is to be reduced by optimizing the process parameters. The results of simulation process and actual experiment for thickness variation are compared.
Fig. 5 Simulations result for forming operation Fig.6 Actual component formed after tryout From the comparison of results, we get that simulation results are in good agreement with the actual results (± 6 % error). Hence we can replace the actual process by simulation for the future trials required for the optimization of forming process parameters by using Taguchi method to get %thinning below the permissible limits.
H. Design of experiments using Taguchi’s Orthogonal Arrays
We will use Design of Experiments (DOE) using Taguchi’s design for optimization of these factors by designing the experiments rather than carrying out random experiments.
The basic steps associated with Design of experiments (DOE) using Taguchi are;
1) Experiments for selected influential factors
2) The statistical analysis of the data
3) Evaluate most influential factors
4) Find the optimized value from Taguchi analysis.
5) Carry out experiments
6) The conclusions reached and recommendations made as a result of the experiment. 1. Preprocessing
a) Import CAD geometry
b) Mesh & cleanup in HyperMesh
c) Setup constraints in HyperForm
2. Processing Run the model using
Radioss solver
3. Post processing View results in
Technology (IJRASET)
I. Collection of Different Factors for Screening Experiments
The thinning error has been analyzed for influence of factors and it is observed that punch corner radius, die corner radius, blank holder load and friction between contact surfaces are the factors that affect the thinning in drawing processes. For thinning error influential factors are selected from forming stages are as shown in Table I.
TABLEI
SELECTED FACTORS AND THEIR LEVELS
Factors influencing % thinning
Levels
Level 1 Level 2 Level 3
Die radius (R1) in mm 18 20 22
Punch radius (R2) 19.2 20.2 18.2
Blank holder force (BHF) 35 40 45
Contact friction
coefficient (F) 0.125 0.25 0.375
Draw tonnage (P) 250 325 350
Binder stroke (h) 110 100 120
Draw bead height (DBH) 6 8 10
Based on Taguchi method, the L27-OA was constructed. The reason for using L27-OA is to evaluate the significance of interaction terms. Virtual simulation experimentation are carried out using Altair’s HyperForm software. Results in terms of %thinning at the end of forming stage are shown in the Table II.
TABLEII
SIMULATION EXPERIMENTS AND RESULTS
SR R
1 R2
BH
L P
B S
DB
H F
% THIN.
SNR A
1 2
0 19.2 35
35 0
10
0 6
0.1
25 27.42
-28.76 13
2 2
0 19.2 35
35 0
11
0 8
0.2
5 22.89
-27.19 29
3 2
0 19.2 35
35 0
12
0 4
0.3
75 18.37
-25.28 22
4 2
0 20.2 40
30 0
10
0 6
0.1
25 20.18
-26.09 84
5 2
0 20.2 40
30 0
11
0 8
0.2
5 17.65
-24.93 49
6 2
0 20.2 40
30 0
12
0 4
0.3
75 22.13
-26.89 96
7 2
0 18.2 45
32 5
10
0 6
0.1
25 20.27
Technology (IJRASET)
8 2
0 18.2 45
32 5
11
0 8
0.2
5 20.74
-26.33 62
9 2
0 18.2 45
32 5
12
0 4
0.3
75 25.22
-28.03 49
10 2
2 19.2 40
32 5
10
0 8
0.3
75 18.06
-25.13 44
11 2
2 19.2 40
32 5
11
0 4
0.1
25 18.54
-25.36 22
12 2
2 19.2 40
32 5
12
0 6
0.2
5 19.23
-25.67 96
13 2
2 20.2 45
35 0
10
0 8
0.3
75 24.69
-27.85 04
14 2
2 20.2 45
35 0
11
0 4
0.1
25 18.16
-25.18 23
15 2
2 20.2 45
35 0
12
0 6
0.2
5 19.86
-25.95 96
16 2
2 18.2 35
30 0
10
0 8
0.3
75 20.63
-26.29
17 2
2 18.2 35
30 0
11
0 4
0.1
25 22.1
-26.88 78
18 2
2 18.2 35
30 0
12
0 6
0.2
5 17
-24.60 9
19 1
8 19.2 45
30 0
10
0 4
0.2
5 15.35
-23.72 22
20 1
8 19.2 45
30 0
11
0 6
0.3
75 22.27
-26.95 44
21 1
8 19.2 45
30 0
12
0 8
0.1
25 19.74
-25.90 69
22 1
8 20.2 35
32 5
10
0 4
0.2
5 25.18
-28.02 11
23 1
8 20.2 35
32 5
11
0 6
0.3
75 28.87
Technology (IJRASET)
24 1
8 20.2 35
32 5
12
0 8
0.1
25 30.35
-29.64 32
25 1
8 18.2 40
35 0
10
0 4
0.2
5 26.14
-28.34 61
26 1
8 18.2 40
35 0
11
0 6
0.3
75 27.94
-28.92 45
27 1
8 18.2 40
35 0
12
0 8
0.1
25 25.31
-28.06 58
J. Analysis of data
After conducting the experiment, the results were converted into S/N ratio values. The final L27-OA displaying response values and
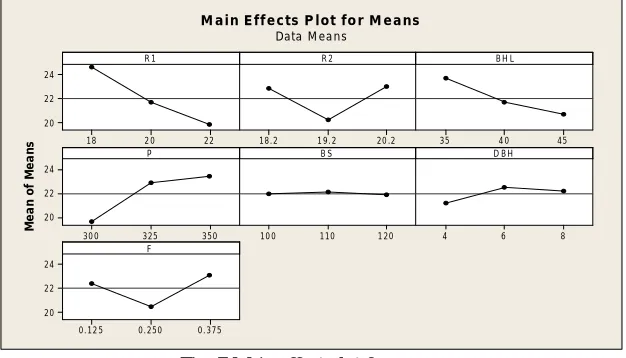
their corresponding S/N ratio values for % thinning error are shown in Figure 11. For these
experimentation and analysis using Taguchi results are Main Effects Plot. Main effects plot for the main effect terms viz. factors R1, R2, BHL, P, BS, DBH and F are shown in Fig.7. From the main effect plots, it has been observed that % thinning decreases.
22 2 0 18 24 22 20 20 .2 1 9. 2
18. 2 35 4 0 45
350 325 30 0 24 22 20 1 20 110
10 0 4 6 8
0. 375 0. 250 0. 12 5 24 22 20 R 1 M e a n o f M e a n s
R 2 B H L
P B S D B H
F
[image:9.612.150.463.327.506.2]M ain E ff e cts P lot fo r M e ans Data M ea ns
Fig. 7 Main effect plot for means
K. Analysis of Variance for Means (ANOVA)
[image:9.612.198.451.610.704.2]The Analysis of variances (ANOVA) is carried out for the experiments and results of ANOVA are shown in Fig.8. The signal-to-noise ratio (S/N) is originally defined as the ratio of the signal to the random signal-to-noise. Higher values of the S/N ratio indicate the controllable factor settings that can minimize the effects of the uncontrollable factors. Therefore, the S/N ratio is a quality control indicator in which it reflects the influence of changing any process parameters on the performance of the process.
Technology (IJRASET)
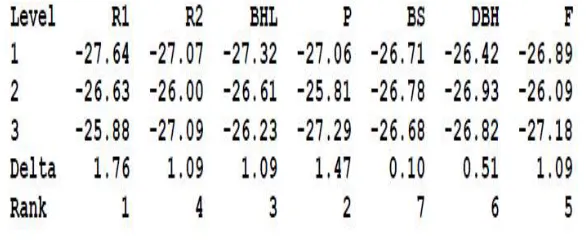
[image:10.612.163.456.174.295.2]L. Response table for mean (Smaller is better)
Fig. 9 Response table for means Taguchi’s predictions for optimum %thinning results are collected as shown in Fig.10.
Fig. 10 Taguchi analysis predictions
By doing Taguchi analysis and analysis of variances (ANOVA), we got the factors which influence more on % thinning is selected.
IV. RESULTSANDDISCUSSION
The optimum values for influential factors for thinning % less than 20% i.e. 15.35% are obtained from Taguchi’s prediction.
A. Die radius (R1) = 20 mm
B. Punch radius (R2) = 19.2 mm
C. Blank holder load in Tons (BHL) = 35000 kg
D. Draw tonnage (P) in Tons= 350000 kg
E. Binder stroke (BS) in mm = 100 mm
F. Draw Bead height (DBH) = 6 mm
Technology (IJRASET)
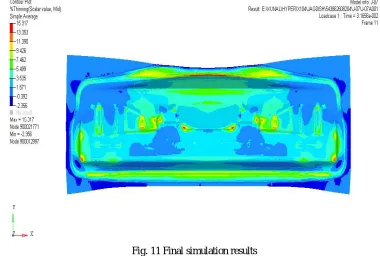
[image:11.612.117.497.107.363.2]Now the simulation the whole process with these predicted optimized settings is carried out, and the results of this simulation for %thinning at the final third forming stage are shown in Fig. 11.
Fig. 11 Final simulation results
The maximum %thinning observed in this process is 15.35%, which proves the optimization was successful till the simulation is concerned. Now, this virtual simulation experiments and the optimization results are to be validated with actual experimental run at industry. Hence, we manufactured the tooling and one experiment is carried out over actual metal sheet in industry and the part is analyzed for thinning error and the % thinning observed on the final part is 15 %.
V. CONCLUSION
TIn lower panel plenum forming process blank holder load, draw tonnage, die and punch corner radius, contact friction, bead height & draw stroke are observed to have most influence on the % thinning error and thus contributed to improving the process’s reliability. This study has shown the application of Simulation and Taguchi method on the optimization of forming process parameters to eliminate the thinning error. The level of importance of the process parameters is determined by using ANOVA. The simulation experiment was successful in terms of achieving the objective of experiment. Hence by using the simulation tool (Altair’s HyperForm) and optimization of forming process parametershe optimum values for influential factors for thinning % less than 20% i.e. 15.35% are obtained from Taguchi’s prediction. using Taguchi, the error of thinning in Lower panel plenum is eliminated.
REFERENCES
[1] Rohit S. Birajdar, Optimization of Forming Process Parameters for Appropriate Distribution of Wall Thickness in Car Wheel Disk using FEM and Taguchi, International Journal of Science and Research (IJSR) ISSN (Online): 2319-7064, April 2015.
[2] D. H. Nimbalkar, Analysis of Sheet Metal Component using Numerical and F.E. Method, International Journal of Research in Aeronautical and Mechanical Engineering, vol. 2, no. 5, May 2014
[3] M. J. Worswick, Numerical simulation of sheet metal forming, Metal forming science and practice, vol. 08, pp. 135-181, 2002.
[4] Tan C. J., Mori K., Abe Y., Multi-stage stamping of high strength steel wheel disk, Journal of Materials Processing Tech., vol. 01, no. 01, 2007. [5] A. Makinouchi, Sheet metal forming simulation in Industry, Journal of Materials processing Technology, vol. 60, pp. 19-26, 1996.
[6] S. Patil, Y. Chapke, S. Andhale, Relevance of sheet metal forming simulation using Altair’s HyperForm for academics, in HyperWorks technology conference, Pune, Maharashtra, India, 2012.
[7] S. Patil, Dr. R. G. Tated, Formability analysis for trapezoidal cup, in HyperWorks technology conference, Aurangabad, Maharashtra, India, 2011.