R E S E A R C H
Open Access
Comparative transcriptomics reveals the
conserved building blocks involved in
parallel evolution of diverse phenotypic
traits in ants
Claire Morandin
1,2*, Mandy M. Y. Tin
3, Sílvia Abril
4, Crisanto Gómez
4, Luigi Pontieri
5, Morten Schiøtt
5,
Liselotte Sundström
1,2, Kazuki Tsuji
6, Jes Søe Pedersen
5, Heikki Helanterä
1,2and Alexander S. Mikheyev
3,7*Abstract
Background:Reproductive division of labor in eusocial insects is a striking example of a shared genetic background giving rise to alternative phenotypes, namely queen and worker castes. Queen and worker phenotypes play major roles in the evolution of eusocial insects. Their behavior, morphology and physiology underpin many ecologically relevant colony-level traits, which evolved in parallel in multiple species.
Results:Using queen and worker transcriptomic data from 16 ant species we tested the hypothesis that conserved sets of genes are involved in ant reproductive division of labor. We further hypothesized that such sets of genes should also be involved in the parallel evolution of other key traits. We applied weighted gene co-expression network analysis, which clusters co-expressed genes into modules, whose expression levels can be summarized by their‘eigengenes’. Eigengenes of most modules were correlated with phenotypic differentiation between queens and workers. Furthermore, eigengenes of some modules were correlated with repeated evolution of key phenotypes such as complete worker sterility, the number of queens per colony, and even invasiveness. Finally, connectivity and expression levels of genes within the co-expressed network were strongly associated with the strength of selection. Although caste-associated sets of genes evolve faster than non-caste-associated, we found no evidence for queen- or worker-associated co-expressed genes evolving faster than one another.
Conclusions:These results identify conserved functionally important genomic units that likely serve as building blocks of phenotypic innovation, and allow the remarkable breadth of parallel evolution seen in ants, and possibly other eusocial insects as well.
Keywords:Social insects, Caste differentiation, Gene expression, Parallel evolution, Phenotypic plasticity, Gene co-expression network
Background
Understanding how novel phenotypes arise and are maintained is a major goal of evolutionary biology [1–3]. Parallel evolution of conserved sets of genes across related species may lead to parallel appearances of phenotypes in response to similar selective regimes
[4, 5] (e.g., antibiotic resistance [6], nacre building in molluscs [7]). Redeployment of pre-existing genes and pathways permits the parallel evolution of phenotypic
novelty [5, 8–10]. Furthermore, novel phenotypes
fre-quently arise through functional changes in conserved developmental pathways in closely related species (e.g., the Wnt signaling pathway [11], wing pigmenta-tion in butterflies [12, 13]). It is well recognized that most genes act as members of biological pathways, or of co-regulated modules [14], yet how gene networks * Correspondence:[email protected];[email protected]
1
Centre of Excellence in Biological Interactions, Department of Biological and Environmental Sciences, University of Helsinki, Helsinki, Finland
3Okinawa Institute of Science and Technology, 1919-1 Tancha Onna-son, Kunigami-gun, Okinawa 904-0412, Japan
Full list of author information is available at the end of the article
evolve and to what extent they play a role in the origin of phenotypic novelty remain unsolved [15].
Reproductive division of labor in social insects provides an extreme example of phenotypic plasticity, in which a single totipotent egg may develop into either a reproduct-ive queen or a non-reproductreproduct-ive worker [16]. As a result, eusocial insects decouple behavioral and physiological traits into these two complementary phenotypes, called castes. Eusociality is one of the major transitions in evolu-tion [17], and has arisen independently multiple times in the order Hymenoptera, comprising wasps, bees, and ants
[18]. Building on the evolution of eusociality, queen–
worker polymorphisms have also evolved independently in several lineages. To understand the molecular mecha-nisms underlying social insect polymorphism, previous studies have primarily examined caste-biased gene expres-sion patterns in a small number of distantly related species, typically across separate origins of eusociality
[19–25]. These studies have found a small number of
genes repeatedly associated with reproductive division of labor, but a comprehensive, comparative characterization of queen and worker transcriptional architecture has been lacking.
Evolution of reproductive division of labor in social insects has interested evolutionary biologists since Darwin. Sterile workers cannot directly transmit traits they possess [26, 27], but worker phenotypes respond to natural selection indirectly, through the action of kin selection, giving rise to a diverse array of morphological and behavioral adaptations. Despite the low overlap across eusocial species in the number of consistently caste-biased genes, the common assumption that castes have distinct transcriptional profiles has motivated a wide range of studies examining patterns of selection acting on queen versus worker protein sequences, which are believed to exist in separate selective environments [26, 27]. Recent studies have shown that genes with caste-biased expression evolve faster at the sequence level than their non-biased counterparts, although the detected direction of selection for queen- and worker-biased genes was sometimes opposite [28, 29]. However, other factors may also affect the strength of selection acting on caste-biased genes. Some of them are directly linked to social insect life histories, such as an increased number of queens per colony, which is predicted to affect the strength of selection acting on the worker genes by weakening relatedness within colony [27]. Also, based on extensive data from a wide variety of species (ranging from yeast [30] to mammals [31]), we know that evolution of genes is shaped to a large extent by their levels of expression and interactivity with other genes [32]. More recently, this has also been confirmed in social insects [33, 34]. However, the regulatory architec-ture that governs queen and worker phenotypes remains
largely unknown in social insects. Thus, inferring the glo-bal regulatory environment of caste-biased genes is the key to understanding their long-term evolution.
The idea of a shared “genetic toolkit” across the sev-eral eusocial lineages in Hymenoptera is based on the Evo-Devo conceptual framework, which has shown that convergent use of conserved sets of genes is often in-volved in animal development and morphological innovation [20, 21, 35–37]. A recent study [24] identified only a small number of genes (15) constantly differen-tially expressed across three distantly related hymenop-teran species, but more overlap at the level of pathway and biological function (five KEGG (Kyoto Encyclopedia of Genes and Genomes) pathways, five enriched Gene Ontology (GO) functional categories).
In the current study, we take a novel approach to study caste differentiation, and use weighted gene co-expression network analysis (WGCNA) to define conserved sets of co-regulated genes underlying queen and worker pheno-typic traits, and other ant phenopheno-typic traits. WGCNA analysis provides an overview of the transcriptomic organization [38, 39], and the relationships between sets of genes with external, biological traits [40]. This is a more complex approach than traditional pairwise differential gene expression since it takes into consideration the rela-tionships between genes via pairwise correlations between gene expression profiles. WGCNA allows the identifi-cation of modules of co-expressed genes constructed from the expression profiles of all individuals simul-taneously by using a hierarchical clustering approach. This step operates on all data simultaneously and does not require any a priori information about the biological source of sequenced libraries (e.g., which were made from queens and which from workers). Instead, after constructing the gene modules, each module global expression profile can be correlated with external traits to look for significant associations [40].
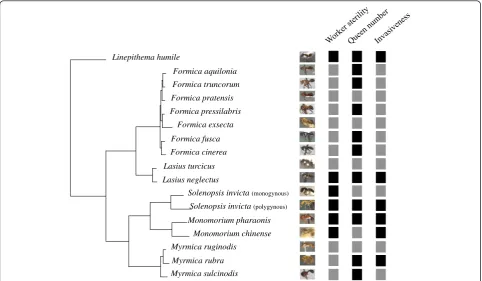
We identified common transcriptional profiles in female castes (queens and workers) from 16 ant species (includ-ing two social forms ofSolenopsis invicta) from three sub-families, which differed in a variety of key traits (Fig. 1). We found that connectivity, expression levels and their in-teractions were strongly correlated with evolutionary rates of protein coding genes. The inferred modules are in-volved in caste phenotypes and other derived traits im-portant to social evolution, such as complete worker sterility, the number of queens per colony, and even the ecological invasiveness of a species. These results suggest that evolutionarily stable modular genetic networks participate in phenotypic maintenance of reproductive division of labor. However, in addition to caste differenti-ation, these modules play other roles, and parallel co-option of these regulatory building blocks may also result in repeated evolution of complex phenotypes.
Results
Assembly of transcriptomes
We sequenced 100 libraries (50 each from queens and workers), representing three biological replicates of each
caste (two replicates for Formica exsecta [19]), using
whole-body samples. We recovered 719 Gb (on average
42 Gb per species) of 100-bp paired-end reads. Follow-ing quality filterFollow-ing, we constructed a de novo transcrip-tome for each species separately using Trinity (release 2013-02-25 [41, 42]). The initial transcriptomes had a total assembly length between 87.4 Mb and 620.8 Mb, and the number of contigs varied between 77,922 and 161,555. The transcriptome contigs were cleaned from probable exogenous RNAs and only contigs that showed a significant BLAST hit to at least one of the nine
pub-lished hymenopteran genomes (seven ant species, Apis
mellifera, andNasonia vitripennis) were kept for further analysis (on average 60 % of the contigs), thus providing
evidence that the contigs are “true” genes and not
sequencing or assembly artifacts. De novo assembly enables functional genomic studies, but has the potential for mis-assemblies [43] and consequent biases in down-stream analyses. Also, we focused on the presence of conserved co-expressed sets of genes, and not on the presence of taxonomically restricted genes, which are not likely to be conserved across related species. We made the choice to focus on“true”genes rather than un-confirmed contig expression patterns. The initial and final number of contigs can be found in Additional file 1. After these quality-filtering steps, the final Trinity
Solenopsis invicta(monogynous) Linepithema humile
Formica truncorum Formica pratensis
Formica aquilonia
Formica pressilabris Formica exsecta
Formica cinerea Formica fusca
Lasius neglectus Lasius turcicus
Monomorium pharaonis Monomorium chinense Solenopsis invicta(polygynous)
Myrmica ruginodis Myrmica rubra Myrmica sulcinodis
[image:3.595.57.540.393.674.2]assemblies contained between 26,666 (Myrmica sulcino-dis) and 77,633 contigs (F. exsecta), with an average num-ber of 44,171 contigs. In total, 167,918 transcripts from the 16 species were assigned to 9859 orthologous gene groups (OGGs).
Constructing the ant gene co-expression network for all 16 species
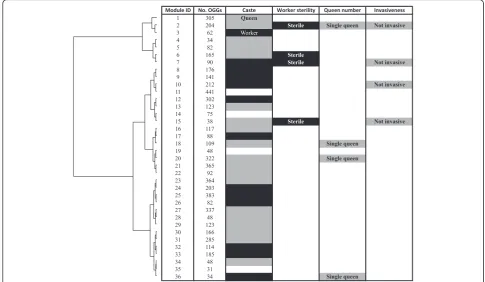
We used the WGCNA package [40] to construct a weighted gene co-expression network analysis (WGNCA) on the entire data set using the mean of normalized ex-pression counts for each OGG. WGCNA takes correla-tions between gene expression patterns across sequenced libraries and aggregates genes with similar profiles into ‘modules’. In addition to reducing the dimensionality of data in this manner, a gene co-expression network also describes connections between genes, which can be used to study their possible interactions and network-level properties [39, 44]. A total of 9859 OGGs of expression data from all 16 species were analyzed with the WGCNA package [40]. The input dataset consists of a table with each row representing one of the 9859 OGGs and each column one of the 100 samples (Additional file 2). Modules of co-expressed genes are inferred using the expression profiles of each sample regardless of the species and caste. After the cleaning step, 2432 OGGs were subsequently removed from the calculation owing to too many missing samples or zero variance, which may affect our ability to detect gene co-expression (Additional file 3). After merging modules of highly co-expressed OGGs, the final co-expression networks comprised 36 modules with >30 OGGs with an average number of 206 (standard deviation 118) (Fig. 2). A total of 5989 OGGs (75 % of the total number of OGGs) initially analyzed were assigned to co-expressed modules, and each module contains expression data from all 16 species.
An online resource has been created to simplify visualization of module organization, particularly the roles of key genes (the website is available at http://mikheyev-lab.github.io/Comparative-transcriptomics-of-ants/). The online tool allows users to browse each module individu-ally and to visualize expression levels and interactions between key genes directly.
Conserved gene co-expression modules correspond to female caste traits
We calculated the eigengene, which is a single value for each sample for each module representative of the gene ex-pression profiles of the samples in a module. The extent of module involvement in various biological processes can be tested by correlating eigengenes with external traits, such as phenotypes [38, 40]. To test the hypothesis that conserved sets of genes are involved in queen/worker phenotypic dif-ferentiation, we investigated the relationship between the
eigengenes and the caste phenotypic traits, while controlling for any phylogenetic bias in the dataset, using a phylogen-etic mixed model implemented in the MCMCglmm pack-age [45]. Expression of 32 out of 36 modules was significantly correlated with one of the two female castes (Fig. 2; Additional file 4; worker caste, 13; queen caste, 19). WGCNA does not use information on caste-specific differ-ential gene expression when inferring modules, so modules that correlated strongly with caste were inferred by WGCNA without a priori knowledge about caste-biased ex-pression patterns, and include both caste-biased and non-caste-biased genes (Additional file 5). Each module repre-sents a set of co-expressed (and presumably interacting) genes [46] that has been conserved across the ant phylogeny (Fig. 2; Additional file 6).
To gain insight into the biological relevance and func-tional significance of modules, we performed GO enrich-ment analysis on the OGGs in each module. Complete lists of BLAST annotations and GO terms associated with each module are available in Additional files 7 and 8. The modules are enriched for specific biological func-tions related to either worker or queen phenotypes. For instance, two worker-associated modules (7 and 10) are linked to behavior and sensory perception, in accordance with what we would expect from their life history traits (Table 1; Additional file 8) [47].
Modules are co-opted for diverse phenotypic traits
Because genes and regulatory modules involved in queen and worker phenotypes may contribute to other life-history traits, we were interested to know whether mod-ules associated with caste explain other important pheno-typic traits of social insects, including the extent of worker sterility, the number of colony queens, and invasiveness. We found eight modules that were correlated with mul-tiple biological traits (Fig. 2; Additional file 4). Interest-ingly, several modules were associated with similar traits, suggesting that the evolution of some traits may be linked. e.g., modules 2, 7, and 15 were all associated with the queen caste, worker sterility, and non-invasiveness. Simi-larly, modules 18, 20, and 36 were associated with caste traits and single-queen colonies. More generally, it ap-pears that the same modules play a role in influencing bio-logical traits beyond caste differentiation. Although we focused on traits most likely arising from queen–worker differences, which was the major axis of variation in the data set, it is possible that the same modules may play a role in a wide variety of other traits.
Module association with caste does not directly influence protein sequence evolution
we compared dN/dS, expression levels, and connectivity
values between OGGs in caste-associated and non-caste-associated modules. OGGs in worker-non-caste-associated modules
had significantly higher dN/dS than OGGs in
queen-associated modules (generalized linear model (GLM),
p= 0.01; Fig. 3), and OGGs in non-caste-associated
modules (GLM, p= 0.016). OGGs in queen-associated
modules and in non-caste-associated modules were not different to each other in terms ofdN/dS(GLM,p= 0.43;
Fig. 3). Additionally, worker-associated genes had signifi-cantly lower connectivity than queen- (GLM, p = 0.034) and non-caste-associated genes (GLM,p= 0.014; Additional file 9). No significant difference in connectivity could be found between queen- and non-caste-associated genes (GLM,p= 0.07; Additional file 9). No significant difference in connectivity could be found between queen- and non-caste-associated genes (GLM, p= 0.07; Additional file 9). Furthermore, worker-associated genes had higher expres-sion levels than queen- (GLM, p< 0.001) and non-caste-associated genes (GLM, p< 0.001; Additional file 10). No difference in expression levels could be found between
queen- and non-caste-associated genes (GLM, p= 0.262;
Additional file 10).
Second, we tested the effects of OGG connectivity and ex-pression levels on thedN/dSvalues. We found that OGG
ex-pression levels and connectivity were negatively correlated withdN/dS(GLM,p< 0.01; Additional file 11), a pattern
ob-served also in model species (e.g., yeast, [30, 32, 48]) and that may be universal to all living organisms.
Consequently, we included connectivity and expression level terms and their interactions as predictors in the GLM analysis of evolutionary rate. When taking these predictors into consideration, OGGs in queen- and worker-associated modules evolved at a higher rate than OGGs in non-caste-associated modules (GLM,pworker< 0.01 andpqueen< 0.001),
and we found no more significant differences in dN/
dS between queen- and worker-associated modules
(GLM, p= 0.17) (Additional file 12). Instead, dN/dS
differences were best explained not by the main effects, but by the interactions between caste association, expression or connectivity. Queen-associated OGGs evolved more slowly than worker-associated OGGs with a corresponding level of connectivity. By contrast, queen-associated OGGs evolved faster than worker-associated OGGs with a similar level of expression (Additional file 12). These data sug-gest that caste-biased selection acts on the genome in
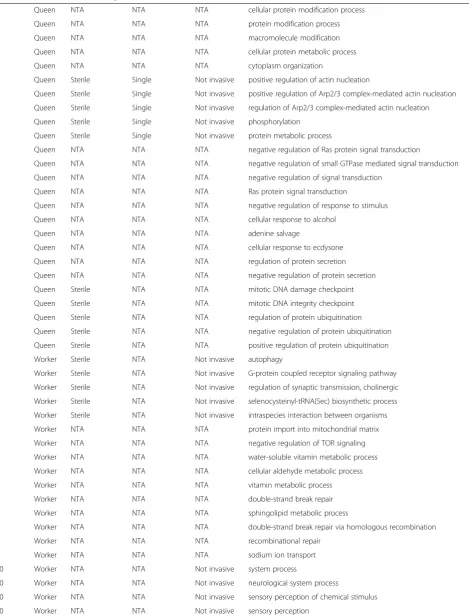
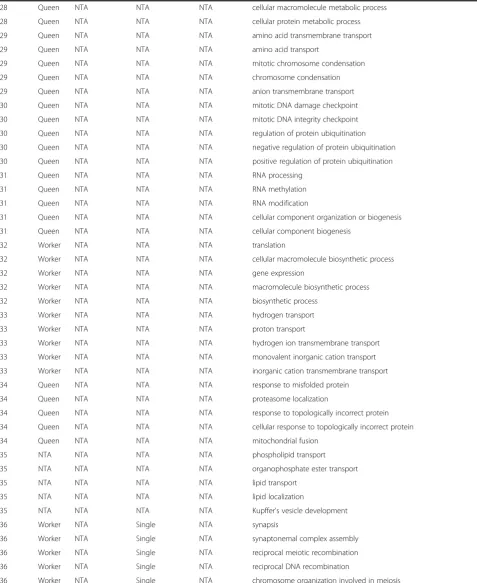
[image:5.595.54.540.89.371.2]Table 1GO terms found enriched in each module
Module Caste Worker sterility Queen number Invasiveness GO Term
1 Queen NTA NTA NTA cellular protein modification process
1 Queen NTA NTA NTA protein modification process
1 Queen NTA NTA NTA macromolecule modification
1 Queen NTA NTA NTA cellular protein metabolic process
1 Queen NTA NTA NTA cytoplasm organization
2 Queen Sterile Single Not invasive positive regulation of actin nucleation
2 Queen Sterile Single Not invasive positive regulation of Arp2/3 complex-mediated actin nucleation
2 Queen Sterile Single Not invasive regulation of Arp2/3 complex-mediated actin nucleation
2 Queen Sterile Single Not invasive phosphorylation
2 Queen Sterile Single Not invasive protein metabolic process
4 Queen NTA NTA NTA negative regulation of Ras protein signal transduction
4 Queen NTA NTA NTA negative regulation of small GTPase mediated signal transduction
4 Queen NTA NTA NTA negative regulation of signal transduction
4 Queen NTA NTA NTA Ras protein signal transduction
4 Queen NTA NTA NTA negative regulation of response to stimulus
5 Queen NTA NTA NTA cellular response to alcohol
5 Queen NTA NTA NTA adenine salvage
5 Queen NTA NTA NTA cellular response to ecdysone
5 Queen NTA NTA NTA regulation of protein secretion
5 Queen NTA NTA NTA negative regulation of protein secretion
6 Queen Sterile NTA NTA mitotic DNA damage checkpoint
6 Queen Sterile NTA NTA mitotic DNA integrity checkpoint
6 Queen Sterile NTA NTA regulation of protein ubiquitination
6 Queen Sterile NTA NTA negative regulation of protein ubiquitination
6 Queen Sterile NTA NTA positive regulation of protein ubiquitination
7 Worker Sterile NTA Not invasive autophagy
7 Worker Sterile NTA Not invasive G-protein coupled receptor signaling pathway
7 Worker Sterile NTA Not invasive regulation of synaptic transmission, cholinergic
7 Worker Sterile NTA Not invasive selenocysteinyl-tRNA(Sec) biosynthetic process
7 Worker Sterile NTA Not invasive intraspecies interaction between organisms
8 Worker NTA NTA NTA protein import into mitochondrial matrix
8 Worker NTA NTA NTA negative regulation of TOR signaling
8 Worker NTA NTA NTA water-soluble vitamin metabolic process
8 Worker NTA NTA NTA cellular aldehyde metabolic process
8 Worker NTA NTA NTA vitamin metabolic process
9 Worker NTA NTA NTA double-strand break repair
9 Worker NTA NTA NTA sphingolipid metabolic process
9 Worker NTA NTA NTA double-strand break repair via homologous recombination
9 Worker NTA NTA NTA recombinational repair
9 Worker NTA NTA NTA sodium ion transport
10 Worker NTA NTA Not invasive system process
10 Worker NTA NTA Not invasive neurological system process
10 Worker NTA NTA Not invasive sensory perception of chemical stimulus
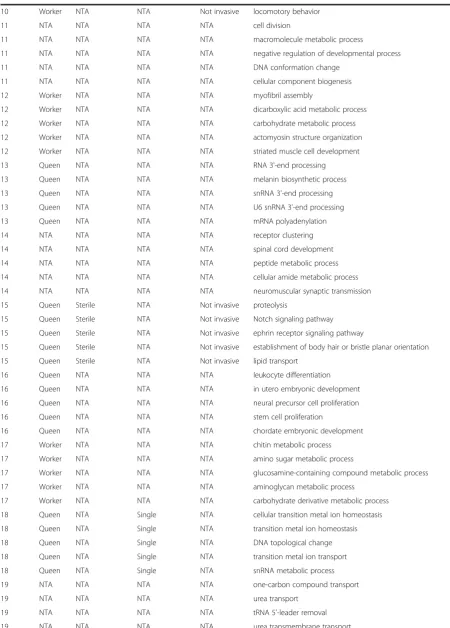
Table 1GO terms found enriched in each module(Continued)
10 Worker NTA NTA Not invasive locomotory behavior
11 NTA NTA NTA NTA cell division
11 NTA NTA NTA NTA macromolecule metabolic process
11 NTA NTA NTA NTA negative regulation of developmental process
11 NTA NTA NTA NTA DNA conformation change
11 NTA NTA NTA NTA cellular component biogenesis
12 Worker NTA NTA NTA myofibril assembly
12 Worker NTA NTA NTA dicarboxylic acid metabolic process
12 Worker NTA NTA NTA carbohydrate metabolic process
12 Worker NTA NTA NTA actomyosin structure organization
12 Worker NTA NTA NTA striated muscle cell development
13 Queen NTA NTA NTA RNA 3'-end processing
13 Queen NTA NTA NTA melanin biosynthetic process
13 Queen NTA NTA NTA snRNA 3'-end processing
13 Queen NTA NTA NTA U6 snRNA 3'-end processing
13 Queen NTA NTA NTA mRNA polyadenylation
14 NTA NTA NTA NTA receptor clustering
14 NTA NTA NTA NTA spinal cord development
14 NTA NTA NTA NTA peptide metabolic process
14 NTA NTA NTA NTA cellular amide metabolic process
14 NTA NTA NTA NTA neuromuscular synaptic transmission
15 Queen Sterile NTA Not invasive proteolysis
15 Queen Sterile NTA Not invasive Notch signaling pathway
15 Queen Sterile NTA Not invasive ephrin receptor signaling pathway
15 Queen Sterile NTA Not invasive establishment of body hair or bristle planar orientation
15 Queen Sterile NTA Not invasive lipid transport
16 Queen NTA NTA NTA leukocyte differentiation
16 Queen NTA NTA NTA in utero embryonic development
16 Queen NTA NTA NTA neural precursor cell proliferation
16 Queen NTA NTA NTA stem cell proliferation
16 Queen NTA NTA NTA chordate embryonic development
17 Worker NTA NTA NTA chitin metabolic process
17 Worker NTA NTA NTA amino sugar metabolic process
17 Worker NTA NTA NTA glucosamine-containing compound metabolic process
17 Worker NTA NTA NTA aminoglycan metabolic process
17 Worker NTA NTA NTA carbohydrate derivative metabolic process
18 Queen NTA Single NTA cellular transition metal ion homeostasis
18 Queen NTA Single NTA transition metal ion homeostasis
18 Queen NTA Single NTA DNA topological change
18 Queen NTA Single NTA transition metal ion transport
18 Queen NTA Single NTA snRNA metabolic process
19 NTA NTA NTA NTA one-carbon compound transport
19 NTA NTA NTA NTA urea transport
19 NTA NTA NTA NTA tRNA 5'-leader removal
Table 1GO terms found enriched in each module(Continued)
19 NTA NTA NTA NTA cellular macromolecule localization
20 Queen NTA Single NTA nuclear-transcribed mRNA catabolic process, nonsense-mediated decay
20 Queen NTA Single NTA cellular macromolecule catabolic process
20 Queen NTA Single NTA cellular localization
20 Queen NTA Single NTA tissue regeneration
20 Queen NTA Single NTA nuclear export
21 Queen NTA NTA NTA Rho protein signal transduction
21 Queen NTA NTA NTA Ras protein signal transduction
21 Queen NTA NTA NTA cell adhesion
21 Queen NTA NTA NTA biological adhesion
21 Queen NTA NTA NTA regulation of Ras protein signal transduction
22 Queen NTA NTA NTA cellular protein metabolic process
22 Queen NTA NTA NTA single-organism intracellular transport
22 Queen NTA NTA NTA protein metabolic process
22 Queen NTA NTA NTA autophagic cell death
22 Queen NTA NTA NTA salivary gland cell autophagic cell death
23 Queen NTA NTA NTA purine ribonucleoside catabolic process
23 Queen NTA NTA NTA ribonucleoside catabolic process
23 Queen NTA NTA NTA purine nucleotide catabolic process
23 Queen NTA NTA NTA purine nucleoside catabolic process
23 Queen NTA NTA NTA nucleoside catabolic process
24 Worker NTA NTA NTA cellular amino acid metabolic process
24 Worker NTA NTA NTA positive regulation of cysteine-type endopeptidase activity
involved in apoptotic process
24 Worker NTA NTA NTA alcohol catabolic process
24 Worker NTA NTA NTA positive regulation of cysteine-type endopeptidase activity
24 Worker NTA NTA NTA positive regulation of endopeptidase activity
25 Worker NTA NTA NTA cofactor metabolic process
25 Worker NTA NTA NTA cofactor biosynthetic process
25 Worker NTA NTA NTA single-organism biosynthetic process
25 Worker NTA NTA NTA coenzyme metabolic process
25 Worker NTA NTA NTA coenzyme biosynthetic process
26 Worker NTA NTA NTA ribosome assembly
26 Worker NTA NTA NTA organophosphate catabolic process
26 Worker NTA NTA NTA carbohydrate derivative catabolic process
26 Worker NTA NTA NTA extracellular polysaccharide metabolic process
26 Worker NTA NTA NTA extracellular polysaccharide biosynthetic process
27 Worker NTA NTA NTA cellular metabolic process
27 Queen NTA NTA NTA DNA metabolic process
27 Queen NTA NTA NTA cellular process
27 Queen NTA NTA NTA cellular macromolecule metabolic process
27 Queen NTA NTA NTA nucleobase-containing compound metabolic process
28 Queen NTA NTA NTA primary metabolic process
28 Queen NTA NTA NTA organic substance metabolic process
Table 1GO terms found enriched in each module(Continued)
28 Queen NTA NTA NTA cellular macromolecule metabolic process
28 Queen NTA NTA NTA cellular protein metabolic process
29 Queen NTA NTA NTA amino acid transmembrane transport
29 Queen NTA NTA NTA amino acid transport
29 Queen NTA NTA NTA mitotic chromosome condensation
29 Queen NTA NTA NTA chromosome condensation
29 Queen NTA NTA NTA anion transmembrane transport
30 Queen NTA NTA NTA mitotic DNA damage checkpoint
30 Queen NTA NTA NTA mitotic DNA integrity checkpoint
30 Queen NTA NTA NTA regulation of protein ubiquitination
30 Queen NTA NTA NTA negative regulation of protein ubiquitination
30 Queen NTA NTA NTA positive regulation of protein ubiquitination
31 Queen NTA NTA NTA RNA processing
31 Queen NTA NTA NTA RNA methylation
31 Queen NTA NTA NTA RNA modification
31 Queen NTA NTA NTA cellular component organization or biogenesis
31 Queen NTA NTA NTA cellular component biogenesis
32 Worker NTA NTA NTA translation
32 Worker NTA NTA NTA cellular macromolecule biosynthetic process
32 Worker NTA NTA NTA gene expression
32 Worker NTA NTA NTA macromolecule biosynthetic process
32 Worker NTA NTA NTA biosynthetic process
33 Worker NTA NTA NTA hydrogen transport
33 Worker NTA NTA NTA proton transport
33 Worker NTA NTA NTA hydrogen ion transmembrane transport
33 Worker NTA NTA NTA monovalent inorganic cation transport
33 Worker NTA NTA NTA inorganic cation transmembrane transport
34 Queen NTA NTA NTA response to misfolded protein
34 Queen NTA NTA NTA proteasome localization
34 Queen NTA NTA NTA response to topologically incorrect protein
34 Queen NTA NTA NTA cellular response to topologically incorrect protein
34 Queen NTA NTA NTA mitochondrial fusion
35 NTA NTA NTA NTA phospholipid transport
35 NTA NTA NTA NTA organophosphate ester transport
35 NTA NTA NTA NTA lipid transport
35 NTA NTA NTA NTA lipid localization
35 NTA NTA NTA NTA Kupffer's vesicle development
36 Worker NTA Single NTA synapsis
36 Worker NTA Single NTA synaptonemal complex assembly
36 Worker NTA Single NTA reciprocal meiotic recombination
36 Worker NTA Single NTA reciprocal DNA recombination
36 Worker NTA Single NTA chromosome organization involved in meiosis
a complex way that is modulated by expression and the regulatory interactions between genes.
Only one gene was consistently caste-biased
Although hundreds (e.g., Formica aquilonia) or even
thousands (e.g., Linepithema humile) of genes showed
caste-specific bias in individual species (Additional file 1), there was very little overlap among these species-specific sets (Fig. 4). In fact, when all 16 species were considered, only a single gene was differentially expressed between queens and workers (overexpressed in workers) in all spe-cies; this was the myosin light chain (Fig. 4). The myosin light chain gene is most likely a housekeeping gene that has caste-biased expression patterns owing to different de-mands on muscular activity by queens and workers, but it is expressed in every cell and is not a known caste-specific gene. Additionally, the worker-biased pattern of the my-osin light chain may be due to a higher concentration of muscle cells present in workers compared with queens. Also, we acknowledge that a number of potential factors are likely to affect our ability to detect common caste-biased genes across our studied species (e.g., number of replicates, sampling period, statistical power over multiple datasets) that are beyond this comparative study. Add-itionally, at the level of functional composition, we found no GO terms consistently enriched for caste-biased genes across all 16 species (Fig. 5).
External validation of module preservation
To verify that modules identified in this study represent
technically reproducible and evolutionarily useful
features, we assessed the extent of module preservation between our work and a recent WGCNA investigation that used RNA-seq to examine age-based, behavioral
division of labor in workers of the pharaoh ant (
Mono-morium pharaonis) [33]. Although the earlier study did not include queens, and had a much smaller sample size
(n= 24), 11 of the modules identified in the present
study significantly overlapped with modules inferred from M. pharaonis behavioral data (false discovery rate (FDR) corrected p< 0.05; Additional file 13). Interest-ingly, genes in queen-associated modules, as well as
worker-associated modules, were also involved in M.
pharaonis worker division of labor, further supporting the roles of modules in multiple contexts.
Discussion
This study suggests that morphological and physiological differences between queens and workers result from the differential expression of evolutionarily conserved sets of co-expressed genes (modules). In our analysis, large fractions of all transcriptomes could be partitioned into modules. Expression of almost all modules was corre-lated with queen and worker phenotypes, suggesting that they may reflect conserved regulatory control mecha-nisms. Many other colony-level features emerge from
queen–worker interactions and phenotypes. We
there-fore also predicted that modules associated with queen and worker phenotypic differentiation would also be cor-related with species traits that evolved in parallel, such as complete worker sterility, colony queen number, and invasiveness (Fig. 1). We found this to be the case, with the expression of several modules being associated with multiple biological traits (e.g., module 2 is associated with caste, worker sterility, queen number and invasive-ness; Fig. 2). It is possible that these modules regulate the expression and evolutionary maintenance of a variety of phenotypes in multiple ant species.
Several modules were associated with the same sets of traits, such as caste phenotypes, worker reproduction and invasiveness. The traits selected for this analysis span the range from social to ecological, each evolved multiple times in the species under study; certainly other traits could be included in the model. Furthermore, it is important to note that the significance of the GLM coef-ficients merely suggest that they are associated with
vari-ation in eigengene expression, and that they don’t
provide a complete description of the sources of vari-ation in this data set. There may be factors, not exam-ined in this study, which explain even more variation, and more comprehensive comparative studies will be needed to determine the best predictors. Nonetheless,
0.0
0
.2
0.4
0
.6
0.8
1.0
*
**
0.109 0.113 0.125
dN/dS
ratio
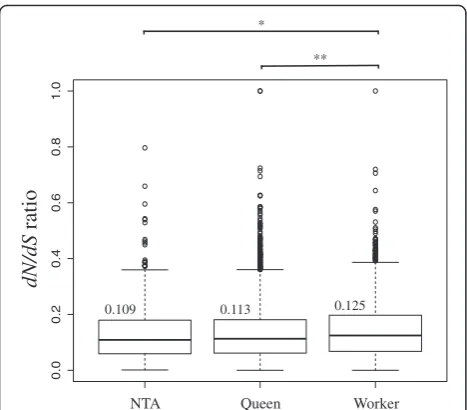
Worker NTA Queen Fig. 3Box plots showing the distribution ofdN/dSratios before
accounting for OGG connectivity and expression levels for OGGs in non-caste-associated modules (NTA), OGGs in queen-associated modules (Queen) and OGGs in worker-associated modules (Worker), and calculated using PAML. The mediandN/dSvalues are indicated above the boxplot.
OGGs in worker-associated modules had significantly higherdN/dSthan
[image:10.595.57.291.86.291.2]some biologically suggestive patterns emerge. For ex-ample, worker sterility appears to be linked to invasive-ness (Fig. 2), a pattern also found in several invasive species [49], suggesting that the two traits may be somehow transcriptionally correlated. This pattern ap-pears to hold when considering the top invasive ant species selected by IUCN [50], and not present in our
data set: Pheidole megacephala [51] and Wasmannia
auropunctata [52] workers don’t have ovaries, whereas Anoplolepis gracilipesworkers have ovaries [53],
but don’t appear to reproduce (similarly to Lasius
neglectus) [54]. This raises the intriguing possibility that the evolution of some traits may be linked in unexpected ways though sharing the same regulatory machinery, and that selection for one trait may have the effect of facilitat-ing the evolution of other traits. These results are clearly preliminary, and worker sterility is neither a necessary nor sufficient condition for invasiveness, but we predict that some distantly related invasive ants may have similarities in gene expression profiles, and possibly even
15
10
50
500
15
10
50
500
2 3 4 5 6 7 8 9 10 11 12 13 14 15 16
Number of common DEGs
Number of species compared
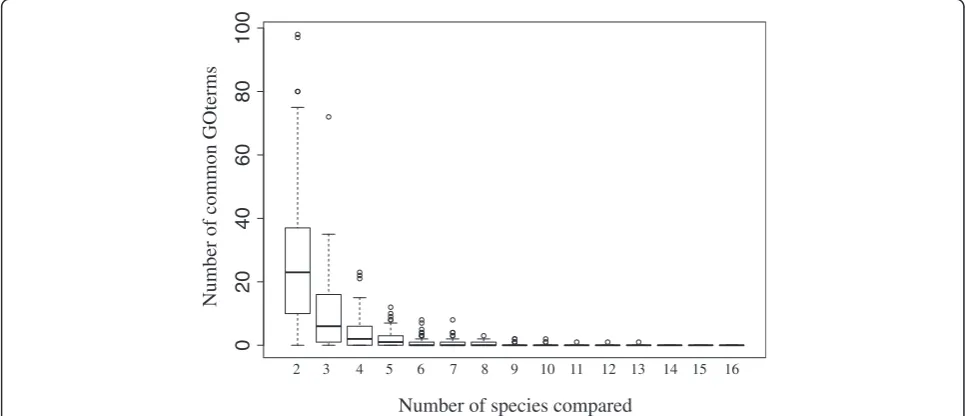
Fig. 4Only a single gene is consistently differentially expressed between queens and workers. The plot shows the number of caste differentially expressed genes (DEGs) in common in a variable number of randomly selected species (bootstrap resampling 100 times). This pairwise analysis shows either that few genes are consistently caste-biased across species or that comparison of differentially expressed genes lacks power to detect these biases. By contrast, network analysis manifested significant underlying regulatory structure, suggesting that it is a more powerful approach (Fig. 2). A similar analysis was conducted at the level of GO terms (Fig. 5)
0
20
40
60
80
100
Number of common GOterms
Number of species compared
2 3 4 5 6 7 8 9 10 11 12 13 14 15 16
[image:11.595.58.540.87.279.2] [image:11.595.56.539.485.693.2]convergent patterns of selection. In the future, more work will need to assess the generality of this pattern.
In our large-scale comparative analysis we found that genes in caste-associated modules evolved faster than genes in non-caste-associated modules. Morph-biased genes are predicted to evolve more rapidly due to re-duced antagonistic pleiotropy [55, 56]. In accordance with these predictions, previous studies focusing on single species have shown that genes with caste-biased expression are more likely to evolve faster than genes with unbiased expression [28, 29]. Our study is the first to examine patterns of selection across multiple species of ants with a common origin of caste differentiation. However, detecting selection is subject to a large number of factors, such as a gene’s transcriptional abundance, and its importance within the protein interaction network [57–59]. For example, gene significance (connectivity) was strongly associated with higher expression level and lower evolutionary rate in our study (GLM,p< 0.001), as well as in studies of other systems [34]. Expression and network effects of highly abundant genes are also well known to affect evolutionary rates, potentially confounding analysis of selection pressure [32]. Indeed, when analyzed as sole factors, caste had an effect on protein evolutionary rates, which disappeared when network effects were considered (Additional file 12). Our finding that modules correlated with caste also act in other phenotypic contexts suggests that most caste-biased genes play multiple roles. Together with recent findings suggesting that genes may fluctuate in caste-bias across development [19, 60, 61], this may explain why there is no persistent queen or worker-specific selection, i.e., caste-biased genes in one context may show other expression patterns in different develop-mental stages, or tissues. That being said, evolutionary rates of caste-biased genes had significant interactions with expression and connectivity (Additional file 12), suggesting that caste-biased selection may be modulated by gene expression levels and the shape of gene co-expression (or protein interaction) networks. Our results on caste bias parallel those of a recent study that showed that genes involved in another social context, nursing and foraging in an ant, differ in expression level and connect-ivity, and interactions with these terms are important predictors for evolutionary rates [33].
Our analysis covers only genes with orthologs in most species. We took this approach for several reasons. First, most species in our study have no available genomic re-sources, and we had to construct de novo transcriptomes for each of them, a technique that enables functional genomic studies, but has the potential for wide-ranging mis-assemblies [43]. By focusing on previously computed and curated orthologous gene groups [62], we were able to select the best fitting models for comparative analysis among hundreds of thousands of candidate transcripts.
Second, we focused on the presence of conserved gene regulatory machinery across multiple ant species, and not on the presence of taxonomically restricted genes. The latter are likely to be involved in species-specific functions [63], but were beyond the scope of this study. Never-theless, it is worth noting that recent studies have highlighted potential roles of novel genes in caste evolution [25, 29, 34, 64–66]. In any case, taxonomic-ally restricted genes are likely to interact with existing regulatory pathways, and the manner in which they integrate into the conserved modules will be a fascinating topic for future research. We expect that novel genes will be poorly connected at first, which may allow greater rates of evolution [34], based on network properties alone.
A key question addressed in this study is “how does
selection act on a gene important to queen versus worker
phenotypes?” To answer this question we attempted to
characterize gene expression by measuring their expres-sion in whole adults. We believe that this approach approximates the proportional contribution of each gene to fitness in each caste. For example, queens have propor-tionally larger ovaries, and we expect higher levels of ovary-expressed genes in queen bodies overall as a result, reflecting the relative importance of ovaries to the queen phenotype. However, this approach has a number of sig-nificant limitations by greatly over-simplifying the nature of transcriptional regulation in an organism. Tissue-specific expression studies, particularly taken over the course of development, may have greater power to detect caste-specific differences, both in terms of the number of differentially expressed genes, and co-expression network structure. As a result, our data most likely represent an underestimate of the true number of modules. However, a comparative study of tissues-specific transcription at such a phylogenetic scale requires confident assignment of orthology and function, which would be difficult given the marked differences between queens and workers in the presence and size of many glands [67] and some organs (e.g., ovaries, which are absent in the workers of several lineages; Fig. 1). Future studies should focus on the com-parative analysis of expression patterns in specific tissues; such studies will likely provide valuable functional insight into the function and evolution of these organs.
terms, common to all of these 16 species. For instance, only a single gene was found to be differentially expressed in all species, a result that strikes us as biologically un-likely. However, this result parallels findings in honey bees (Apis), where microarray experiments found little overlap in differentially expressed genes within the same genus [68]. By analyzing all the genes at once, gene network ana-lysis circumvents the problem of multiple comparisons, though at the cost of species-level resolution.
In addition WGCNA provides a more complex ap-proach that captures system-level properties [40]. Most phenotypes involve interactions of proteins from diverse biochemical pathways. Although modules inferred from WGNCA do not necessarily correspond to biochemical pathways, or other classical components of cellular organization, WGCNA performs well in reconstructing the overall complex structure of protein–protein inter-action networks [46]. In the past, for example, WGCNA has succeeded in identifying candidate genes involved in Alzheimer disease by comparing human and mouse brain transcriptomes [69], or in visualizing network structure and inferring phenotype–genotype interactions of numerous diseases such as autism [70]. Moreover, WGCNA has been used to uncover module conserva-tion among species, and to identify crucial drivers of evolutionary changes between humans and chimpanzees [38]. Applying this approach to evolution of social insect phenotypes, we show that WGCNA recovers key mod-ules responsible for a range of phenotypic traits, at the individual and colony levels. However, the genetic toolkit hypothesis postulates that conserved developmental pathways may have been co-opted in the evolution of reproductive division of labor, a hypothesis that has received considerable attention [20, 21, 35–37]. Although our data come from adults only, and do not allow us to test hypotheses regarding the causes of caste determin-ation during development, or hypotheses regarding whether the same genes would be involved in multiple origins of eusociality, they do suggest that there are indeed conserved regulatory modules that are repeatedly co-opted by evolution. It will be interesting to apply network analyses to study evolution of eusociality including other ants, particularly poneroids, which were not sampled in the current study, to see how conserved the patterns are across all ants, and also across its many different origins in hymenopterans. Comparisons across origins of eusoci-ality would reveal whether ‘toolkits’ associated with the evolution of social behavior exist. In particular, analysis of transcriptional networks during development will allow for a powerful test of the genetic toolkit hypothesis.
Conclusions
This study is the first to investigate in-depth a single eusocial clade to understand the extent to which
caste-associated regulatory architecture is preserved across taxa. We have identified a number of functionally im-portant transcriptional modules strongly associated with caste phenotypic differences. These modules may also be co-opted for other types of phenotypic novelty, including social and ecological traits. If so, they may serve as building blocks of phenotypic innovation.
Methods
De novo transcriptome assembly and mapping
Detailed descriptions of sample collection, RNA extractions and cDNA synthesis can be found in Additional file 14. Workers were collected at the surface of the colony mound, and are most likely all foragers. The queens were all col-lected from large mature colonies. In total, we sequenced 100 libraries from whole-body queen and worker samples, representing biological replicates of each caste. The number of replicates can be found in Additional file 1. The quality of raw reads was assessed with FastQC tools (http://
www.bioinformatics.bbsrc.ac.uk/projects/fastqc), and
adaptor sequences were removed using cutadapt [71]. Reads were trimmed to remove low quality bases, using a dynamic trimming perl script included in the SolexaQA package [72]. In the absence of a reference genome for most species, we used a de novo assembly method to construct reference tran-scriptomes for each species separately for use in read mapping for caste expression profiling, using Trinity software (release 2013-02-25, default settings) [41, 42]. To remove contigs potentially from non-ant ori-gin [73] and to include only transcripts with hom-ology to known hymenopteran genes, only contigs which showed significant BLAST hits to the nine published hymenopteran genomes (seven ant species, Apis mellifera, and Nasonia vitripennis) were kept for
further analysis (BLASTx, e-value cutoff ≤1 × 10⁻⁵,
query coverage ≥70 %). Because most transcripts were
filtered downstream during orthology assignment, we used a relatively permissive BLAST cutoff at this step.
Quality control
Protein coding prediction and orthology assignment
The output of the Trinity pipeline is a set of transcripts, including alternatively spliced isoforms determined during graph reconstruction in the Butterfly step. These tran-scripts are grouped into gene components, which rep-resent likely multiple isoforms. To minimize effects of possible isoform variation between species, we kept only the longest component for further analysis. Next, we used two software packages, OrfPredictor [74] and FrameDP [75], to predict protein coding sequences of filtered contigs. We used OGGs for the sub-family Formicidae from OrthoDB7 as the reference for our own orthology assignment. Protein sequences were downloaded from the OrthoDB FTP site [62], and aligned using PRANK (v. 140603) [76], using a neigh-bor joining guide tree generated by MAFFT (v. 7.164) [77]. These alignments were used to generate hidden Markov models (HMMs) using HMMER (v. 3.1b1; http://hmmer.org). We then used these models within the HaMStr [78] pipeline to assign each gene prediction to an OrthoDB OGG, using default settings. Only OGGs with contigs from at least four species were retained for further analysis. This method selected the best fit among alternative open reading frame predictions, and assigned genes to independently established OGGs, which should facilitate future comparative work.
Caste-biased gene expression
Paired-end reads were mapped to the de novo transcrip-tomes using RSEM [79], and the resulting expected counts were used in the subsequent differential gene expression analysis with the R Bioconductor package EdgeR [80]. Reads generated by the three queen and the three worker samples were used as replicates. Transcripts without, or with very low, read counts were filtered out before perform-ing the test, usperform-ing the threshold determined by the detec-tion limit of the RNA spike-in analysis (Addidetec-tional file 1). As recommended by EdgeR, TMM normalization was ap-plied to account for compositional difference between li-braries, and expression differences were considered significant at a FDR < 0.05. Pairwise comparison analyses between castes were performed for all species separately. Subsequently, differentially expressed genes were assigned to their respective OGGs, and caste-bias expressions were compared within each OGG to find common caste differ-entially expressed genes among all species.
In order to verify whether caste-biased gene expression has a phylogenetic signal and also that our phylogenetic sampling was not affecting our ability to detect commonly differentially expressed genes, we compared the number of commonly differentially expressed genes across seven Formicaspecies and across seven randomly selected non-Formica species. We found a very similar trend for both
pairwise relationships, and very few genes were found commonly differentially expressed in both cases (non- For-micaspecies, 7;Formicaspecies, 21; Additional file 17).
Generation of weighted gene co-expression networks and identification of functional modules
Trimmed mean of M-values normalization was applied to the raw count expression data (WGCNA) using the R package EdgeR [80]. Subsequent weighted gene co-expression network analysis was conducted using the R package WGCNA [40]. The input dataset consisted of a matrix with 100 columns, each corresponding to a queen or worker RNA-seq library from the 16 species, and 9859 lines, each representing one OGG expression level. If mul-tiple transcripts from the same species were present in one OGG, their expression levels were averaged. This data set was first filtered to remove OGGs (lines) with too many missing values, following WGCNA cutoff threshold recommendations (Additional file 3). Additionally, one outlier sample (column) was filtered out following the WGCNA package guidelines, and consequently removed from the differential gene expression analysis described above (Additional file 18). A soft thresholding power of 8 was chosen based on the criterion of approximate scale-free topology (Additional file 19). After calculat-ing topological overlap values for all pairs of ortholo-gous gene groups, a hierarchical clustering algorithm identifies modules of highly interconnected genes. Subse-quently, modules of highly co-expressed OGGs were merged together using a cutoff value of 0.2 and the mini-mum module size was set to 30 (Additional file 20).
Evolutionary rate analysis
Because our transcriptomes may contain stochastic variation in the number of reconstructed paralogs, for analysis of evolutionary rate only a single gene predic-tion per species, the one most closely matching the reference HMM, was chosen per OrthoDB gene using HaMStr. These genes were re-aligned using PRANK [76] as protein sequences. Confidence of these alignments was assessed using GUIDANCE [81], PRANK realign-ments based on 32 bootstrap replicates, using the heads-or-tails method. Residues with GUIDANCE confidence less than 0.9 were replaced by Ns. Genes with fewer than 150 non-ambiguous nucleotides were eliminated from the analysis. The best maximum likelihood tree was computed with codonPhyML (v. 1.00) [82]. The Codeml module from PAML (v. 4.4), [83] was used to estimate dN/dSof different genes using these trees and alignments,
with branch lengths and transition/transversion estimates from codonPhyML as starting values. We estimated overall dN/dSfor each OGG using a one-ratio model (model = 0),
Three separate GLM analyses were conducted using the glm function in R with 1000 bootstrap pseudorepli-cates. First, we investigated the effects of caste ondN/dS,
using OGG dN/dSvalues as the main effects and caste
OGG association as the explanatory variables, GLM =
dN/dS~ Caste. A similar procedure was used with
OGG connectivity and expression levels, GLM = Con-nectivity ~ Caste and GLM = Expression ~ Caste.
Second, we investigated the effect of OGG connectivity and expression levels (explanatory variables) on thedN/dS
values (main effect), GLM =dN/dS~ Exp + Connectivity.
Third, we used a single model to investigate the com-bined effects of OGG connectivity, OGG expression levels and biological traits (explanatory variables) on OGGdN/dS
values (main effect) GLM =dN/dS~ Connectivity * Caste +
Expression * Caste.
For all three GLM analyses, biological trait effects were derived from module association with queen, worker or NTA (Fig. 2), anddN/dS, connectivity and expression level
values were exponentially transformed to reach a normal distribution before being processed. Detailed scripts can be found in https://github.com/MikheyevLab/Compara-tive-transcriptomics-of-ants under a MIT license.
Functional annotation of co-expressed modules
GO terms for all genes were determined using Blast2GO (using BLASTp with an e-value cutoff≤10–3) [84]. We used the GOstats package for R [85] to conduct GO term enrichment analysis on gene sets included in the modules described above, using the set of all genes for which GO terms were available as the universe.
Module preservation
We also conducted module preservation statistics using WGCNA modules retrieved from a recent study of worker behavior [33, 86]. We compared the extent of module pres-ervation in an independent data set by checking whether there was correspondence in module assignment between this study and an earlier study of behavioral polyethism in M. pharaonis, which also used WGCNA [33]. Orthologs of M. pharaonisgenes were selected using BLAST. We then calculated how often genes were classified as belonging to the same module by both studies [86]. Statistical signifi-cance was determined using Fisher's exact test, adjusted for multiple comparisons using FDR with the FDR set at 0.05.
Phylogenetic tree construction
We used OGG alignments produced for the PAML analysis that had no missing data to construct a phylogenetic tree of species relationships using RAxML (v. 8) [87]. The data set contained 1427 genes and 3.59 Mb of sequence, and the analysis was partitioned by gene and conducted under a GTRGAMMAI model.
Module and phenotype relationship
In order to determine the relationship between modules and phenotypic traits (e.g., caste, worker sterility, queen number, invasiveness), we calculated the average signed
normalized gene expression values called an “
eigen-gene”. The eigengene is defined as the first principal component of a module and represents the gene expres-sion profiles. One eigengene value per sample and per module was calculated. To investigate if eigengenes were associated with the external phenotypic traits, we applied a Markov Chain Monte Carlo method with phylogenetically correlated random effects, imple-mented by the software package MCMCglmm [45], which was run in R 3.3.1 [88]. We first calculated the in-verse of the matrix of phylogenetic correlation, using an
ultrametric tree computed using Sanderson’s
non-parametric rate smoothing method [89]. The best smoothing parameter, lambda, was chosen by cross-validation over a range of possible values [90] and was set to 0.1. We used non-informative priors correspond-ing to an inverse-Gamma distribution with shape and scale parameters equal to 0.01. MCMC burn-in was set to 150,000, and 500,000 simulations were carried out in total. Convergence, effective sample size and mixing were controlled for. The GLMM approach provides a convenient means of testing the correlation of multiple traits with module eigengenes by using a single model relating eigengene expression to caste phenotype and all species traits (worker sterility, queen number, and inva-siveness; Input table Additional file 21).
Availability of supporting data
The raw reads of the transcriptome are publicly available in the DNA Data Bank of Japan under bioproject ID PRJDB4088, sample accession numbers ID SAMD00
035735-SAMD00035834; Formica aquilonia
LH381539-LH513652,Formica cinereaLH513653-LH652103,Formica
exsecta LH652104-LH973351, Formica fusca
LI000001-LI121692, Formica pratensis LI121693-LI219804, Formica
pressilabris LI219805-LI349988, Formica truncurum
LI349989-LI476587, Lasius neglectus LI476588-LI563515,
Lasius turcicus LI563516-LI670604, Linepithema humile
LI670605-LI795928, Monomorum chinense
LI795929-LI926639, Monomorium pharaonis LJ000001-LJ120855,
Myrmica rubra LJ120856-LJ206166, Myrmica ruginodis
LJ206167-LJ284088, Myrmica sulcinodis
LJ284089-LJ356044,Solenopsis invicta(monogynous form) LJ356045-LJ530869, Solenopsis invicta (polygynous form) LJ530870-LJ707314. All transcriptome assemblies can be found on Fourmidable (http://antgenomes.org/downloads/) [91].
Ethics approval
No ethical approval was required.
Additional files
Additional file 1: Table S1.Number of queens and workers used for RNA pooling before library preparation. Three replicates per species per caste were sequenced using an equal number of samples in each of them. Number of pooledFormica exsectasamples can be found in [19]. Number of de novo assembled contigs using Trinity before and after filtering, given with the transcriptomes’s size and number of reads. See Methods for full description of the filtering steps. Number of caste differentially expressed genes found in each species using EdgeR (Queens, number of queen upregulated genes; Workers, number of worker upregulated genes; Non DE, number of non-differentially expressed genes; Initial count, number of contigs analysed before cutoff; Cutoff, cutoff limit from RNA-spike-in analysis). The number of differen-tially expressed genes between queen and worker varied among species, from 323 genes (7.4 % of the total number of genes kept for the analysis) inFormica aquiloniato 5502 genes (72 %) inLinepithema humile(S. invictamono,Solenopsis invictamonogynous form;S. invictapoly, Sole-nopsis invictapolygynous form). No queens were found forLasius turcicus. (XLSX 42 kb)
Additional file 2: Table S2.Dataframe used as input for the WGCNA analysis. Each column represents one sample analyzed and each row represents the expression level of one OGG across all samples. (XLSX 7837 kb)
Additional file 3: Figure S1.Expression levels of orthologous gene groups removed (blue) and kept (red) for WGCNA analysis. WGCNA pre-cleaning step removed data with excessive missing values, which may impact our ability to detect co-expression patterns. On average, expres-sion data were not available for 26 samples (out of 100) for the removed OGGs (2432 OGGs), and only 7 samples for the contigs that were kept for further analysis (7427 OGGs). (PDF 12 kb)
Additional file 4: Table S3.Results of the MCMC general linear model (GLM) with 500,000 iterations testing the influence of biological traits on module eigengenes and accounting for the effects of phylogeny. The expression of 32 modules was significantly correlated with one of the two female castes. The modules associated with caste were also found to be correlated with several important phenotypic traits (worker sterility, the number of queens per colony and invasiveness). We found that eight modules showed significant interactions with multiple traits, suggesting that these modules play a role in biological traits beyond caste differentiation. (XLSX 3332 kb)
Additional file 5: Table S4.Number of differentially expressed genes (DEGs) present in each module (Caste, association of the module with either queen (Queen) or worker traits (Worker), or not associated (NTA); No. Queen DEGs, number of queen upregulated genes belonging to the module;No Worker DEGs, number of worker upregulated genes belonging to the module;No Non DEGs, number of genes non-differentially expressed belonging to the module;% DEGs, percentage of DEGs compared with the total number of genes found in the modules). (PDF 30 kb)
Additional file 6: Figure S2.Visualization of two caste-associated modules (QueenandWorker). The graph represents genes (nodes) connected by edges showing correlation in gene expression. Central genes (hub genes) which have multiple connections to other genes and their biological functions are indicated. Hub genes have high probabilities of being
essential for biological functions [92]. (PDF 252 kb)
Additional file 7: Table S5.List of blast annotations for each OGG using BLASTp. (XLSX 243 kb)
Additional file 8: Table S6.List of enriched GO term for each module. The GOstats package for R [85] was used to conduct GO term enrichment analysis. No enriched GO term could be found for module 3. (XLSX 293 kb)
Additional file 9: Figure S3.Box plots showing the distribution of connectivity rates for OGGs in non-caste-associated modules (NTA), OGGs in queen-associated modules (Queen) and OGGs in worker-associated modules (Worker), and calculated using WGCNA. The median connectivity values are
indicated above the boxplot. OGGs in worker-associated modules had significantly lower connectivity rates than OGGs in queen-associated modules (GLM, p = 0.034) and in non-caste-associated modules (GLM,p= 0.014) *p< 0.05.. (PDF 50 kb)
Additional file 10: Figure S4.Box plots showing the distribution of expression levels for OGGs in non-caste-associated modules (NTA), OGGs in queen-associated modules (Queen) and OGGs in worker-associated modules (Worker), and calculated using RSEM. The median expressionvalues are indicated above the boxplot. OGGs in worker-associated modules had significantly higher expression values than OGGs in queen-associated modules (GLM,p< 0.001) and in non-caste-associated modules (GLM,p< 0.001) ***p< 0.001. (PDF 59 kb)
Additional file 11: Table S7.Effects of OGG expression levels and connectivity ondN/dS. OGGs expression levels and connectivity were negatively
correlated withdN/dS. Consequently, we included these terms and their
interactions as predictors in the GLM analysis of evolutionary rate. (XLSX 26.8 kb)
Additional file 12: Table S8.Results of the general linear model (GLM) with bootstrapping (1000 times) testing the influence of OGGs’connectivity, expression levels and phenotypic traits on modules’rates of evolution (NTAnon-traits-associated modules). *p< 0.05, **p< 0.01, ***p< 0.001. After accounting for the effects of network topology and expression levels, dN/dSwere not different for OGGs within modules associated with any of
the phenotypes we investigated. Because a single module may be involved in multiple phenotypes, its constituent genes may experience different selective pressures in different contexts. (XLSX 39 kb)
Additional file 13: Figure S5.Module preservation in an independent data set. To validate the existence of a module, it is desirable to show that it is preserved in an independent test network [86]. The matrix shows the number of genes assigned to modules by Mikheyev and Linksvayer [33] in a study of forager behavioral polyethism in
Monomorium pharaonis, and in the present study. If the modules are truly employed in different contexts, we expected some module overlap between the two data sets, despite the fact that the Mikheyev and Linksvayer study only focused on workers. Modules with a significant overlap in genes (FDR adjusted Fisher's exact testp< 0.05) are
highlighted in shades ofred. Both studies use the same WGCNA software for module definition, but independent data sources. The existence of significant overlaps suggests that many modules are reproducible in a variety of contexts. (PDF 60 kb)
Additional file 14:Supplementary material and methods. (PDF 130 kb)
Additional file 15: Figure S6.Multidimensional scaling (MDS) plot showing transcriptional similarity between the samples. Samples tend to cluster more by species than by caste, and phylogenetic information is well characterized, with subfamilies forming clear clusters. (PDF 74 kb)
Additional file 16: Figure S7.Plot of the observed versus expected log2 ratio of the ERCC expression levels for each species and each library constructed. The plots showed a positive relationship and revealed that library construction was successful. (PDF 765 kb)
Additional file 17: Figure S8.The number of caste differentially expressed genes in common across all sevenFormicaspecies and across seven randomly selected non-Formicaspecies (bootstrap resampling 100 times). This pairwise analysis shows a similar trend for both plot with very low overlap of differentially expressed genes, even despite the phylogenetic relationship acrossFormicaspecies. (PDF 42 kb)
Additional file 18: Figure S9.WGCNA sample clustering based on gene expression patterns used to detect outliers. One replicate ofS. invictaqueen sample was removed from WGCNA and further expression analysis. (PDF 44 kb)
Additional file 19: Figure S10.Scale free topology criterion with a R^2 threshold of 0.9. A soft threshold power of 8 was chosen. (PDF 44 kb)
Additional file 20: Figure S11.Dendogram of OGG gene expression patterns and module colors. The network analysis of gene expression in ants identifies distinct modules of co-expressed genes. The dendrogram is produced by hierarchical clustering of 7427 orthologous gene groups based on topological overlap. (PDF 324 kb)
profile of each module. These values were subsequently used to relate the modules with external information (Caste,Queen number,Worker sterilityandInvasiveness). (XLSX 75.3 kb)
Additional file 22: Table S10.Detailed workflow of the WGCNA analysis. (PDF 520 kb)
Competing interests
The authors declare that they have no competing interests.
Authors’contributions
Designed research: CM, JSP, HH, ASM. Performed research: CM, MMYT, ASM. Contributed materials: CM, SA, CG, LP, MS, LS, KT, JSP, HH, ASM. Analyzed data: CM, ASM. Wrote the paper: CM, ASM. All authors read and approved the final manuscript.
Acknowledgments
The authors would like to thank Dóra B. Huszár, Gloria M. Luque, Kalevi Trontti, Ken G. Ross, Perttu Seppä and Rasmus S. Larsen for collecting samples and/or providing materials. We are grateful to Steven D. Aird for comments on the manuscript, Miguel Grau for help with GenBank, and Tobias Pamminger for introducing us to the exiting world of MCMCglm analysis. We thank the OIST DNA sequencing section for sequencing the libraries and for general guidance.
Funding information
This work was supported by the Academy of Finland (grant numbers 140990,135970, 273029 to HH, and 284666 to the Centre of Excellence in Biological Interactions), by the University of Helsinki, by the Okinawa Institute of Science and Technology, and JSPS KAKENHI # 24770034 and 25221206 (to ASM), and by the Danish National Research Foundation (grant number DNRF57 to the Centre for Social Evolution). We thank the Sasakawa Foundation, the Oskar Öflund foundation, Otto A. Malmin lahjoitusrahasto, and the LUOVA graduate school for additional funding to CM.
Author details
1Centre of Excellence in Biological Interactions, Department of Biological and Environmental Sciences, University of Helsinki, Helsinki, Finland.2Tvärminne Zoological Station, University of Helsinki, J.A. Palménin tie 260, FI-10900 Hanko, Finland.3Okinawa Institute of Science and Technology, 1919-1 Tancha Onna-son, Kunigami-gun, Okinawa 904-0412, Japan.4Department of Environmental Sciences, University of Girona, Campus Montilivi, 17071 Girona, Spain.5Centre for Social Evolution, Department of Biology, University of Copenhagen, Universitetsparken 15, DK-2100 Copenhagen, Denmark. 6Department of Subtropical Agro-Environmental Sciences, University of the Ryukyus, Senbaru 1, Nishihara, Okinawa 903-0213, Japan.7Research School of Biology, Australian National University, Canberra, ACT 0200, Australia.
Received: 12 October 2015 Accepted: 12 February 2016
References
1. Stearns SC. The evolutionary significance of phenotypic plasticity. Bioscience. 1989;39:436–45.
2. West-Eberhard MJ. Developmental plasticity and evolution. Oxford: Oxford University Press; 2003.
3. West-Eberhard MJ. Phenotypic plasticity and the origins of diversity. Annu Rev Ecol Syst. 1989;20:249–78.
4. Zhang J, Kumar S. Detection of convergent and parallel evolution at the amino acid sequence level. Mol Biol Evol. 1996;14:527–36.
5. Stern DL. The genetic causes of convergent evolution. Nat Rev Genet. 2013;14:751–64.
6. Rodríguez-Verdugo A, Gaut BS, Tenaillon O. Evolution ofEscherichia coli rifampicin resistance in an antibiotic-free environment during thermal stress. BMC Evol Biol. 2013;13:50.
7. Jackson DJ, McDougall C, Woodcroft B, Moase P, Rose R, Kube M, et al. Parallel evolution of nacre building gene sets in molluscs. Mol Biol Evol. 2010;27:591–608.
8. Saenko S, French V, Brakefield PM, Beldade P. Conserved developmental processes and the formation of evolutionary novelties: examples from butterfly wings. Philos Trans R Soc Lond B Biol Sci. 2008;363:1549–55.
9. True JR, Carroll SB. Gene co-option in physiological and morphological evolution. Annu Rev Cell Dev Biol. 2002;18:53–80.
10. Page R, Amdam G. The making of a social insect: developmental architectures of social design. Bioessays. 2007;29:334–43.
11. Kuraku S, Usuda R, Kuratani S. Comprehensive survey of carapacial ridge-specific genes in turtle implies co-option of some regulatory genes in carapace evolution. Evol Dev. 2005;17:3–17.
12. Beldade P, Brakefield PM, Long AD. Generating phenotypic variation: prospects from“evo-devo”research onBicyclus anynanawing patterns. Evol Dev. 2005;7:101–7.
13. Galant R, Skeath JB, Paddock S, Lewis DL, Carroll SB. Expression pattern of a butterfly achaete-scute homolog reveals the homology of butterfly wing scales and insect sensory bristles. Curr Biol. 1998;8:807–13.
14. Stuart JM, Segal E, Koller D, Kim SK. A gene-coexpression network for global discovery of conserved genetic modules. Science. 2003;302:249–55. 15. Lynch M. The evolution of genetic networks by non-adaptive processes.
Nat Rev Genet. 2007;8:803–13.
16. Wilson EO. The insect societies. Cambridge, Massachusetts, USA: Harvard University Press; 1971.
17. Szathmáry E, Smith JM. The major evolutionary transitions. Nature. 1995;374:227–32.
18. Bourke AF. Principles of social evolution. Oxford: Oxford University Press; 2011.
19. Morandin C, Dhaygude K, Paviala J, Trontti K, Wheat C, Helanterä H. Caste-biases in gene expression are specific to developmental stage in the ant Formica exsecta. J Evol Biol. 2015;28:1705–18.
20. Toth AL, Robinson GE. Evo-devo and the evolution of social behavior. Trends Genet. 2007;23:334–41.
21. Toth AL, Varala K, Henshaw MT, Rodriguez-Zas SL, Hudson ME, Robinson GE. Brain transcriptomic analysis in paper wasps identifies genes associated with behaviour across social insect lineages. Proc Biol Sci. 2010;277:2139–48. 22. Toth AL, Tooker JF, Radhakrishnan S, Minard R, Henshaw MT, Grozinger CM. Shared genes related to aggression, rather than chemical communication, are associated with reproductive dominance in paper wasps (Polistes metricus). BMC Genomics. 2014;15:75.
23. Daugherty T, Toth AL, Robinson GE. Nutrition and division of labor: Effects on foraging and brain gene expression in the paper waspPolistes metricus. Mol Ecol. 2011;20:5337–47.
24. Berens AJ, Hunt JH, Toth AL. Comparative transcriptomics of convergent evolution: different genes but conserved pathways underlie caste phenotypes across lineages of eusocial insects. Mol Biol Evol. 2014;32:690–703.
25. Feldmeyer B, Elsner D, Foitzik S. Gene expression patterns associated with caste and reproductive status in ants: worker‐specific genes are more derived than queen‐specific ones. Mol Ecol. 2014;23:151–61.
26. Hall DW, Goodisman MAD. The effects of kin selection on rates of molecular evolution in social insects. Evolution. 2012;66:2080–93.
27. Linksvayer TA, Wade MJ. Genes with social effects are expected to harbor more sequence variation within and between species. Evolution. 2009;63:1685–96.
28. Hunt BG, Ometto L, Wurm Y, Shoemaker D, Yi S, Keller L, et al. Relaxed selection is a precursor to the evolution of phenotypic plasticity. Proc Natl Acad Sci U S A. 2011;108:15936–41.
29. Harpur BA, Kent CF, Molodtsova D, Lebon JMD, Alqarni AS, Owayss AA, et al. Population genomics of the honey bee reveals strong signatures of positive selection on worker traits. Proc Natl Acad Sci U S A. 2014;111:2614–9. 30. Hahn MW, Kern AD. Comparative genomics of centrality and essentiality in
three eukaryotic protein-interaction networks. Mol Biol Evol. 2005;22:803–6. 31. Kim PM, Korbel JO, Gerstein MB. Positive selection at the protein network
periphery: Evaluation in terms of structural constraints and cellular context. Proc Natl Acad Sci U S A. 2007;104:20274–9.
32. Krylov DM, Wolf YI, Rogozin IB, Koonin E. Gene loss, protein sequence divergence, gene dispensability, expression level, and interactivity are correlated in eukaryotic evolution. Genome Res. 2003;13:2229–35. 33. Mikheyev AS, Linksvayer T. Genes associated with ant social behavior show
distinct transcriptional and evolutionary patterns. Elife. 2015;4:e04775. 34. Jasper WC, Linksvayer TA, Atallah J, Friedman D, Chiu JC, Johnson BR.
Large-scale coding sequence change underlies the evolution of postdevelopmental novelty in honey bees. Mol Biol Evol. 2014;32:334–46. 35. Wilkins AS.“The genetic tool-kit”: the life-history of an important metaphor. In: