R E S E A R C H
Open Access
Codon usage optimization in pluripotent
embryonic stem cells
Susanne Bornelöv
3†, Tommaso Selmi
1†, Sophia Flad
1,2, Sabine Dietmann
3and Michaela Frye
1,2*Abstract
Background:The uneven use of synonymous codons in the transcriptome regulates the efficiency and fidelity of protein translation rates. Yet, the importance of this codon bias in regulating cell state-specific expression programmes is currently debated. Here, we ask whether different codon usage controls gene expression programmes in self-renewing and differentiating embryonic stem cells.
Results:Using ribosome and transcriptome profiling, we identify distinct codon signatures during human embryonic stem cell differentiation. We find that cell state-specific codon bias is determined by the guanine-cytosine (GC) content of differentially expressed genes. By measuring the codon frequencies at the ribosome active sites interacting with transfer RNAs (tRNA), we further discover that self-renewing cells optimize translation of codons that depend on the inosine tRNA modification in the anticodon wobble position. Accordingly, inosine levels are highest in human pluripotent embryonic stem cells. This effect is conserved in mice and is independent of the differentiation stimulus.
Conclusions:We show that GC content influences cell state-specific mRNA levels, and we reveal how translational mechanisms based on tRNA modifications change codon usage in embryonic stem cells.
Keywords:Stem cell self-renewal, Differentiation, Codon bias, tRNA modifications
Background
Understanding normal tissue development and disease susceptibility requires the knowledge of mechanisms de-termining lineage fate decisions in embryonic stem and progenitor cells. While the transcriptional networks gov-erning the naïve and lineage committed states are now increasingly understood [1–3], it remains largely un-known whether and how translational mechanisms con-tribute to early cell fate decisions.
Translation of mRNA takes place on ribosomes, and distinct sets of tRNAs link each nucleotide triplet in mRNA to a corresponding amino acid. The genetic code is degenerate, because the 64 codons (triplets) encode for only 20 amino acids. Thus, single amino acids are often encoded by multiple synonymous codons that are not used randomly. The uneven use of synonymous
codons in the transcriptome is commonly found in dif-ferent organisms and called codon bias [4]. The selective use of optimal codons that correspond to abundant tRNAs has been suggested to improve translational effi-ciency by fine tuning translation elongation rates [5–7]. Yet, the importance of codon bias in regulating gene ex-pression programmes remains debated, because other features of the coding sequence, such as guanine-cytosine (GC) content and mRNA secondary structure, also strongly influence translation elongation efficiency [8,9].
The hundreds of tRNA genes interspersed in the human genome encode only 47 out of the 64 possible tRNA anti-codons. Codons lacking a corresponding tRNA are trans-lated via wobble base pairing. While the standard Watson-Crick base pairing is required at the first and sec-ond positions, so-called wobbling at the third position can allow otherwise-disfavored base pairing such as between guanosine and uracil [10, 11]. The affinity by which syn-onymous codons are recognized via wobble base pairing can vary, and the translation kinetics of different codon-anticodon pairs is further influenced by modified nucleo-tides present in tRNAs [12]. Specifically, position 34 in
© The Author(s). 2019Open AccessThis article is distributed under the terms of the Creative Commons Attribution 4.0 International License (http://creativecommons.org/licenses/by/4.0/), which permits unrestricted use, distribution, and reproduction in any medium, provided you give appropriate credit to the original author(s) and the source, provide a link to the Creative Commons license, and indicate if changes were made. The Creative Commons Public Domain Dedication waiver (http://creativecommons.org/publicdomain/zero/1.0/) applies to the data made available in this article, unless otherwise stated. * Correspondence:[email protected]
†Susanne Bornelöv and Tommaso Selmi contributed equally to this work.
1
Department of Genetics, University of Cambridge, Downing Street, Cambridge CB2 3EH, UK
2German Cancer Research Center (DKFZ), Im Neuenheimer Feld 280, 69120
Heidelberg, Germany
tRNAs, corresponding to the wobble position, carries a wide range of chemical modifications, including 2’ O-methylribose, 5-methylcytidine, 5-methoxycarbonylmethyl, 5-carbamoylmethyl, and their derivatives, as well as direct adenine-to-inosine editing (A34I) [13–15]. These modifica-tions can dramatically alter codon translation rates and for instance adapt protein synthesis to external stress stimuli [16–23].
Whether optimal codon usage through tRNA modifica-tions can regulate cell fate has been unexplored. There-fore, using human embryonic stem cells (hESCs) as a model system, we analysed codon usage optimization dur-ing self-renewal and differentiation. We triggered the exit of pluripotency by exposure to retinoic acid [24,25]. We found that the differentially expressed genes between the cell states were strongly biased by GC content. By analys-ing the translation kinetics at the ribosomes, we found that self-renewing embryonic stem cells optimized codon usage of specific codons that depended on inosine-modified tRNAs for translation. The differential codon bias was independent of the nature of the differentiation stimulus. In summary, we reveal a codon bias driven by tRNA modifications that defines pluripotent embryonic stem cells.
Results
RNA expression and translation highly correlate in self-renewing and differentiating cells
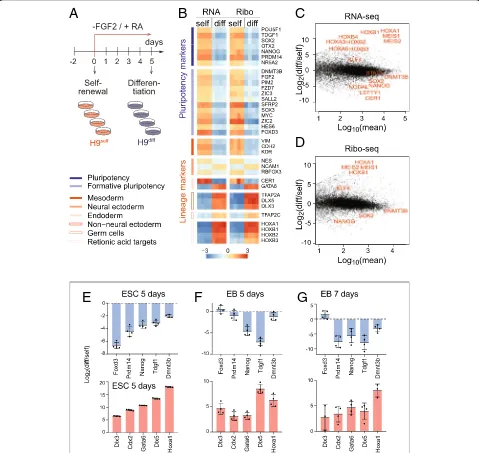
To determine mRNA expression and translation levels in self-renewing and differentiating human embryonic stem cells (hESCs), we performed RNA-sequencing (RNA-seq) and ribosome footprint profiling (Ribo-seq). We induced the exit of pluripotency of hESCs by removing the growth factor FGF-2 and exposing the cells to retinoic acid (RA), one of the best characterized stimuli to induce early em-bryonic differentiation (Fig.1a) [26,27].
After sequencing, we determined the quality of the Ribo-seq data. The library composition of self-renewing and differentiating hESCs was comparable and contained a considerable number of reads mapping to ribosomal RNAs (rRNA), transfer RNAs (tRNAs), and adapter di-mers, as expected (Additional file 1: Figure S1A). We found a large number of genes differentially expressed (Additional file1: Figure S1B; Additional file2: Table S1). The biological replicates were highly correlated (r= 0.98– 1.00) and clustered together (Additional file 1: Figure S1C). In contrast, the correlation between self-renewing and differentiating samples were much lower (r= 0.70– 0.77 in Ribo-seq;r= 0.85–0.88 in RNA-seq). Both the read length distribution and the strong reading frame period-icity for reads of 27 to 29 nucleotides in length confirmed sufficient coverage of mRNAs to analyse translation at sin-gle codon resolution (Additional file1: Figure S1D-F) [28]. Metagene analysis further confirmed a strong enrichment
of reads over the coding sequences, with only a small number of reads mapping to the 5′UTRs and nearly no reads at the 3′UTRs (Additional file 1: Figure S1G). Fi-nally, the differentially abundant genes in the Ribo-seq and RNA-seq datasets highly correlated (Additional file1: Figure S1H), suggesting that transcriptional mechanisms might be the dominant factor changing mRNA levels upon exit from pluripotency [29].
Induction of stem cell differentiation using RA in the absence of FGF-2 induced transcripts of all primary germ layers (Additional file 3: Table S2). Both RNA-seq and Ribo-seq confirmed the existence of heterogeneous cell populations expressing markers of ectoderm, endo-derm, and mesoendo-derm, while pluripotency markers were consistently repressed (Fig. 1b-d) [30–33]. The upregu-lated genes further included the Hox family, which is known to be regulated through RA-signalling in early embryonic development [34]. To further confirm that we efficiently differentiated the hESCs, we also grew hESCs in suspension to induce their differentiation into embryoid bodies (EBs) for 5 and 7 days [35]. The change of mRNA levels of pluripotency and lineage markers were comparable to RA-induced differentiation (Fig. 1e–g). Thus, RA-treated hESCs exited the pluripotent state and underwent cell differentiation.
Codon composition of cell state-specific mRNAs is biased towards GC content
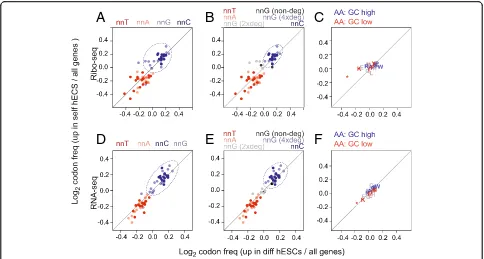
We next asked whether self-renewing and differentiating cells optimized their translational programmes by using cell state-specific codons. First, we selected all well-annotated coding sequences from the consensus coding sequence project [36]. Then, we calculated the relative codon frequency of each gene; thereby, each gene was represented as vector of 64 codon frequencies. Using our data, we defined two groups of genes: (i) signifi-cantly upregulated genes in self-renewing hESCs and (ii) significantly upregulated genes in differentiating hESCs, and then calculated the overall codon usage compared to all genes (Fig.2).
correlated to the codon degeneracy. Only four-fold de-generatennG codons clustered closely withnnC codons (Fig. 2b). Next, we asked whether the codon bias corre-lated with a different amino acid usage in the two cell states. However, neither up- nor downregulated genes showed an enrichment for a specific amino acid usage (Fig.2c).
We considered the possibility that the enrichment of nnC and nnG codons was driven by the translational machinery. However, we observed a similar distribution of codon usage in the upregulated genes of both cell states obtained by RNA-seq (Fig. 2d–f ). Thus, our data indicated that the difference in codon usage in self-renewing and differentiating hESCs was already present
A
B
C
D
E
F
G
Fig. 1Profiling mRNA expression and translation in self-renewing and differentiating hESCs.aTreatment regime to differentiate the hESCs (H9) by removing FGF-2 from and adding retinoic acid (RA) to the culture medium. Four replicates of self-renewing (H9self) and differentiating (H9diff) hESCs were used for RNA-seq and Ribo-seq analyses.bExpression heatmap of pluripotency (blue) and lineage (red) markers measured by RNA-seq and Ribo-RNA-seq. Expression is shown as log2difference to the mean. Markers in each group are ordered by decreasing expression.c,dMA plots
showing the log2fold change of differentiated (diff) versus self-renewing (self) hESCs against mean expression in either RNA-seq (c) or Ribo-seq
[image:3.595.58.537.89.542.2]at the mRNA level. Possible underlying mechanisms causing the distinct codon usage in self-renewing and differentiating hESCs are for example DNA transcription or RNA decay.
The use of optimal codons can enhance mRNA stability and translation, and this effect is evolutionary conserved [37–40]. To address whether optimal codons enhanced mRNA stability in the two cell states, we calculated the relative enrichment of stabilizing and destabilizing codons (Additional file1: Figure S2A) using a codon classification made in zebrafish [39]. The upregulated mRNAs in both conditions showed a slight depletion of strongly destabiliz-ing codons (Additional file1: Figure S2B). When we mea-sured the difference between the self-renewing and differentiating genes, we found that upregulated mRNAs in self-renewing hESCs contained significantly fewer de-stabilizing codons and slightly more highly de-stabilizing co-dons (Additional file 1: Figure S2B; right-hand panels). The association of GC content at the third nucleotide of a codon to high levels of mRNAs was however more pro-nounced than the association to stabilizing and destabiliz-ing codons (Additional file 1: Figure S2C, D). Together, these data demonstrated that abundant mRNAs in both the self-renewing and differentiated state were biased to-wards a higher GC content, but that in addition, codon optimality contributed to the codon usage differences be-tween the two cell states.
GC content defines groups of genes with common function
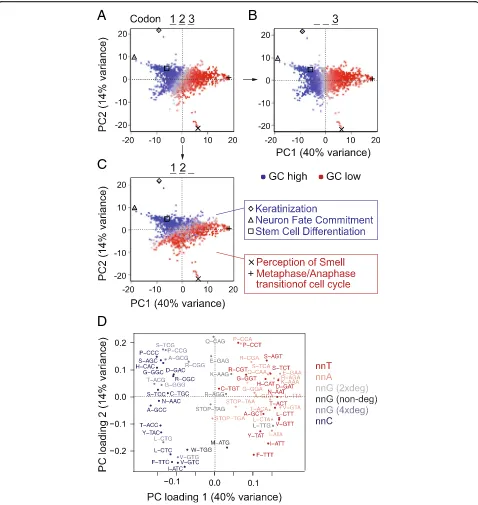
Underlying GC content can substantially contribute to codon usage differences among different cell states [9,41,42]. We therefore analysed codon usage in genes belonging to various functional categories, including those deployed during self-renewal and differentiation of hESCs. We selected all well-annotated coding sequences and grouped them according to their Gene Ontology (GO) terms. We calculated the average of codon frequencies per GO term and used principal com-ponent analysis (PCA) to reveal the underlying sources of variance. The GO terms were primarily separated by GC content (Fig. 3a); indeed, the first principal component closely corresponded to the GC content of the third codon base (Fig.3b). The second principal component reflected the GC content at the first and second bases (Fig.3c). Accord-ingly, genes belonging to similar GO terms such as cell dif-ferentiation and neuron fate commitment had similar and high GC content (blue) (Fig.3c; right panels).
It was unexpected that all three codon positions sepa-rated the GO terms according to GC content. While the third and variable base position of codons can be readily varied to optimize translation rates without impacting the encoded amino acids [5], changes in the first and second positions almost always result in a different amino acid. Nevertheless, we found that genes belonging to different functional categories were characterized by
A
B
C
D
E
F
Fig. 2Genomic GC content influences codon usage.a–fOverview of codon (a,b,d,e) and amino acid (c,f) enrichment in differentially expressed genes measured by Ribo-seq (a–c) and RNA-seq (d–f). Enrichment was calculated as log2fold change of codon or amino acid
[image:4.595.56.540.87.346.2]different codon usage and that this correlated with GC content.
Using a PCA loading plot, we identified the codons driving the global separation by GC content (Fig. 3d). Codons with cytosine at the third position contributed to the left and codons with adenosine or thymidine at
the third position contributed to the right of the plot. As described for our own differentiation data (Fig. 2b, e), only four-fold degenerate codons with guanosine at the third position contributed to the left of the PCA plots (Fig. 3d). The high level of similarity between the global PCA analysis of all genes and our differentiation
A
B
C
D
[image:5.595.59.537.87.592.2]experiment suggested that genes with similar functions share similar inherent genomic features. In conclusion, genomic GC content influences codon choice in the dif-ferentiation gene expression programme.
Self-renewing ESCs share a common codon signature at the ribosome A- and P-sites
While GC content was one factor for codon usage optimization, protein translation efficiency is likely to be regulated by additional factors. The translation kinetics of codon-anticodon pairs in the ribosome are complex and determined by the availability and binding affinity of matching and mismatching tRNAs [5, 43, 44]. In part, the translation rate is directed by the competition be-tween near-cognate and cognate aminoacyl-tRNAs en-tering the ribosome. Therefore, we asked whether self-renewing and differentiating hESCs showed differential codon stalling at the active sites of the ribosome.
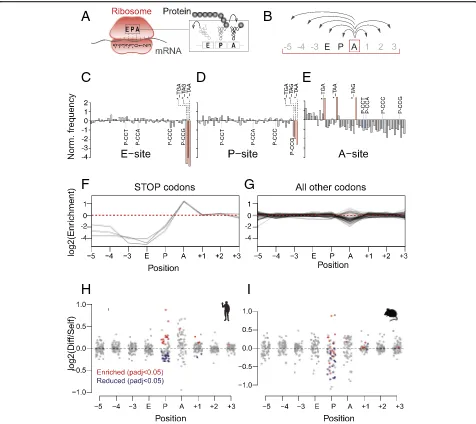
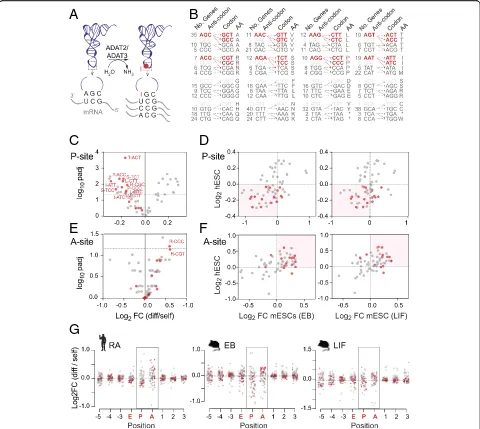
During translation, only three codons actively pair with tRNAs, known as the ribosome E-, P-, and A-sites (Fig.4a). Cognate aminoacyl-tRNAs enter the ribosome at the A-site. After transfer of the polypeptide chain to the tRNA, the tRNA moves from the P- to the E-site and is then released from the ribosome. Although the ribosome only actively engages with three codons within an RNA, it covers more than 27 nucleotides (Fig. 4a). Due to the three-nucleotide periodicity reflecting the triplet nature of the genetic code (Additional file1: Figure S1E, F) [45], the actively bound codons at the E-, P-, and A-sites can be calculated by counting nucleotide triplets from the 3′end of the read fragments. We numbered the ribosome-protected codons from−5 to + 3, with 0 corresponding to the A-site (Fig.4a). We first calculated the codon frequen-cies per footprint position. To do so, we compared the relative frequency of a codon at the ribosome P- (or A-) site to the frequency of this codon in all Ribo-seq reads from the sample.
As expected, some codons occurred more frequently than others (Additional file 1: Figure S3A-C). Since the codon frequencies at the positions flanking the tRNA-bound sites (−5 to−3, and + 1 to + 3) are expected to follow the genomic codon distribution, they served as a negative control. We then normalized the raw frequen-cies to the frequency across all nine positions (Fig. 4b). This will correct for differences in mRNA abundance, and neither transcriptional nor differences in mRNA decay should affect the following analysis. The strong enrichment of stop codons at the A-site and their deple-tion at the P- and E-sites validated this approach (Fig. 4c–e). Although Proline incorporates more slowly in translation [46], its codons were not strongly enriched at the A-, P-, or E-site (Fig. 4c–e). When we compared the enrichment of codon frequencies along all sites in the ribosome, we found the highest variation at the
A-site (Fig. 4f, g), indicating that the stalling at the A-site was rate limiting for translation elongation [47,48].
Next, we tested whether the normalized codon frequen-cies differed in self-renewing and differentiating hESCs (Fig. 4h). We observed differences at both the A- and the sites, yet most significant differences occurred at the P-site (Fig.4h; Additional file1: Figure S3D). To test whether the codon usage differences in human ESCs was an evolu-tionarily conserved feature of translational control, we per-formed similar analyses using published Ribo-seq and RNA-seq data obtained from self-renewing and differentiat-ing mouse embryonic stem cells (mESCs) [49]. The exit of pluripotency and differentiation of the mESCs was induced using two well-established methods: the withdrawal of leukemia inhibitory factor (LIF) from the culture medium and by growing the mESCs as embryoid bodies (EBs) [50–52]. As described for hESCs, we excluded rRNA and tRNA reads and selected read lengths with high reading frame periodicity (Additional file1: Figure S4A-E). Again, most differences occurred at the A- and P-sites (Fig.4i). Although the mouse data were noisier, the significantly depleted codons at the P-site in differentiated hESCs were often also less common in differentiated mESCs (Fig.4h, i; Additional file1: Figure S4F; blue dots). Thus, we found a distinct set of codons with a higher like-lihood of being stalled at the ribosome P-site in mouse and human self-renewing embryonic stem cells.
A prominent self-renewing codon signature is hetADAT-sensitive
A key factor modulating codon translation is tRNA se-lection [19]. To enhance codon binding, the tRNA wob-ble nucleoside (position 34) frequently carries chemical modifications [53]. One such prominent and essential tRNA modification is wobble inosine [54,55]. Inosine is formed by a deamination reaction of adenosine and cata-lyzed by the heterodimeric enzyme adenosine deaminase acting on tRNA (hetADAT) composed of two subunits ADAT2 and ADAT3 (Fig. 5a) [56]. While tRNAs carry-ing adenosine at position 34 (A34) pair with uracil, in-osine (I34) is capable of pairing with adenin-osine, uracil, and cytosine and thereby enhances translation efficiency (Fig. 5a) [11, 57]. In eukaryotes, the modification is present in eight different tRNAs that recognize the eight nnT codons. Inosine in tRNAs is required to translate nnC codons that have none or few tRNA gene copies (Fig. 5b) [58]. In principle, the same tRNAs can also bind eightnnA codons, yet these codons are also trans-lated by their own complementary tRNAs.
(Fig. 5c). Moreover, these differential codon frequencies highly correlated between human and mouse (Fig. 5c). Thus, mouse and human differentiating ESCs showed a depletion of hetADAT-dependent codons at the P-site. As described above, due to the high variability of codon frequencies at the A-site, we were unable to identify sig-nificant changes (Fig. 4h). However, when we now plot-ted the A34I-dependent codons, we found the vast
majority of them enriched at the A-site in both mouse and human differentiating ESCs (Fig.5e, f; Additional file4: Table S3a,b). Finally, we confirmed that this distribution was specific to the A- and P-sites and did not occur at any other site in the ribosome (Fig.5g). In summary, we found that in self-renewing ESCs hetADAT-dependent codons occurred less often at the ribosome A-site but more often at the P-site when compared to differentiated ESCs.
A
B
C
D
E
F
H
I
G
Fig. 4Distinct codon signature at the ribosome A- and P-sites in self-renewing ESCs.aIllustration of a ribosome binding to mRNA protecting at least nine codons (position−5 to + 3) from degradation by the RNase digestion. Positions−2,−1, and 0 correspond to the E-, P-, and A-site that host the charged tRNA.bThe raw codon frequency was calculated for each specific codon (e.g. A-site) and normalized to the mean frequency across all nine positions. Calculations were done separately for self-renewing and differentiating samples.c–eCodon enrichment at the E- (c), P- (d), and A-sites (e). Stop codons are highlighted in red, and proline codons are highlighted in blue. The codons are sorted according to their frequency (shown in Additional file1: Figure S3A-C).f,gCodon enrichment of stop (f) or all other codons (g) across all ribosome-protected codons.hLog2fold
change of normalized codon usage in differentiated versus self-renewing hESCs across all ribosome-protected codons. Significantly different codons (Welch’st-test; FDR correction) are marked in red (enriched) and blue (reduced) and occur mainly at the P-site.iLog2fold change of normalized
[image:7.595.60.536.87.511.2]The time it takes the ribosome to ensure that a tRNA in its A-site is indeed a cognate tRNA for the codon, is con-sidered rate limiting for translation elongation [59,60]. In addition, whenever a ribosome is bound to an mRNA waiting for a cognate tRNA at its A-site, a tRNA is already bound to its P-site, attached to the growing polypeptide chain. Thus, the lower frequency of hetADAT-dependent codons at the A-site indicated their faster translocation to the P-site in self-renewing ESCs.
hetADAT regulates codon usage in self-renewing embryonic stem cells
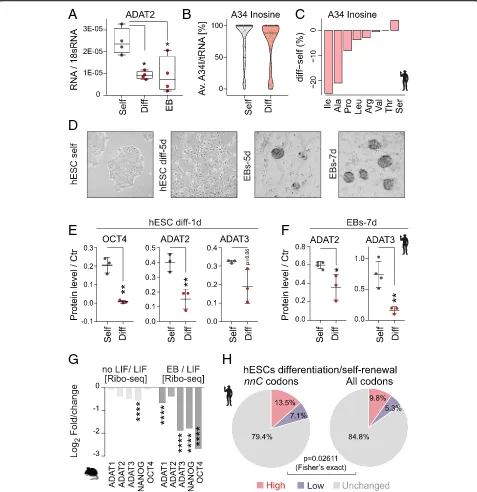
The lower frequencies of hetADAT-dependent codons at the A-site of ribosomes in self-renewing ESCs might in-dicate an enhanced activity of the catalytic complex. In-deed, the mRNA level of ADAT2 was significantly higher in self-renewing hESCs when compared to RA-differentiated cells or EBs (Fig. 6a). To quantify the levels of inosine in hetADAT-dependent tRNAs, we
A
B
C
D
E
F
G
Fig. 5Distinct codon usage signature in pluripotent cells are hetADAT-sensitive codons.aIllustration of hetADAT (ADAT2 and ADAT3)-mediated adenosine-to-inosine tRNA editing at position 34 in the anticodon loop and the codons read by unmodified and modified tRNAs.b HetADAT-dependent codons (red) that sometimes are lacking corresponding tRNA genes (light gray).c–fVolcano plot (c,e) showing significance versus codon usage fold change at the ribosome P-site (c) and A-site (e) in differentiated versus self-renewing hESCs. HetADAT-dependent codons are highlighted in red. Correlation (d,f) between log2fold change of codon usage frequencies in differentiated human (hESCs) with differentiated
mouse (mESCs) embryonic stem cells through embryoid body culture (EB; left-hand panel) or by removal of LIF (right-hand panel) at the P-site (d) and A-site (f).gLog2fold change of codon usage frequency across all sites protected by the ribosome in human (left-hand panel) and mouse
[image:8.595.58.538.88.517.2]A
B
C
D
E
F
G
H
Fig. 6HetADAT-dependent translation in mouse and human ESCs.aRT-qPCR confirming downregulation of ADAT2 mRNA levels in differentiated hESCs (Diff) and embryoid bodies (EB) compared to self-renewing hESCs (Self). *p< 0.05 one-way ANOVA.bDistribution of wobble inosine (A34I) levels per tRNA (> 10 reads) shown as Violin plot with median (black line) and quartiles (dotted line).cDifferences of inosine levels at A34 in differentiated versus self-renewing hESC per tRNA isotype.dLight microscopic image of self-renewing (self) human embryonic stem cells (hESCs), differentiated hESCs for 5 days (5d), and embryoid bodies (EBs) after 5 and 7 days in suspension.eQuantification of protein expression using Western blotting of OCT4, ADAT2, and ADAT3 in self-renewing (grey) and differentiating (red) hESCs for 1 day. **p< 0.01 unpairedt-test.fQuantification of protein levels using Western blotting of ADAT2 and ADAT3 after differentiating hESCs into EBs for 7 days (7d). *p< 0.05; **p< 0.01 unpairedt-test.gLog2
[image:9.595.59.536.88.580.2]performed tRNA sequencing in self-renewing and differ-entiated hESCs (Additional file 5: Table S4). We used the fact that inosine will form the strongest bond to cytosine and is therefore reported as a guanine during sequencing. The level of A34I modifications can thus be quantified by measuring the A-to-G substitutions at the anticodon wobble position (Additional file 6: Table S5). The A34I tRNA modification levels were significantly higher in self-renewing (83–86%) than differentiated (60–79%) hESCs (p= 0.031; Student’s t test) (Fig. 6b). Accordingly, the A34I modification occurred less often in the majority of hetADAT-dependent tRNA isotypes (Fig. 6c). Thus, self-renewing hESCs have higher levels of A34I tRNA modifications than differentiating cells.
Next, we confirmed that also the protein levels of ADAT2 and ADAT3 decreased with differentiation of hESCs (Fig. 6d–f; Additional file 1: Figure S5A-E). ADAT2/3 protein expression was significantly reduced after only 1 day of treatment with retinoic acid (Fig. 6e; Additional file 1: Figure S5D). Downregulation of hetA-DAT was further confirmed when the hESCs were grown in suspension to induce their differentiation into EBs (Fig.6f; Additional file1: Figure S5E). Similarly, translation of mouse ADAT2 and ADAT3 was downregulated upon differentiation, yet the differences were only significant when compared to differentiated EBs (Fig.6g).
Finally, we asked whether the optimized codon usage in self-renewing ESCs resulted in differential translation of hetADAT-dependent codons. We calculated the total frequency of the eight nnC codons that rely on the in-osine modification for translation in all genes (Fig. 5b). Then, we selected all coding sequences containing more than 28.4% (top 1%)nnC codons and asked whether they showed translational differences in self-renewing versus differentiated hESCs that were independent of mRNA levels. Comparing the two cell states, we found that translation of 13.5%nnC-high coding sequences was en-hanced and 7.1% repressed (> 2-fold) (Fig.6h; left panel). This difference in translation ofnnC-enriched genes was significantly different when compared to all coding se-quences (Fig. 6h; right panel). Thus, the differential translation of nnC-high coding sequences in self-renewing hESCs cannot be explained by differences in RNA abundance alone.
Together, our data suggest that self-renewing ESCs translate hetADAT-dependent codons with higher effi-ciency when compared to differentiating ESCs. This dif-ference in hetADAT-dependent codon usage occurred independently of the nature of the differentiation stimu-lus and was conserved in mice.
Discussion
Protein synthesis is a fundamental process in all cells, yet recent studies revealed distinct regulatory functions
of the mRNA translation machinery in stem cells. Low global protein translation rates are commonly found in adult undifferentiated stem and progenitor cells and are required to maintain a fully functioning stem cell state [61–63]. Mouse embryonic stem cell differentiation also correlates with an overall increase in protein synthesis and enhanced mRNA loading into polyribosomes [64]. One explanation for the differences in protein synthesis might be the expression of distinct tRNA pools that optimize codon usage in different cell states [6]. How-ever, the use of tRNA concentrations to understand codon usage is hampered by the fact that in addition of being crucial adaptors during translation, tRNAs are im-portant regulators of a wide range of biological processes [65]. An alternative method to analyse codon usage is ribo-some profiling, which has been applied to various organ-isms and cell contexts, for example amino acid starvation, oxidative stress, the perturbation of signalling pathways, and embryonic stem cell differentiation [49,66–69].
Here, we use ribosome profiling to analyse the import-ance of optimized codon usage in regulating gene ex-pression in different cell states. Our work identifies a codon bias in self-renewing and differentiating stem cells, and we propose that this is driven by both mRNA levels and translational mechanisms. Genes belonging to the same functional category use similar codons charac-terized by differences in GC content. Since we measured similar GC content enrichment in up- and downregu-lated genes, our observed differences are unlikely to be directly linked to mRNA degradation. Our data is con-sistent with those of previous studies in Neurospora, where codon usage strongly correlated with protein and mRNA levels genome-wide but was largely independent of mRNA translation and stability [70].
The existence of a nuclear (GC content) and a cyto-plasmic (translation) mechanism that both determine codon usage during stem cell differentiation raises the question of how they are connected. It is plausible that a cytoplasmic tRNA modification-driven codon bias may help to overcome a GC-content-driven codon usage for cell type-specific mRNAs, thereby enhancing translation of certain groups of mRNAs. However, the functional analyses on how precisely hetADAT regulates codon usage and how this influences gene expression in pluri-potent embryonic stem cells is hampered by the fact that ADAT2/3 is essential for cell survival [56]. Knock-down of hetADAT causes cell death in human cells. Over-expression also affects cell survival because ADAT2/3 is a highly mutagenic enzyme [72]. Therefore, ADAT2/3-mediated C to U deamination at position 32 requires the prior formation of 3-methylcytosine in Trypanosoma brucei [73]. Thus, increasing the hetADAT levels might not be sufficient to increase inosines specifically at the wobble positions.
Together, we provide evidence for an hetADAT-dependent codon bias in self-renewing embryonic stem cells that might suppress differentiation and lineage commitment.
Conclusion
In this study, we used RNA-seq and Ribo-seq to de-cipher transcriptional and translational mechanisms regulating codon bias in self-renewing and differentiat-ing human embryonic stem cells. We revealed that codon usage during stem cell differentiation is regulated at the mRNA levels and during translation. We confirm that codon usage of differentially expressed genes is pri-marily characterized by genomic GC content. Further-more, we reveal a novel mechanism based on tRNA modifications that regulate codon usage in pluripotent embryonic stem cells. Translation of codons that depend on the hetADAT-mediated inosine formation in the anti-codon loop of tRNAs are under-represented at the ribo-some A-site. The reduced stalling of these codons at the A-site implies their enhanced translation in self-renewing embryonic stem cells when compared to differ-entiated cells. Thus, we reveal that tRNA modifications contribute to optimized codon usage in self-renewing embryonic stem cells.
Material and methods
Human embryonic stem cell culture and differentiation
The human embryonic stem cell (hESC) line Hues9 (H9) was obtained from the Wicell Research Institute (Madi-son, WI). hESCs were maintained in Essential 8 media (Thermo Fisher Scientific) on hESC-qualified Matrigel (Corning)-coated plates at 37 °C with 5% CO2. Cultures
were dissociated in clumps using 0.5 mM EDTA in PBS
every 4 days and media was renewed daily. Differentiat-ing hESCs were cultured in MEF-conditioned KSR media plus 1 μM retinoic acid in DMSO for 5 days, while the control hESC population was maintained ei-ther in MEF-conditioned KSR media completed with 4 ng/ml FGF2 or Essential 8 media (Thermo Fisher Scien-tific). During the course of the experiment, the media were replaced daily. KSR media consists of 85% KO-DMEM (Thermo Fisher Scientific), 15% KO-serum replacement (Life Technologies), 1 mM Glutamax (Thermo Fisher Scientific), 0.1 mM 2-mercaptoethanol (Thermo Fisher Scientific), and 0.1 mM non-essential amino acids (Thermo Fisher Scientific). In the embryoid body experiments, 70% confluent hESCs were dissoci-ated in clumps using 0.5 mM EDTA in PBS and seeded in ultra-low attachment well plates (Corning) maintain-ing a 1:1 dilution factor. hESCs were cultured in Essen-tial 6 media (Thermo Fisher Scientific) plus 10μM rock inhibitor (Y-27632) (Stem Cell Technologies Canada) for the first 24 h and for further 4 to 6 days in Essential 6 media (Thermo Fisher Scientific), when samples were collected for qPCR or Western blot experiments.
RNA, qPCR, and Western blot
Total RNA was extracted using TRIZOL (Thermo Fisher Scientific) according to the manufacturer instructions. Reverse transcription was performed using SuperScript III Reverse Transcriptase (Thermo Fisher Scientific) and random primers (Promega). Quantitative PCR were run using TaqMan probes (Thermo Fisher Scientific) for eukaryotic 18S rRNA (X03205.1), ADAT2 (Hs00699339_ m1) CDX2 (Hs01078080_m1), DLX3 (Hs00270938_m1), DLX5 (Hs01573641_mH), DNMT3B (Hs00171876_m1), FOXD3 (Hs00255287_s1), GATA6 (Hs00232018_m1), HOXA1 (Hs00939046_m1), NANOG (Hs02387400_g1), POU5F1 (Hs03005111_g1), PRDM14 (Hs01119056_m1), and TDGF1 (Hs02339497_g1).
Protein extracts used for western blotting were pre-pared in RIPA buffer (50 mM sodium chloride, 1.0% NP-40, 0.5% sodium deoxycholate, 0.1% SDS, 50 mM Tris, pH 8.0). The antibodies used in the experiments were anti-HSP90 13119) 1:5000 and anti-OCT3/4 (sc-5279) 1:1000 both from Santa Cruz Biotechnologies and anti-ADAT2 (ab135429) 1:1000 and anti-ADAT3 (ab125514) 1:1000, both from Abcam. The Western blot band intensity was measured using ImageJ.
Immunofluorescence
blocked for 1 h at room temperature using 10% donkey serum in PBS. Anti-ADAT2 (ab135429) 1:100 and anti-ADAT3 (ab125514) 1:100 primary antibodies were incu-bated overnight in the same blocking solution. Alexa Fluor secondary antibodies (Thermo Fisher Scientific) were used at a dilution of 1:500 in blocking solution. Nuclei were counterstained using DAPI. Images were acquired on a Leica SP8 Confocal microscope and processed.
Preparation of RNA-seq, Ribo-seq, and tRNA seq libraries
Total RNA from self-renewing and differentiated hESCs (four biological replicates per condition) was extracted using Trizol according to the manufacturer’s instruction. Total RNA was treated with the RiboZero Magnetic Kit (Epicentre, MRZH11124) to remove ribosomal RNA. Li-braries for sequencing were prepared using the NEB ultra-directional library prep kit (NEB).
Ribosome-protected RNA was isolated as described before [61, 74]. Briefly, at the indicated time points, H9 cells (4 replicates) were washed with PBS and lysed in 20 mM Tris-Cl (pH 7.4), 150 mM NaCl, 5 mM MgCl2, 1 mM dithiothreitol (DTT) (Sigma), 1% Triton X-100 (Sigma), 25 U ml−1 of Turbo DNase I (Thermo Fisher Scientific), and 100μg ml−1 of cycloheximide (Sigma). After passing the lysates ten times through a 26-G nee-dle, they were spun down at 13,000 rpm for 10 min. Di-gestion with RNaseI (100 Uμl−1, Thermo Fisher Scientific) for 45 min at room temperature was used to produce ribosome mRNA footprints. The RNaseI diges-tion was inhibited with SuperaseIN (Thermo Fisher Sci-entific), and lysates were fractionated on a 1 M sucrose cushion by ultracentrifugation at 45,000 rpm in a 70Ti rotor for 9 h at 4 °C. The ribosome mRNA footprints were further purified using Qiazol reagent. Footprints with a length of 26–34 nucleotides were size selected on 15% TBE-urea gel (Thermo Fisher Scientific) and 3′-dephosphorylated with T4 polynucleotide kinase (10 U, NEB). All samples were multiplexed and sequenced on the HiSeq2500 platform (Illumina). The NGS data are up-loaded onto GEO (GSE123611): Bornelöv S, Selmi T, Flad S, Dietmann S, Frye M. Codon usage optimization in pluripotent embryonic stem cells. Datasets. Gene Expression Omnibus.https://www.ncbi. nlm.nih.gov/geo/query/acc.cgi?acc=GSE123611(2019).
For tRNA sequencing, differentiating, and self-renewing, H9 (four replicates per condition) were col-lected in TRIZOL (Thermo Fisher Scientific) at day 5 of differentiation. Fifty microgrammes of total RNA sam-ples was DNaseI digested (Ambion) at 37 °C for 30 min. The treated samples were then subjected to phenol-chloroform extraction and isopropanol precipitation and resuspended in 1 mM EDTA 0.1 M Tris-HCl (pH 9.0). One microgramme of each replicate was used to gener-ate cDNAs and perform qPCR to confirm differenti-ation. The remaining sample was heated at 37 °C for 30
min in order to de-aminoacylate tRNAs. Subsequently, samples were heated for 5 min at 80 °C and then loaded on a Novex™ TBE-Urea polyacrylamide gel (Thermo Fisher Scientific). A gel fragment spanning from 50 to 100 nucleotides, according to the Abnova RNA marker low easy, was excised from the gel and resuspended in 400 μl of a solution of 300 mM NaAc pH 5.5, 1.0 mM EDTA, and 0.25% SDS. RNA was extracted by a cycle of 30-min freezing at −80 °C followed by overnight gentle mixing at room temperature in the same buffer, and subse-quently was ethanol precipitated. RNA ends of any tRNA fragments were phosphorylated by treatment with 20 U of T4 Polynucleotide Kinase (NEB) supplemented with ATP (NEB). Following heat inactivation and phenol chloroform extraction, and isopropanol precipitation, samples were subjected to library preparation using the Illumina Truseq small RNA kit (Illumina). Samples were multiplexed and sequenced on the HiSeq4000 platform (Illumina).
Processing of RNA-seq, Ribo-seq data, and tRNA-seq data
Human RNA-seq and Ribo-seq data were obtained as described above. Mouse RNA-seq and Ribo-seq data with accession numbers SRR315620-SRR315627 and SRR31591-SRR31600 were downloaded from the NCBI short read archive [49]. Trim_galore! was used to trim small RNA adapters from the human data (auto-detected under default settings) or polyadenylation sequences from the mouse data (using the parameters“--stringency 1” and “--adapter” with ten “A” followed by multiple
“N”). Trimmed reads shorter than 20 nt were discarded. Alignment was done using Tophat2 (v2.1.0) [75]. The RNA-seq reads were aligned directly to the reference genome (hg38 or mm10). Ribo-seq reads were firstly aligned to a set of known rRNA and tRNAs (selected from the UCSC RepeatMasker tracks), followed by align-ment of all unmapped reads to the reference genome. An index with known transcripts (Gencode v23 or Gen-code vM9) were provided for the genome alignment, and novel splice junctions were permitted [76, 77]. Multi-mapping read alignments were not used.
For tRNA-seq data analyses, Trim galore! with
“--paired --stringency 6 -a TGGAATTCTCGG -a2 GATCGTCGGACT” was used to trim small RNA adapters and to remove reads shorter than 20 nucleo-tides. Alignment was done using bowtie [78] with “-n 2 -y -k 1 --nomaqround --allow-contain” to allow for up to two mismatches in the alignment and to report one alignment per read. The reads were aligned to the 430 tRNAs from the high-confidence set in GtRNAdb [79]. Introns were removed, and the“CCA”tail was added be-fore creating the bowtie index.
with an A-to-G substitution at position 33–35. The pres-ence of the expected anticodon in the referpres-ence se-quence was used to verify that only substitutions at the correct nucleotide were counted. We identified 21 Ala, 7 Arg, 8 Ile, 9 Leu, 9 Pro, 8 Ser, 7 Thr, and 9 Val tRNAs with at least one mapped read supporting the substitu-tion. These are the same eight tRNA isotypes that were expected to be modified. Next, we estimated the overall modification level per sample as the percentage of reads supporting the modification (A-to-G substitution) across all 78 modified tRNAs.
Meta-gene profile
DeepTools were used to quantify the Ribo-seq coverage across the whole reference genome [80]. Each strand was quantified separately, and a blacklist file containing all rRNA, tRNA, snoRNA, snRNA, and miRNA was pro-vided. The bin size was set to 1 and an offset of 12 was used to only consider a single nucleotide corresponding to the “P” site predicted from each read. A meta-gene profile for all protein coding genes was then computed using computeMatrix with the parameters “scale-regions -b 500 --unscaled5prime 200 --regionBodyLength 1000 --unscaled3prime 200 -a 500” to define relative coordi-nates and“--metagene --exonID CDS --transcriptID gene --transcript_id_designator gene_id” to define the coding sequence of each gene. Finally, a trimmed mean was used to exclude the most extreme value at each position.
Differential mRNA levels and translation
Gene models were downloaded from Gencode (v23 for human and vM9 for mouse).FeatureCounts was used to quantify the number of reads per gene, represented by either all annotated exons (RNA-seq) or all annotated coding sequences (Ribo-seq) [81]. Only reads aligning to the sense strand of the gene and with mapping quality of at least 20 was counted. For the paired-end RNA-seq, the additional flags “-B -C” were specified to exclude chimeric reads and/or reads mapping with only one end. Differential mRNA expression and translation analyses were done with DESeq2 [82]. The heatmaps were cre-ated using the R package pheatmap ( https://CRAN.R-project.org/package=pheatmap), and the amino acid logo was created using the DiffLogo package [83].
Determining read periodicity and the position of the ribosome P-site
Ribosome profiling data display 3-nt periodicity, but the reading frame of the 5′read ends differ between different experiments and even between read lengths within the same experiment. The human data showed the strongest periodicity for reads of length 27–29 (Additional file 1: Figure S1E-F), the 5′ end of those reads were highly enriched for the first codon position, and the most
frequent starting position was located 12 positions up-stream of the TIS. We therefore decided to base our codon analysis in humans on these three read lengths and to extract read position 12–14 as the P-site codon.
The mouse data showed different dominating reading frames for different read lengths (Additional file 1: Figure S4C). To predict the strongest reading frame for each read length, we again calculated the number of reads starting from each position around the TIS (see Additional file 1: Figure S4D for an example). Next, we counted the most frequent reading frame both per codon (from codon position −7 to + 32 relative to the TIS) and across the whole region. We excluded read lengths where the reading frame that was most abundant in the highest number of codons was different from the one that was most abundant in total. Furthermore, we required the most abundant reading frame was at least five-fold more abundant than the second most abundant both in terms of the number of codons and in total. This resulted in read lengths 26, 29, 31–36, and 39 being se-lected for the mouse data. Out of these, read length 39 was later excluded due to having substantially fewer reads and showing poor correlation to the others. Since the highest number of reads started 13 or 14 positions upstream of the TIS (depending if frame 3 or 2 was most abundant), we trimmed one or two nucleotides of the reads in the subsequent analysis so that the P-site would still be located at read position 12–14 similar to the human data.
Extracting codon counts per position relative to the A-site
not. We therefore concluded that we were counting co-dons from the correct frame for each included read length for both human and mouse.
Codon enrichment
The number of codon occurrences were counted separ-ately for each ribosome-protected codon position and converted into a fraction of the total number. Normal-ized codon counts were obtained by dividing the codon fraction at a specific position by the mean fraction across all nine positions. Significant differences in nor-malized codon enrichment were calculated using Stu-dent’s t test using the four biological replicates per cell state. The p values were corrected for multiple testing using FDR correction. The figures are showing the signal across pooled replicates.
GO term analysis
Coding sequences were downloaded from the consensus CDS project. GO relations (go-basic.obo) were down-loaded from the Gene Ontology Project (http://www. geneontology.org) and parsed using the Perl module GO::Parser. Relative codon frequencies were calculated per gene and then averaged per GO term. Only GO terms with at least 40 genes were considered. The PCA analysis was performed inRusing the methodprincomp using the correlation matrix.
Additional files
Additional file 1:Figures S1 to S5.Including figure legends. (PDF 1667 kb)
Additional file 2:Table S1.RNA-seq and Ribo-seq data in the four rep-licates of self-renewing (self) and differentiating (diff) human embryonic stem cells. (XLSX 4135 kb)
Additional file 3:Table S2.Gene enrichment analyses (EnrichR) identifies highly expressed genes in tissues derived from all three germ layers using ARCHS4 enrichment tool. (XLSX 11 kb)
Additional file 4:Table S3.Distribution of hetADAT targets at ribosome covered codons in (a) differentiated versus self-renewing hESCs. The A-site is highlighted in yellow and (b) differentiated embryoid bodies (EB) versus self-renewing mESCS. The A-site is highlighted in yellow. (XLSX 13 kb)
Additional file 5:Table S4.tRNA sequencing in self-renewing and dif-ferentiated (5 days) human embryonic stem cells. (XLSX 10 kb)
Additional file 6:Table S5.tRNA sequencing to quantify inosine levels in differentiated (diff) and self-renewing (self) human embryonic stem cells. (XLSX 26 kb)
Acknowledgements
We thank John Marioni and Duncan Odom for their advice on analysing the sequencing data. We thank Maria Rostovskaya and Tüzer Kalkan for guidance on selecting the markers for pluripotency and lineages. We are most grateful to the CR-UK CI Genomics and Bioinformatics and the WT-MRC Cambridge Stem Cell Institutes Core Facilities, in particular many thanks to James Had-field and Maike Paramor.
Authors’contributions
TS and SF designed and conducted the experiments. SB analysed data and performed statistical analysis. SD provided guidance for the analyses of the
genome-wide data. TS, SB, and MF designed and supervised the study and wrote the manuscript. All authors read and approved the final manuscript.
Funding
This work was funded by Cancer Research UK (CR-UK; C10701/A15181). Parts of this research in Michaela Frye’s laboratory were supported by core funding from Wellcome and MRC to the Wellcome-MRC Cambridge Stem Cell Institute.
Availability of data and materials
The sequencing data used in our study have been deposited in NCBI’s Gene Expression Omnibus and are accessible through the GEO accession number GSE123611 [84].
Ethics approval and consent to participate
Not applicable.
Consent for publication
Not applicable.
Competing interests
MF is consulting for STORM Therapeutics. All other authors declare that they have no competing interests.
Author details
1Department of Genetics, University of Cambridge, Downing Street,
Cambridge CB2 3EH, UK.2German Cancer Research Center (DKFZ), Im Neuenheimer Feld 280, 69120 Heidelberg, Germany.3Wellcome Trust–
Medical Research Council Cambridge Stem Cell Institute, University of Cambridge, Tennis Court Road, Cambridge CB2 1QR, UK.
Received: 11 April 2018 Accepted: 23 May 2019
References
1. Kalkan T, Smith A. Mapping the route from naive pluripotency to lineage specification. Phil Trans R Soc. B369:20130540.https://doi.org/10.1098/rstb. 2013.0540.
2. Dunn SJ, et al. Defining an essential transcription factor program for naive pluripotency. Science. 2014;344(6188):1156–60.
3. Li M, Belmonte JC. Ground rules of the pluripotency gene regulatory network. Nat Rev Genet. 2017;18(3):180–91.
4. Sharp PM, Li WH. An evolutionary perspective on synonymous codon usage in unicellular organisms. J Mol Evol. 1986;24(1–2):28–38.
5. Quax TE, et al. Codon bias as a means to fine-tune gene expression. Mol Cell. 2015;59(2):149–61.
6. Gingold H, et al. A dual program for translation regulation in cellular proliferation and differentiation. Cell. 2014;158(6):1281–92.
7. Ingolia NT. Ribosome profiling: new views of translation, from single codons to genome scale. Nat Rev Genet. 2014;15(3):205–13.
8. Kudla G, et al. Coding-sequence determinants of gene expression in Escherichia coli. Science. 2009;324(5924):255–8.
9. Rudolph KL, et al. Codon-driven translational efficiency is stable across diverse mammalian cell states. PLoS Genet. 2016;12(5):e1006024. 10. Soll D, et al. Specificity of sRNA for recognition of codons as studied by the
ribosomal binding technique. J Mol Biol. 1966;19(2):556–73. 11. Crick FH. Codon--anticodon pairing: the wobble hypothesis. J Mol Biol.
1966;19(2):548–55.
12. Agris PF, Vendeix FA, Graham WD. tRNA’s wobble decoding of the genome: 40 years of modification. J Mol Biol. 2007;366(1):1–13.
13. Torres AG, Batlle E, Ribas de Pouplana L. Role of tRNA modifications in human diseases. Trends Mol Med. 2014;20(6):306–14.
14. Schaffrath R, Leidel SA. Wobble uridine modifications-a reason to live, a reason to die?! RNA Biol. 2017;14(9):1209–22.
15. Rafels-Ybern A, Attolini CS, Ribas de Pouplana L. Distribution of ADAT-dependent codons in the human transcriptome. Int J Mol Sci. 2015;16(8): 17303–14.
human mitochondrial tRNA(met). Nat Chem Biol. 2016;12(7):546–51. 18. Haag S, Sloan KE, Ranjan N, Warda AS, Kretschmer J, Blessing C, Hübner B,
Seikowski J, Dennerlein S, Rehling P, Rodnina MV, Höbartner C, Bohnsack MT. NSUN3 and ABH1 modify the wobble position of mt-tRNAMet to expand codon recognition in mitochondrial translation. EMBO J. 2016;35(19):2104–19.
19. Nedialkova DD, Leidel SA. Optimization of codon translation rates via tRNA modifications maintains proteome integrity. Cell. 2015;161(7):1606–18. 20. Chan CT, et al. Reprogramming of tRNA modifications controls the oxidative stress
response by codon-biased translation of proteins. Nat Commun. 2012;3:937. 21. Gu C, Begley TJ, Dedon PC. tRNA modifications regulate translation during
cellular stress. FEBS Lett. 2014;588(23):4287–96.
22. Endres L, Dedon PC, Begley TJ. Codon-biased translation can be regulated by wobble-base tRNA modification systems during cellular stress responses. RNA Biol. 2015;12(6):603–14.
23. Chionh YH, et al. tRNA-mediated codon-biased translation in mycobacterial hypoxic persistence. Nat Commun. 2016;7:13302.
24. Lu J, et al. All-trans retinoic acid promotes neural lineage entry by pluripotent embryonic stem cells via multiple pathways. BMC Cell Biol. 2009;10:57. 25. Bain G, et al. Retinoic acid promotes neural and represses mesodermal gene
expression in mouse embryonic stem cells in culture. Biochem Biophys Res Commun. 1996;223(3):691–4.
26. Maden M. Retinoic acid in the development, regeneration and maintenance of the nervous system. Nat Rev Neurosci. 2007;8(10):755–65.
27. Eiselleova L, et al. A complex role for FGF-2 in self-renewal, survival, and adhesion of human embryonic stem cells. Stem Cells. 2009;27(8):1847–57. 28. Ingolia NT. Ribosome footprint profiling of translation throughout the
genome. Cell. 2016;165(1):22–33.
29. Freimer JW, Hu TJ, Blelloch R. Decoupling the impact of microRNAs on translational repression versus RNA degradation in embryonic stem cells. Elife. 2018;7.https://doi.org/10.7554/eLife.38014.
30. Nakamura M, et al. Differentiation patterns of mouse embryonic stem cells and induced pluripotent stem cells into neurons. Cytotechnology. 2016; 68(3):409–17.
31. Boroviak T, et al. Lineage-specific profiling delineates the emergence and progression of naive pluripotency in mammalian embryogenesis. Dev Cell. 2015;35(3):366–82.
32. Kalkan T, et al. Tracking the embryonic stem cell transition from ground state pluripotency. Development. 2017;144(7):1221–34.
33. Mohammed H, et al. Single-cell landscape of transcriptional heterogeneity and cell fate decisions during mouse early gastrulation. Cell Rep. 2017;20(5):1215–28. 34. Cunningham TJ, Duester G. Mechanisms of retinoic acid signalling and its roles
in organ and limb development. Nat Rev Mol Cell Biol. 2015;16(2):110–23. 35. Itskovitz-Eldor J, et al. Differentiation of human embryonic stem cells into
embryoid bodies compromising the three embryonic germ layers. Mol Med. 2000;6(2):88–95.
36. Pruitt KD, et al. The consensus coding sequence (CCDS) project: identifying a common protein-coding gene set for the human and mouse genomes. Genome Res. 2009;19(7):1316–23.
37. Boel G, et al. Codon influence on protein expression in E. coli correlates with mRNA levels. Nature. 2016;529(7586):358–63.
38. Presnyak V, et al. Codon optimality is a major determinant of mRNA stability. Cell. 2015;160(6):1111–24.
39. Bazzini AA, et al. Codon identity regulates mRNA stability and translation efficiency during the maternal-to-zygotic transition. EMBO J. 2016;35(19):2087–103. 40. Wu Q, Medina SG, Kushawah G, DeVore ML, Castellano LA, Hand JM, Wright
M, Bazzini AA. Translation affects mRNA stability in a codon-dependent manner in human cells. Elife. 2019;8:e45396.
41. Newman ZR, et al. Differences in codon bias and GC content contribute to the balanced expression of TLR7 and TLR9. Proc Natl Acad Sci U S A. 2016; 113(10):E1362–71.
42. Barahimipour R, et al. Dissecting the contributions of GC content and codon usage to gene expression in the model alga Chlamydomonas reinhardtii. Plant J. 2015;84(4):704–17.
43. Gromadski KB, Daviter T, Rodnina MV. A uniform response to mismatches in codon-anticodon complexes ensures ribosomal fidelity. Mol Cell. 2006;21(3):369–77. 44. Hanson G, Coller J. Codon optimality, bias and usage in translation and
mRNA decay. Nat Rev Mol Cell Biol. 2018;19(1):20–30.
45. Ingolia NT, et al. Ribosome profiling reveals pervasive translation outside of annotated protein-coding genes. Cell Rep. 2014;8(5):1365–79.
alkylamino acids in translation. Proc Natl Acad Sci U S A. 2009;106(1):50–4. 47. Fluitt A, Pienaar E, Viljoen H. Ribosome kinetics and aa-tRNA competition
determine rate and fidelity of peptide synthesis. Comput Biol Chem. 2007; 31(5–6):335–46.
48. Varenne S, et al. Translation is a non-uniform process. Effect of tRNA availability on the rate of elongation of nascent polypeptide chains. J Mol Biol. 1984;180(3):549–76.
49. Ingolia NT, Lareau LF, Weissman JS. Ribosome profiling of mouse embryonic stem cells reveals the complexity and dynamics of mammalian proteomes. Cell. 2011;147(4):789–802.
50. Smith AG, et al. Differentiation inhibiting activity (DIA/LIF) and mouse development. Dev Biol. 1992;151(2):339–51.
51. Williams RL, et al. Myeloid leukaemia inhibitory factor maintains the
developmental potential of embryonic stem cells. Nature. 1988;336(6200):684–7. 52. Wobus AM, et al. Embryonic stem cells as a model to study cardiac, skeletal
muscle, and vascular smooth muscle cell differentiation. Methods Mol Biol. 2002;185:127–56.
53. Agris PF. The importance of being modified: an unrealized code to RNA structure and function. RNA. 2015;21(4):552–4.
54. Tsutsumi S, et al. Wobble inosine tRNA modification is essential to cell cycle progression in G(1)/S and G(2)/M transitions in fission yeast. J Biol Chem. 2007;282(46):33459–65.
55. Rafels-Ybern À, Torres AG, Grau-Bove X, Ruiz-Trillo I, Ribas de Pouplana L. Codon adaptation to tRNAs with Inosine modification at position 34 is widespread among Eukaryotes and present in two Bacterial phyla. RNA Biol. 2018;15(4-5):500–7.
56. Gerber AP, Keller W. An adenosine deaminase that generates inosine at the wobble position of tRNAs. Science. 1999;286(5442):1146–9.
57. Torres AG, et al. A-to-I editing on tRNAs: biochemical, biological and evolutionary implications. FEBS Lett. 2014;588(23):4279–86.
58. Sprinzl M, et al. Compilation of tRNA sequences and sequences of tRNA genes. Nucleic Acids Res. 1998;26(1):148–53.
59. Khade PK, Joseph S. Messenger RNA interactions in the decoding center control the rate of translocation. Nat Struct Mol Biol. 2011;18(11):1300–2. 60. Shah P, et al. Rate-limiting steps in yeast protein translation. Cell. 2013;(153,
7):1589–601.
61. Blanco S, et al. Stem cell function and stress response are controlled by protein synthesis. Nature. 2016;534(7607):335–40.
62. Signer RA, et al. Haematopoietic stem cells require a highly regulated protein synthesis rate. Nature. 2014;509(7498):49–54.
63. Llorens-Bobadilla E, et al. Single-cell transcriptomics reveals a population of dormant neural stem cells that become activated upon brain injury. Cell Stem Cell. 2015;17(3):329–40.
64. Sampath P, et al. A hierarchical network controls protein translation during murine embryonic stem cell self-renewal and differentiation. Cell Stem Cell. 2008;2(5):448–60.
65. Raina M, Ibba M. tRNAs as regulators of biological processes. Front Genet. 2014;5:171.
66. Ingolia NT, et al. Genome-wide analysis in vivo of translation with nucleotide resolution using ribosome profiling. Science. 2009;324(5924):218–23. 67. Gerashchenko MV, Lobanov AV, Gladyshev VN. Genome-wide ribosome
profiling reveals complex translational regulation in response to oxidative stress. Proc Natl Acad Sci U S A. 2012;109(43):17394–9.
68. Hsieh AC, et al. The translational landscape of mTOR signalling steers cancer initiation and metastasis. Nature. 2012;485(7396):55–61.
69. Thoreen CC, et al. A unifying model for mTORC1-mediated regulation of mRNA translation. Nature. 2012;485(7396):109–13.
70. Zhou Z, et al. Codon usage is an important determinant of gene expression levels largely through its effects on transcription. Proc Natl Acad Sci U S A. 2016;113(41):E6117–25.
71. Ranjan N, Rodnina MV. tRNA wobble modifications and protein homeostasis. Translation (Austin). 2016;4(1):e1143076.
72. Rubio MA, et al. An adenosine-to-inosine tRNA-editing enzyme that can perform C-to-U deamination of DNA. Proc Natl Acad Sci U S A. 2007; 104(19):7821–6.
73. Rubio MA, et al. Editing and methylation at a single site by functionally interdependent activities. Nature. 2017;542(7642):494–7.
75. Kim D, et al. TopHat2: accurate alignment of transcriptomes in the presence of insertions, deletions and gene fusions. Genome Biol. 2013;14(4):R36. 76. Harrow J, et al. GENCODE: the reference human genome annotation for the
ENCODE project. Genome Res. 2012;22(9):1760–74.
77. Mudge JM, Harrow J. Creating reference gene annotation for the mouse C57BL6/J genome assembly. Mamm Genome. 2015;26(9–10):366–78. 78. Langmead B, et al. Ultrafast and memory-efficient alignment of short DNA
sequences to the human genome. Genome Biol. 2009;10(3):R25. 79. Chan PP, Lowe TM. GtRNAdb 2.0: an expanded database of transfer RNA
genes identified in complete and draft genomes. Nucleic Acids Res. 2016; 44(D1):D184–9.
80. Ramirez F, et al. deepTools2: a next generation web server for deep-sequencing data analysis. Nucleic Acids Res. 2016;44(W1):W160–5. 81. Liao Y, Smyth GK, Shi W. featureCounts: an efficient general purpose
program for assigning sequence reads to genomic features. Bioinformatics. 2014;30(7):923–30.
82. Love MI, Huber W, Anders S. Moderated estimation of fold change and dispersion for RNA-seq data with DESeq2. Genome Biol. 2014;15(12):550. 83. Nettling M, et al. DiffLogo: a comparative visualization of sequence motifs.
BMC Bioinformatics. 2015;16:387.
84. Bornelöv S, Selmi T, Flad S, Dietmann S, Frye M. Codon usage optimization in pluripotent embryonic stem cells. Datasets. Gene Expression Omnibus. 2019.https://www.ncbi.nlm.nih.gov/geo/query/acc.cgi?acc=GSE123611. Accessed 17 May 2019.
Publisher’s Note